4545
Free breathing cardiac T2 mapping via single-shot ZOOM-MOLED and deep learning reconstruction1Department of Electronic Science, Fujian Provincial Key Laboratory of Plasma and Magnetic Resonance, Xiamen University, Xiamen, China, 2Department of Radiology, Zhongshan Hospital Fudan University Xiamen Branch, Xiamen, China, 3MSC Clinical & Technical Solutions, Philips Healthcare, Shenzhen, China
Synopsis
Keywords: Quantitative Imaging, Quantitative Imaging, Data acquisition, Myocardium
Motivation: Quantitative cardiac magnetic resonance (CMR) imaging has important applications in clinic. However, conventional parametric mapping methods suffer from inherent inefficiencies.
Goal(s): To enhance the resolution of reconstructed images, mitigate image distortion and artifacts, and improve the signal-to-noise ratio in quantitative CMR imaging.
Approach: A method was proposed which combines single-shot multiple overlapping-echo detachment (MOLED) imaging with outer volume suppression (OVS) and zonal oblique multislice (ZOOM) techniques, and deep learning reconstruction was used for image reconstruction.
Results: The results of simulation, phantom, and in vivo healthy volunteer experiments show great performance of the proposed method.
Impact: This study developed a cardiac T2 mapping method without requirement of breath-holding or respiratory-gating. It paves the way for real-time dynamic high-resolution cardiac T2 mapping.
Introduction
Quantitative multi-parameter measurement of myocardial tissue1 in cardiac magnetic resonance (CMR) imaging is gaining momentum in clinical practice. Notably, myocardial T2 mapping offers valuable insights for tissue characterization, clinical diagnosis, and disease monitoring.2 However, conventional T2 mapping methods suffer from inherent inefficiencies due to the reliance on breath-holds and pauses during acquisition to mitigate respiratory and cardiac motion artifacts. As a millisecond-level single-shot sequence for T2 quantification, multiple overlapping-echo detachment (MOLED) imaging3,4 holds great potential in the field of CMR. However, the method is susceptible to image distortion and susceptibility artifacts due to B0 inhomogeneity. Furthermore, the signal from surrounding tissues of the heart does not provide additional information in quantitative CMR imaging. To overcome the above issues, this study introduces a novel method that combines MOLED with outer volume suppression5 (OVS) and zonal oblique multislice6 (ZOOM-MOLED), and utilizes deep learning reconstruction for quantitative CMR imaging.Methods
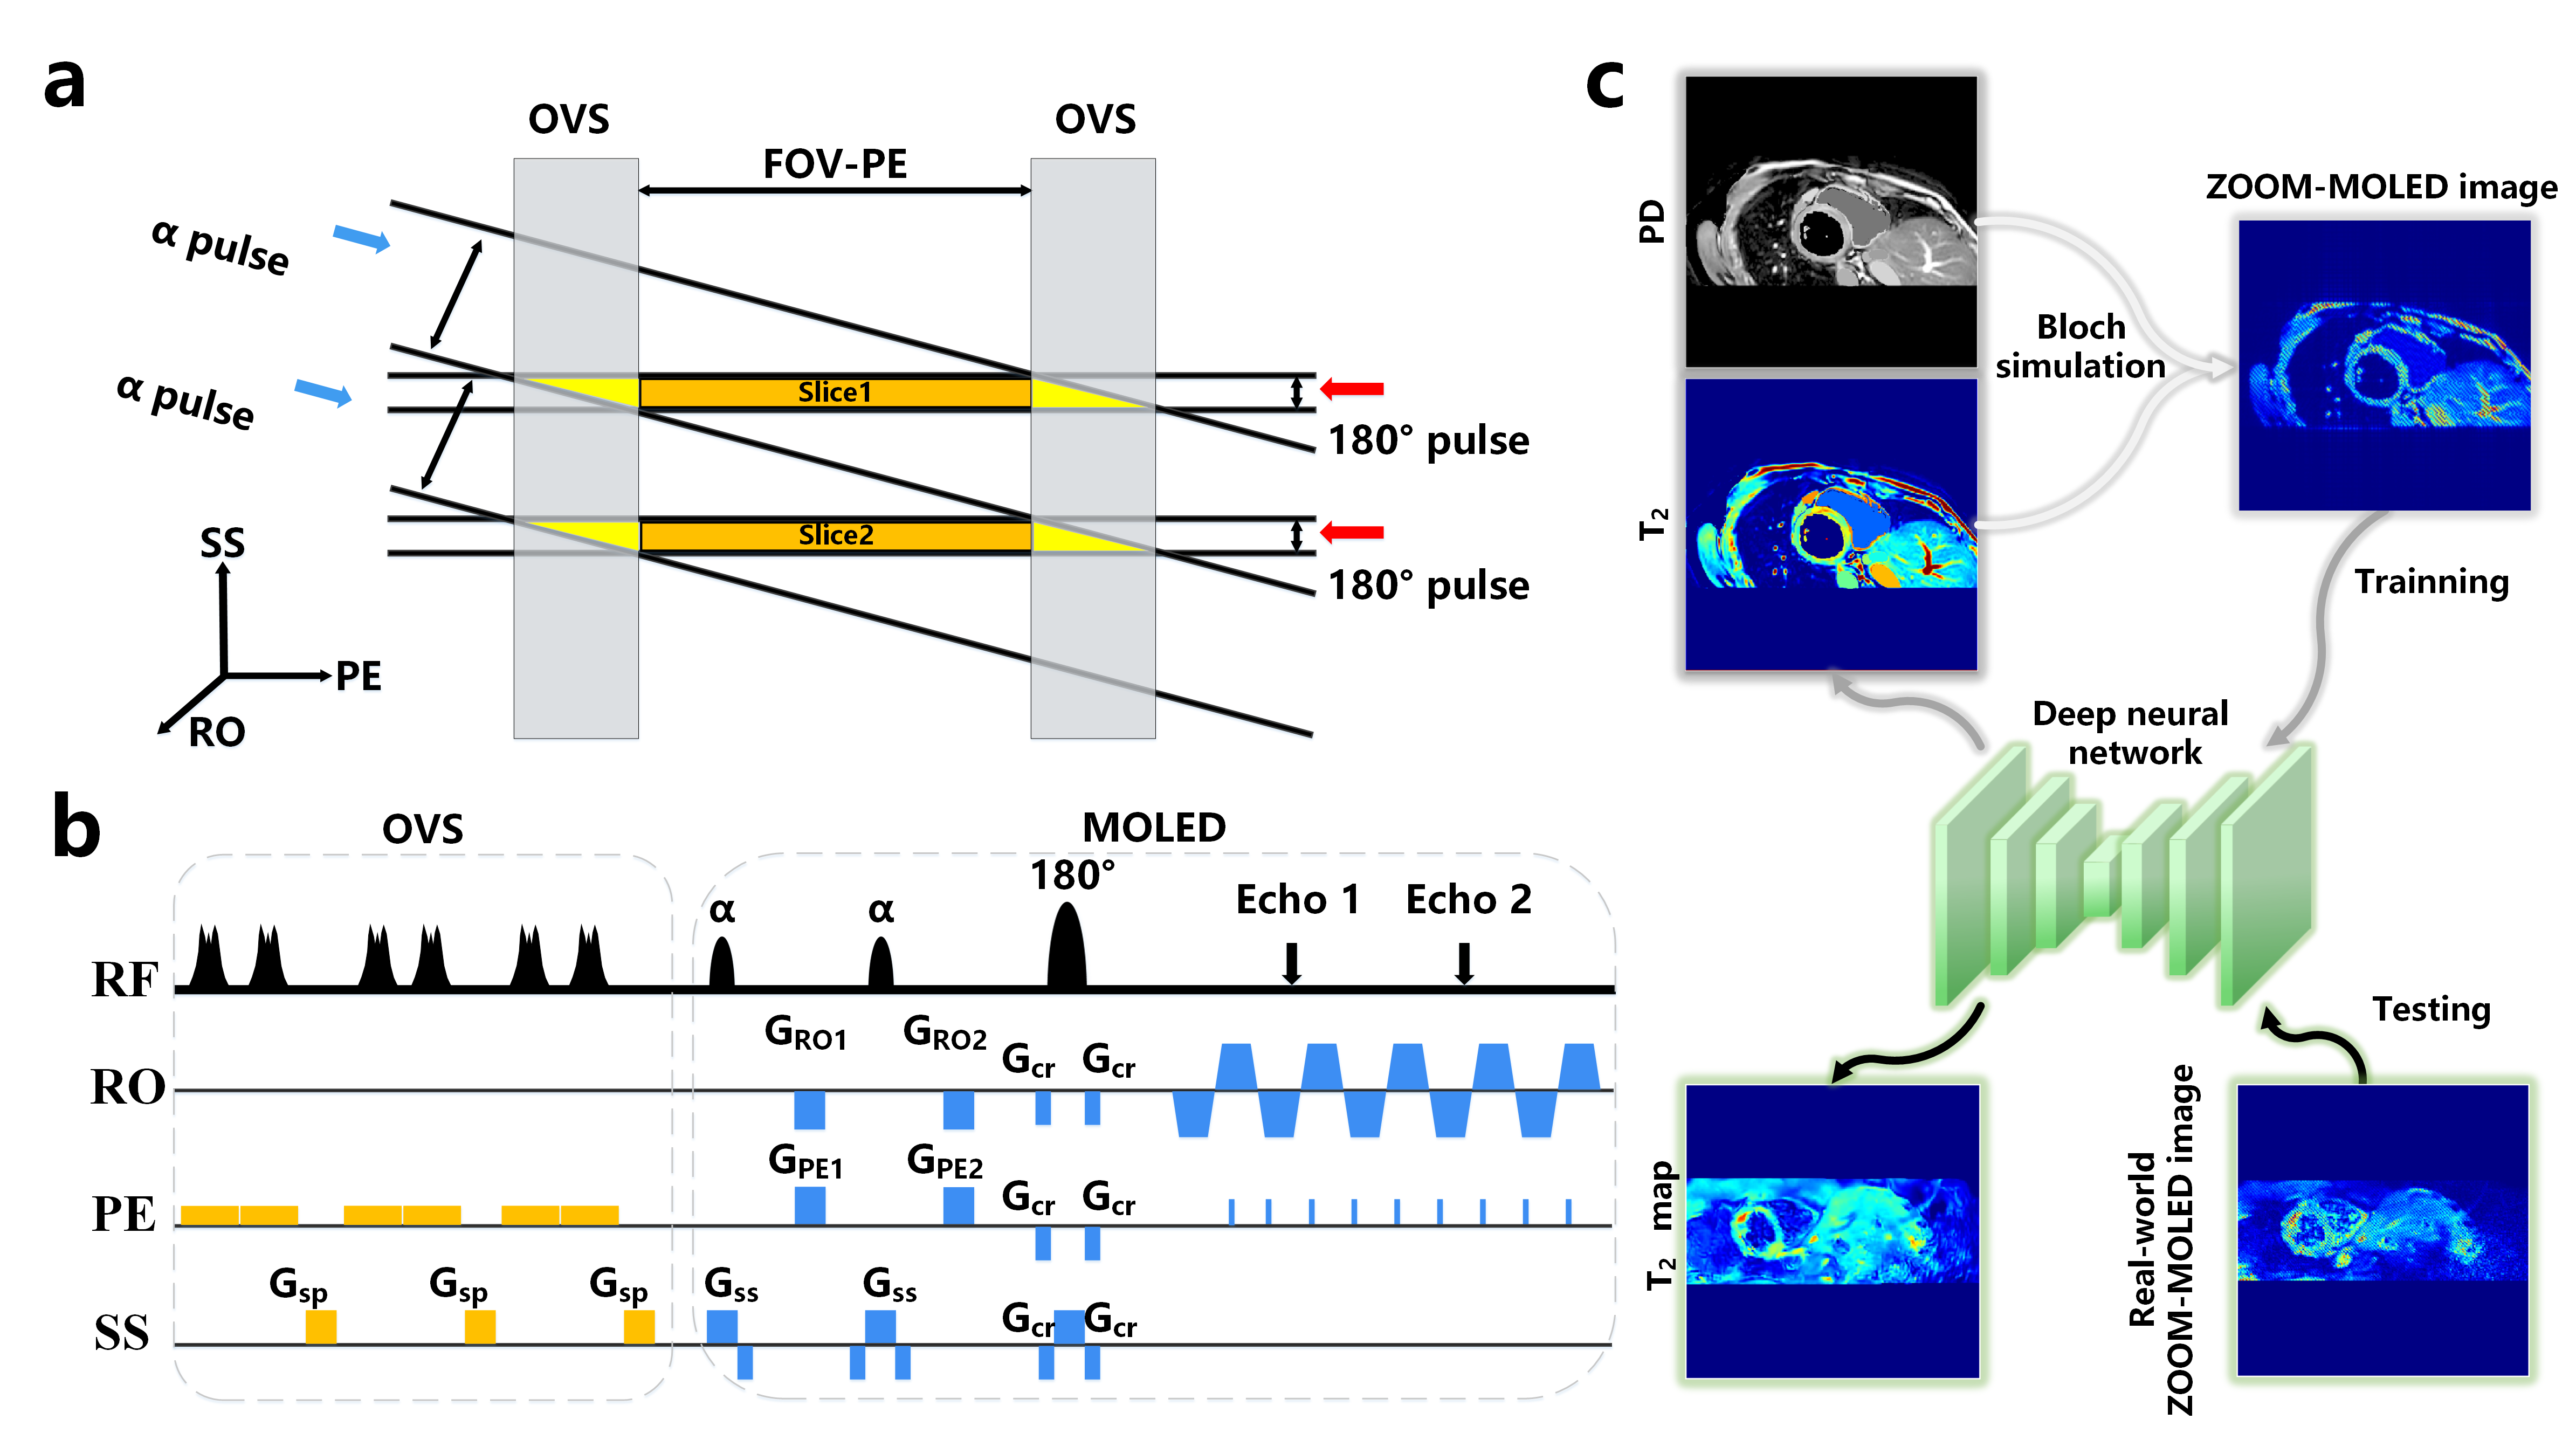
Pulse sequence: The principle of ZOOM is illustrated in Figure 1(a). Due to the angle between the regions excited by the two excitation pulses and the final imaging plane, the signal from the overlapping region between the region experienced by the excitation pulse and the central part of the imaged object is preserved for imaging. The OVS module is used to suppress signals outside the field of view (FOV). The sequence diagram of ZOOM-MOLED is illustrated in Figure 1(b). In the OVS module, a total of three pairs of Shinnar-Le Roux (SLR) pulses are included. Each pair of SLR pulses suppresses signals on the left and right sides of the FOV, respectively. Following the SLR pulse, a spoiled gradient is applied in the phase-encoding (PE) direction. In the MOLED module, two α = 45° excitation pulses are used to create two main echo signals with different evolution time. The echo-shifting gradient shift the two main echoes from the k-space center. After the refocusing pulse, the signal is collected using EPI readout train.Materials and data acquisitions: The phantom contained 9 small tubes with different concentrations of MnCl2 in water, resulting in a T2 range of 30-140 ms. Experimental parameters were as follows: FOV = 15×7.7 cm2, acquisition matrix = 108×55, slice thickness = 3 mm. In vivo experiments were conducted on a healthy volunteer using a 32-chananel abdomen coil under free-breathing condition. Experimental parameters were as follows: TR = 3000 ms; FOV = 35×12 cm2; acquisition matrix = 176×60; slice thickness = 8.0 mm. ETL = 60, ESP = 0.559 ms. This study was approved by the IRB at Zhongshan Hospital Fudan University Xiamen Branch. All experiments were carried out on a 3T MRI scanner (Ingenia CX, Philips Healthcare, Best, Netherlands).
Reconstruction: Figure 1(c) illustrates the data flow involved in synthetic data generation, network training, and testing. The ZOOM-MOLED images were synthesized using Bloch simulation with proton density (PD) and T2 templates.7 The Bloch simulation was conducted using MRiLab,8 considering multiple non-ideal factors such as noise, inhomogeneous B1 field, and imperfect echo-shift gradients. The reconstruction network utilized a deep encoder-decoder neural network.
Results
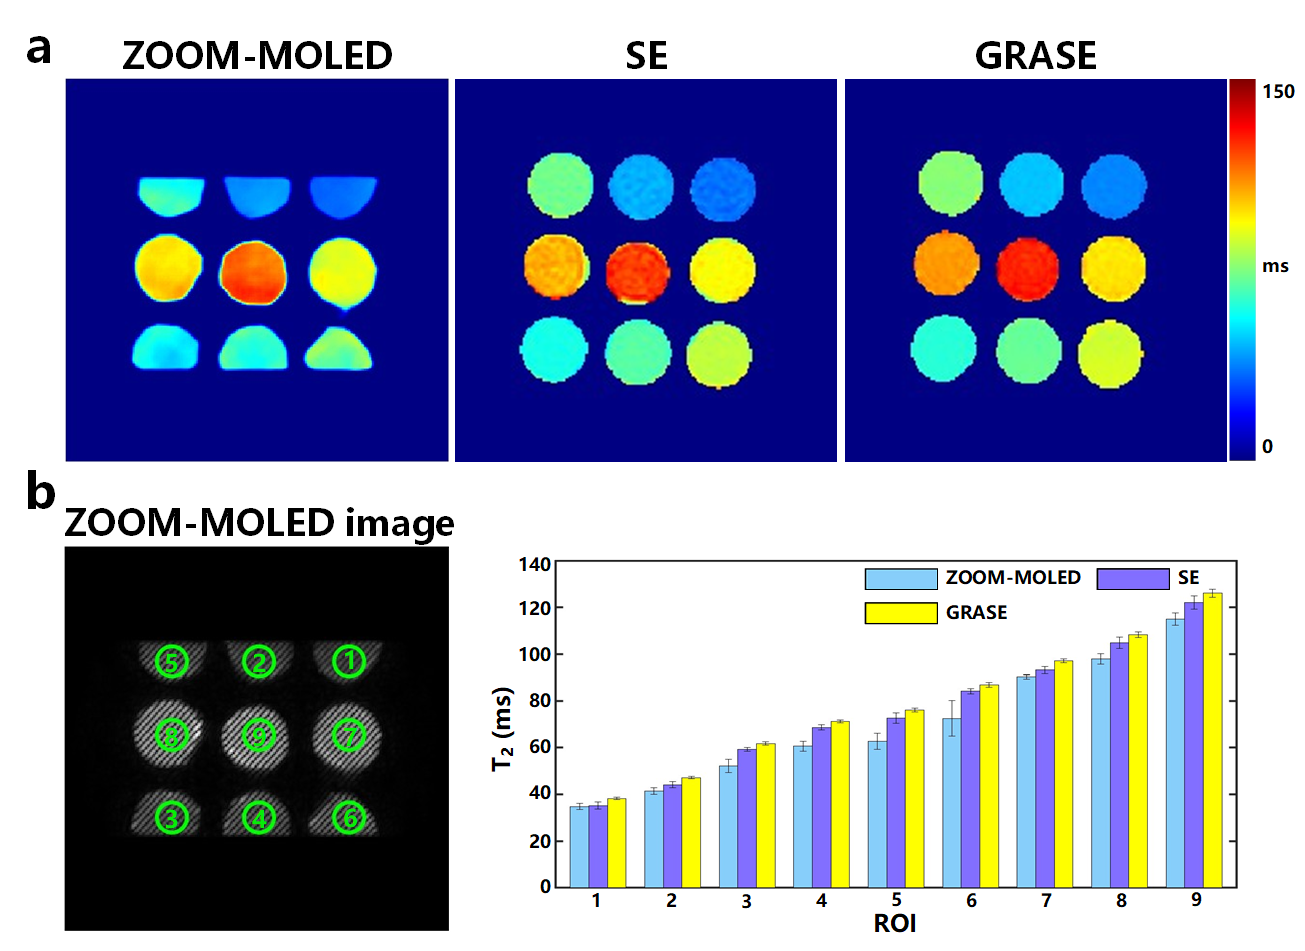
Numerical Simulation: The averages and standard deviations (SDs) of root mean square error (RMSE) and structural similarity (SSIM) for the T2 maps of the test dataset were calculated as 0.057±0.001ms and 96.9%±0.5%, respectively.Phantom Validation: The reconstructed T2 maps from ZOOM-MOLED, as well as the calculated T2 maps from SE and GRASE images, are shown in Figure 2(a). The means and SDs of the T2 quantitative results obtained from nine regions of interest (ROIs) using ZOOM-MOLED, SE, and GRASE methods are plotted in Figure 2(b). The figure demonstrates that the T2 values obtained by ZOOM-MOLED are in close agreement with those obtained by the reference method SE. However, the T2 values obtained by GRASE tend to be slightly higher.
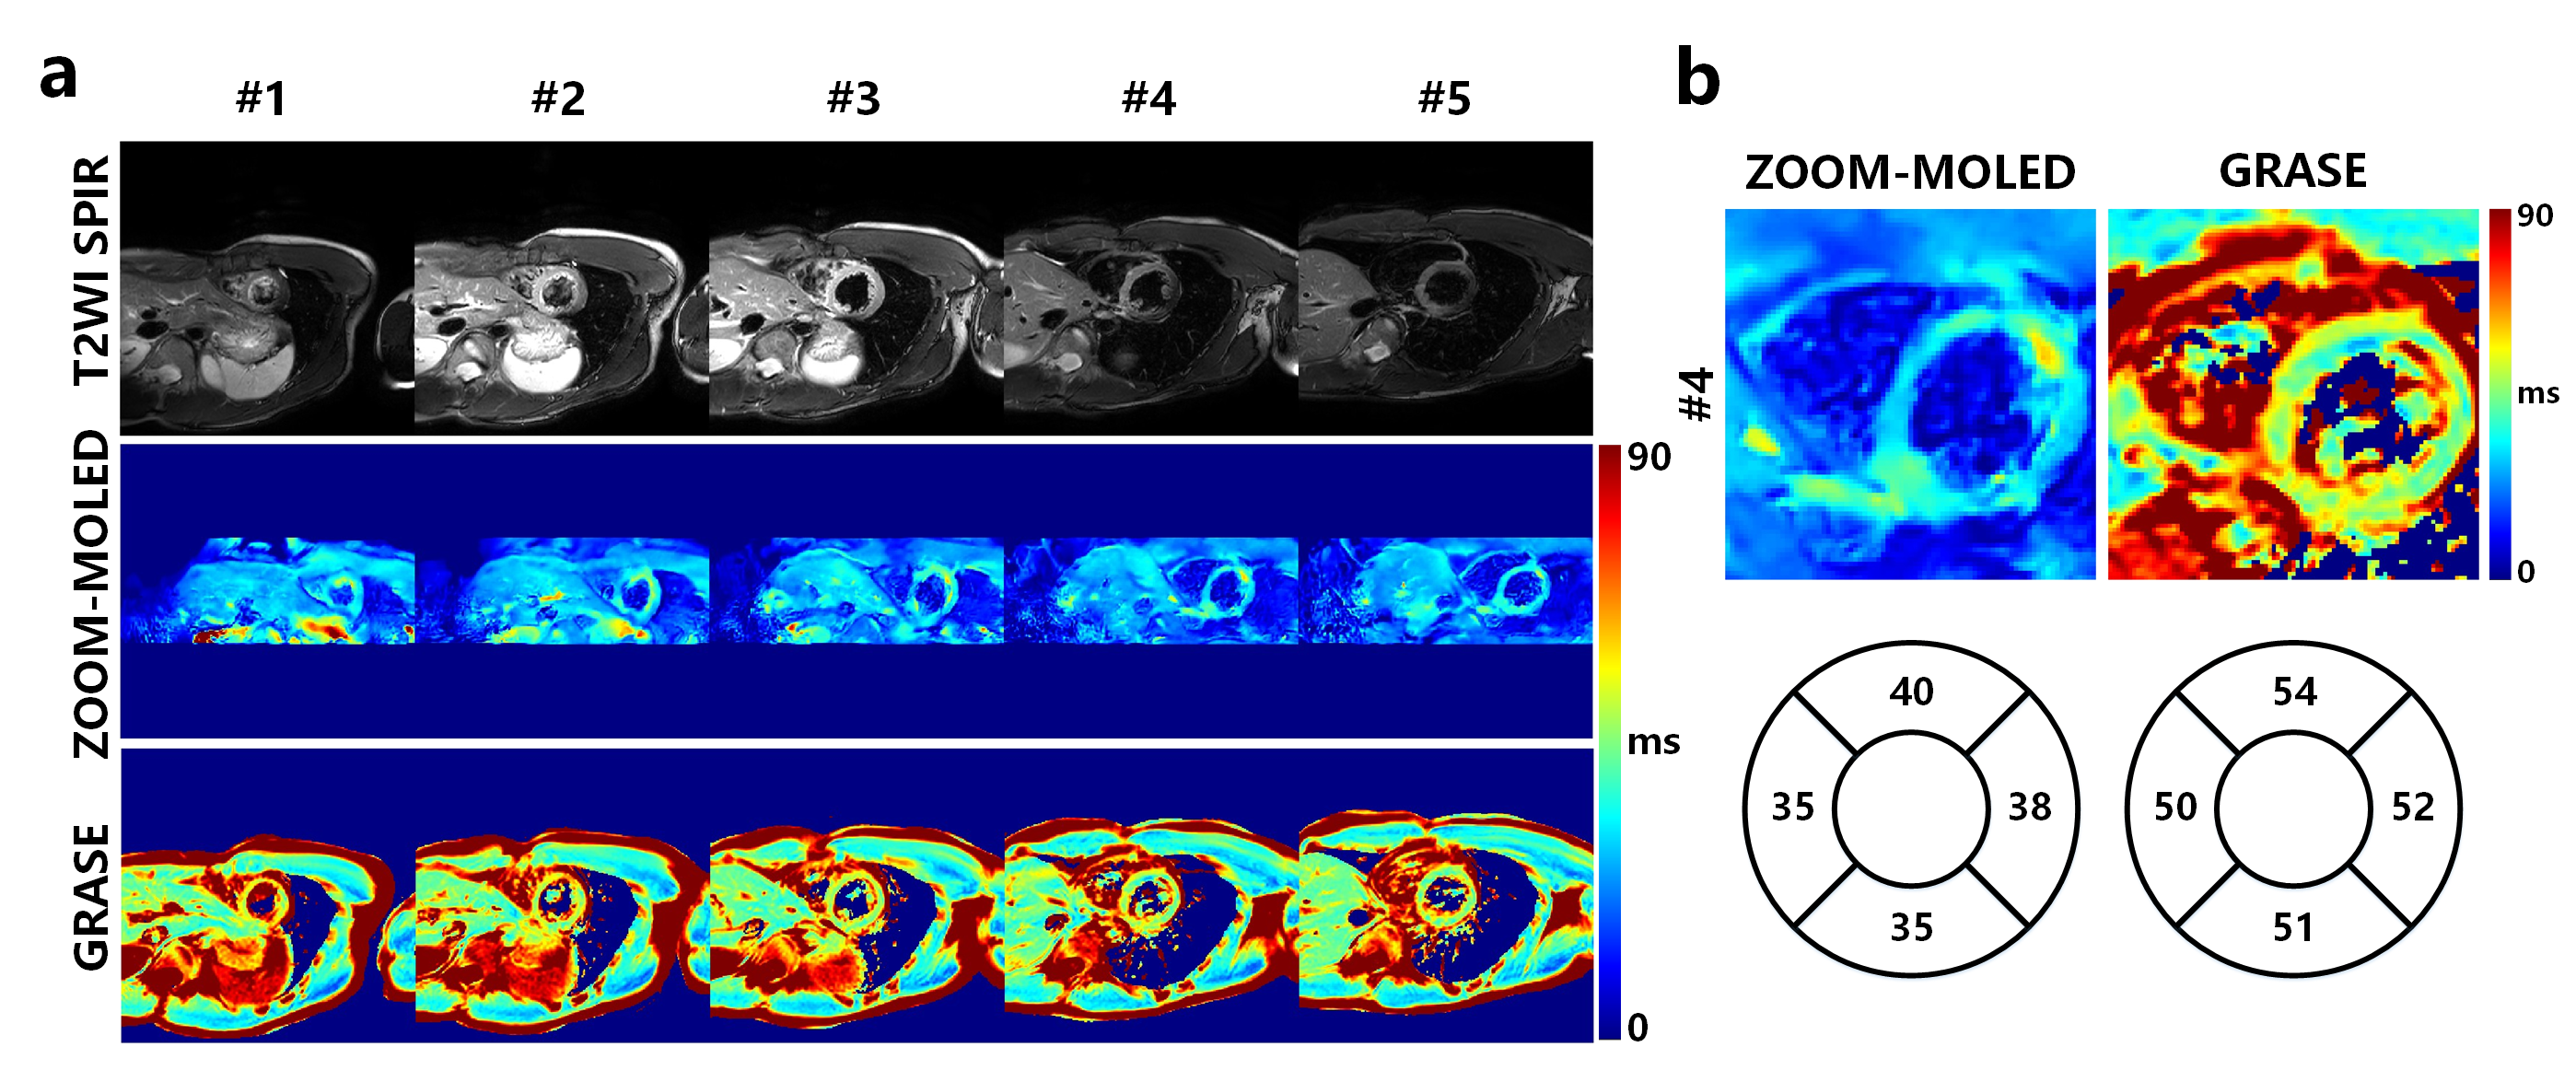
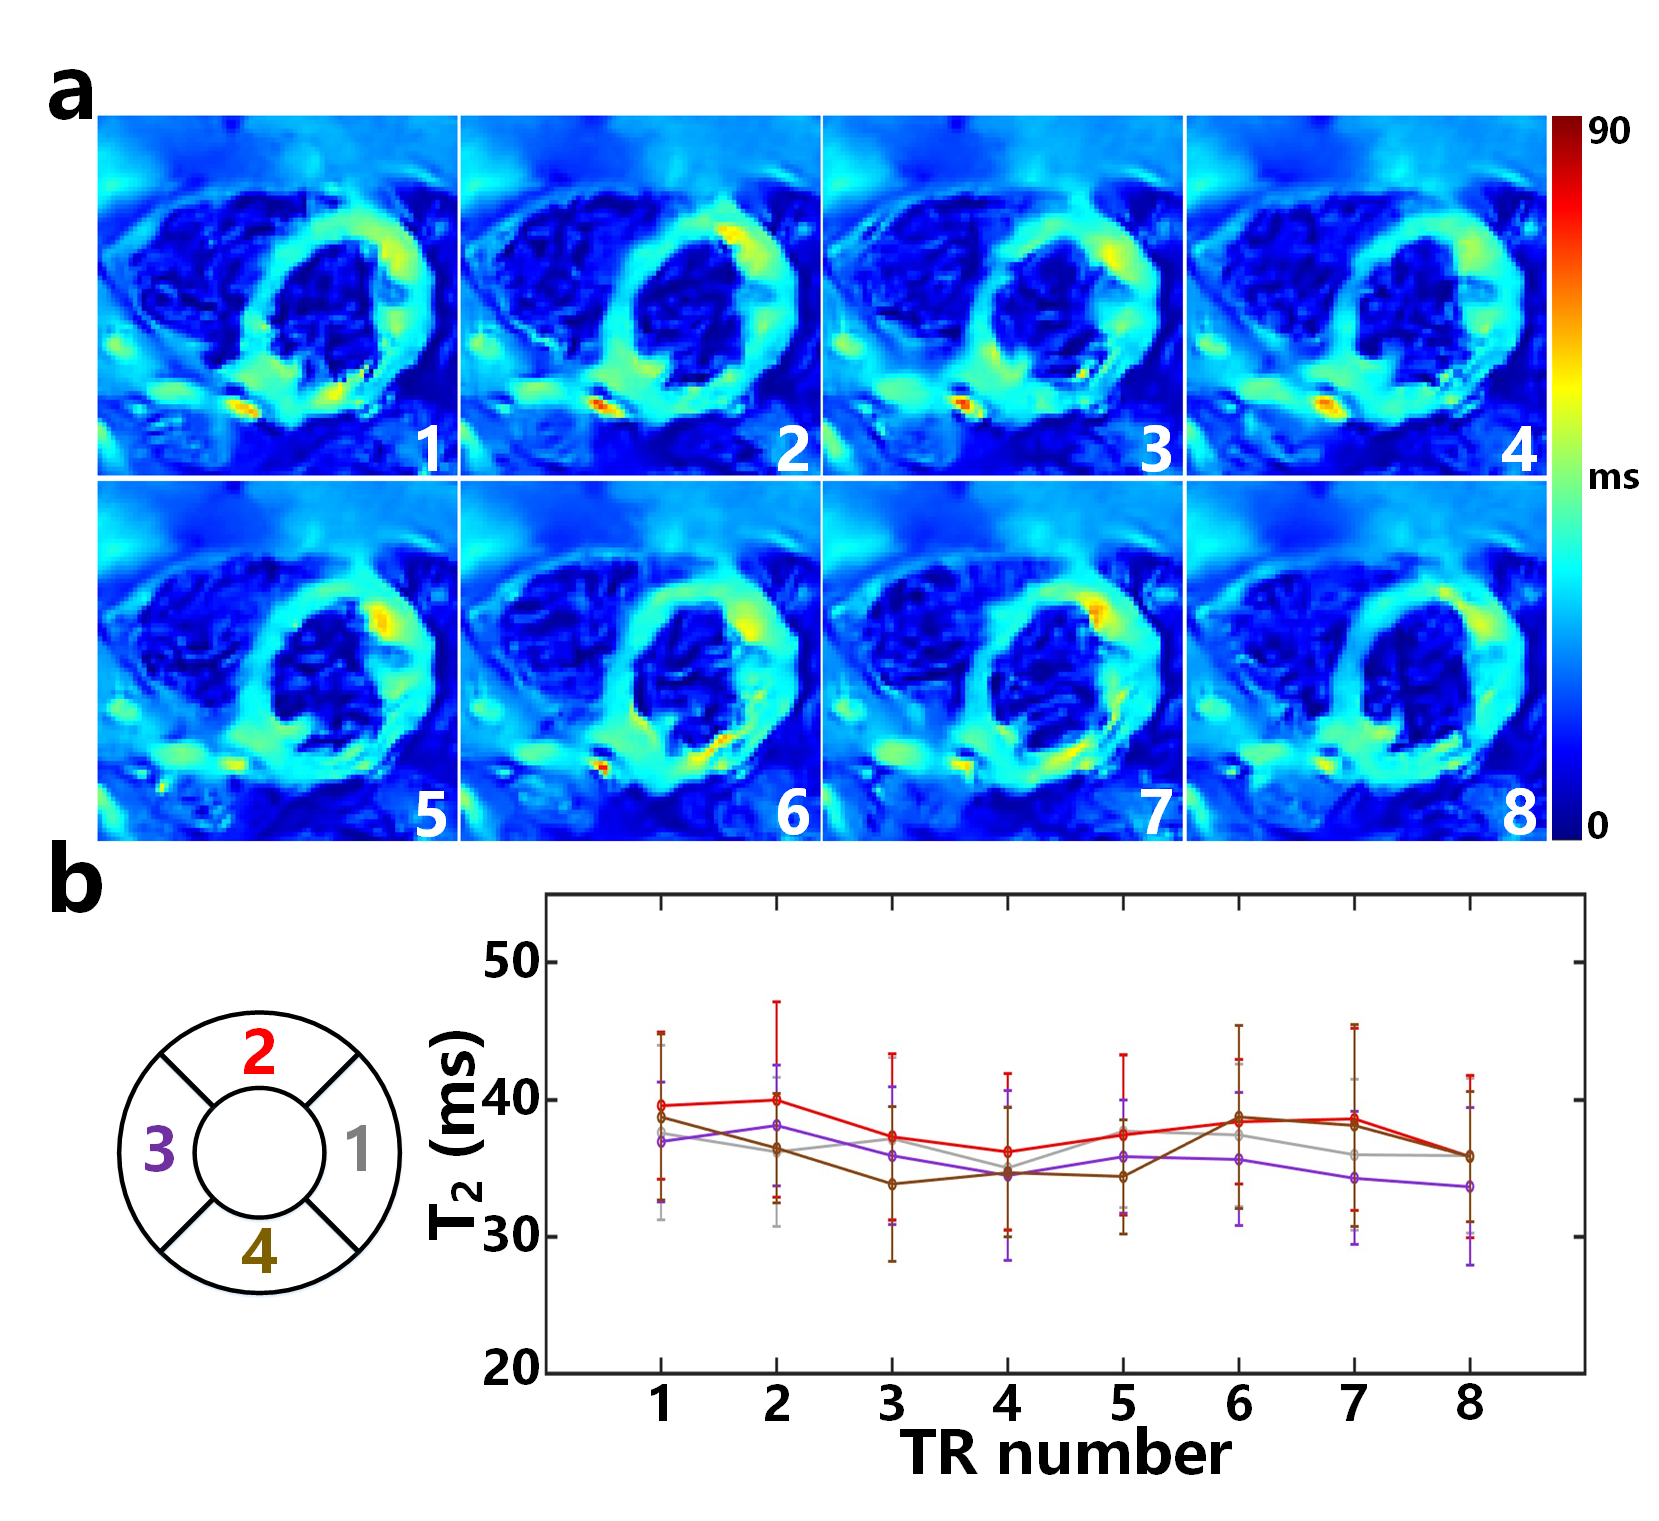
Healthy volunteer: Figure 3(a) depicts the T2 maps and T2-weighted images of a healthy volunteer. Figure 3(b) shows the enlarge views of the myocardial region from a representative slice and Bullseye plot of average T2. The T2 values obtained through the GRASE method are higher than those obtained through the ZOOM-MOLED method, as has been seen in the phantom experiments. Figure 4 shows the variations of T2 values of different ROIs in myocardial tissue during repeated scans.
Discussion and conclusion
The proposed method combines MOLED, OVS, and ZOOM techniques, along with deep learning reconstruction, which allows for precise and reliable T2 mapping in CMR under free breathing. The quantitative results demonstrate that the T2 values from ZOOM-MOLED are consistent with the reference measurements on the phantom and in vivo, and are also with high repeatability.Acknowledgements
This work was supported by the National Natural Science Foundation of China under grant numbers 12375291, 82071913 and 22161142024.References
1. Christodoulou AG, Shaw JL, Nguyen C, et al. Magnetic resonance multitasking for motion-resolved quantitative cardiovascular imaging. Nature Biomed Eng. 2018;2:215-226.
2. Mordi I, Carrick D, Bezerra H, et al. T1 and T2 mapping for early diagnosis of dilated non-ischaemic cardiomyopathy in middle-aged patients and differentiation from normal physiological adaptation. Eur Heart J Cardiovasc Imaging. 2016;17:797-803.3.
3. Cai CB, Zeng YQ, Zhuang YC, et al. Single-shot T2 mapping through overlapping-echo detachment (OLED) planar imaging. IEEE Trans Biomed Eng. 2017; 64: 2450-2461.4.
4. Zhang J, Wu J, Chen SJ, et al. Robust single-shot T2 mapping via multiple overlapping-echo acquisition and deep neural network. IEEE Trans Med Imaging. 2019;38:1801-1811.5.
5. Wilm B J, Svensson J, Henning A, et al. Reduced field-of-view MRI using outer volume suppression for spinal cord diffusion imaging. Magn Reson Med. 2007;57:625-630.6.
6. Korn N, Kurhanewicz J, Banerjee S, et al. Reduced-FOV excitation decreases susceptibility artifact in diffusion-weighted MRI with endorectal coil for prostate cancer detection. Mag Reson Imaging, 2015;33:56-62.7.
7. Yang QQ, Lin YH, Wang JC, et al. Model-based synthetic data-driven learning (MOST-DL): Application in single-shot T2 mapping with severe head motion using overlapping-echo acquisition. IEEE Trans Med Imaging. 2022;41:3167-3181.8.
8. Liu F, Velikina JV, Block WF, et al. Fast realistic MRI simulations based on generalized multi-pool exchange tissue model. IEEE Trans Med Imaging. 2017;36:527-537.
Figures