4541
Quantitative MRI Measurements Record Pancreatic Cancer and Stroma Reactions to New KRAS Inhibitor1Radiology, University of Pennsylvania, Philadelphia, PA, United States, 2Abramson Cancer Center, University of Pennsylvania, Philadelphia, PA, United States
Synopsis
Keywords: Small Animals, Cancer, Treatment Response
Motivation: KRAS mutations occur in 90% of pancreatic ductal adenocarcinoma(PDA) with G12Dmutation being the most common.Recent KRAS(G12D) inhibitors have unraveled an exciting therapeutic opportunity for this deadly cancer,as they are being tested in clinical trials.
Goal(s): However, the prior use of KRAS(G12C)inhibitors in lung cancer treatment showed mere 50% patient response,despite the accurate genetic mutation,calling for biomarkers which can assess the drug-target engagement early on and predict treatment outcome.
Approach: To test the utility of translational MRI markers in a clinically relevant PDA model for early responses to KRAS(G12D) inhibitor,MRTX1133.
Results: ADC,Ktrans and MTR captured MRTX1133 induced early cancer cell death and stroma change.
Impact: Our study in genetically engineered mouse model of pancreatic cancer supports that clinical translatable MRI metrics (ADC, Ktrans and MTR) are promising for capturing early pharmacodynamic responses to KRAS inhibitor MRTX1133.
Introduction
Pancreatic ductal adenocarcinoma (PDA) is a deadly cancer with limited treatment options. Oncogene KRAS mutations found in majority of PDA patients with KRAS(G12D) mutation being the most common(1). KRAS mutations drive both cancer progression and the formation of dense stroma that features high interstitial fluid pressure (IFP)(2,3) and abundant extracellular matrix contents(4). A new KRAS(G12D) inhibitor, MRTX1133(5,6) has been shown to induce rapid tumor shrinkage (regression) in mouse models of PDA while the effect on stroma is only revealed by postmortem analyses of tumor specimens(7), making it hard to assess the dynamics of stroma remodeling. Furthermore, in clinical testing of KRAS(G12C) inhibitor, only ~50% of patients responded to the treatment despite the presence of correct genetic mutation in biopsy specimens(8), therefore, early and accurate assessment of the drug-target engagement is important in clinical setting. Our study was designed to test the hypothesis that multimetric-MRI captures early cell death and tumor microenvironment (TME) changes in response to KRAS(G12D) inhibitor in a clinically relevant model of PDA. We specifically evaluated apparent diffusion coefficient (ADC) derived from diffusion weighted (DW), Ktrans derived dynamic contrast enhanced (DCE) MRI and magnetization transfer ratio (MTR). To mitigate respiratory motion related challenges in mouse abdomen DW- and DCE-MRI, we have implemented radial k-spacing sampling schemes including 3D stack-of-stars and KWIC reconstruction to obtain motion robustness and image quality (9-11).Methods
A genetically engineered model of PDA bearing KRAS(G12D) and Trp53 mutation referred to as KPC(12,13) that recaptures the saline features of human PDA including the dense stroma(12-14) was used. Male and female KPC mice were enrolled to receive MRTX1133 at 30mg/kg BID or PBS via intraperitoneal injection. Murine PDA cells bearing KRAS(G12C) mutation (7) was inoculated in the flank of C57BL/6 mice to grow subcutaneous tumors. In vivo DW- and DCE-MRI were obtained on a 9.4T Bruker system as described previously (9-11). A 3D GRE-MTR (FOV=32x32x8 mm, matrix=64x64x16, TR/TE /flip = 5.7 /2.8 ms /5°, averages = 4) with an 18 sec 2.5 μT saturation pulse was applied at 4 kHz (MT_ON) and 250 kHz (reference) off-resonance, respectively was also acquired. Pixel-wise MTR maps were calculated using:(REF - MT_ON)/REF. The collagen content was also determined based on the alkaline hydrolysis to yield free hydroxyproline and quantified by measuring absorbance at 560nm.Results and discussion
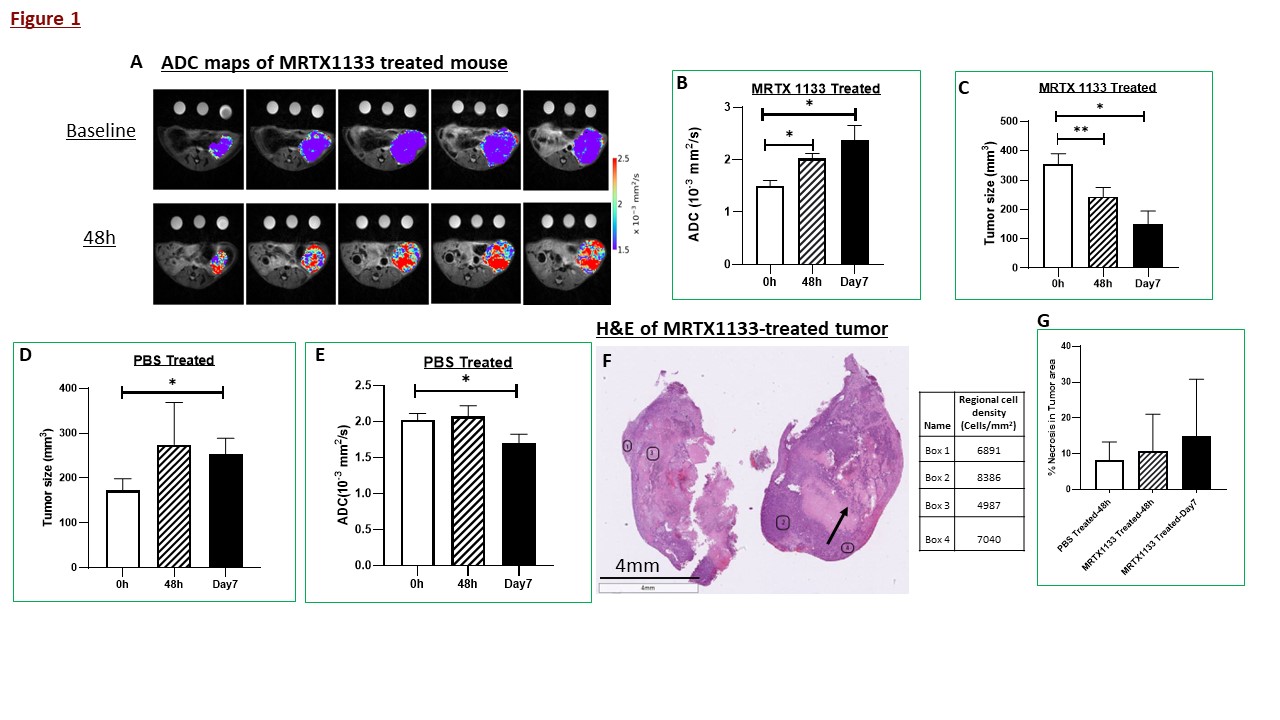
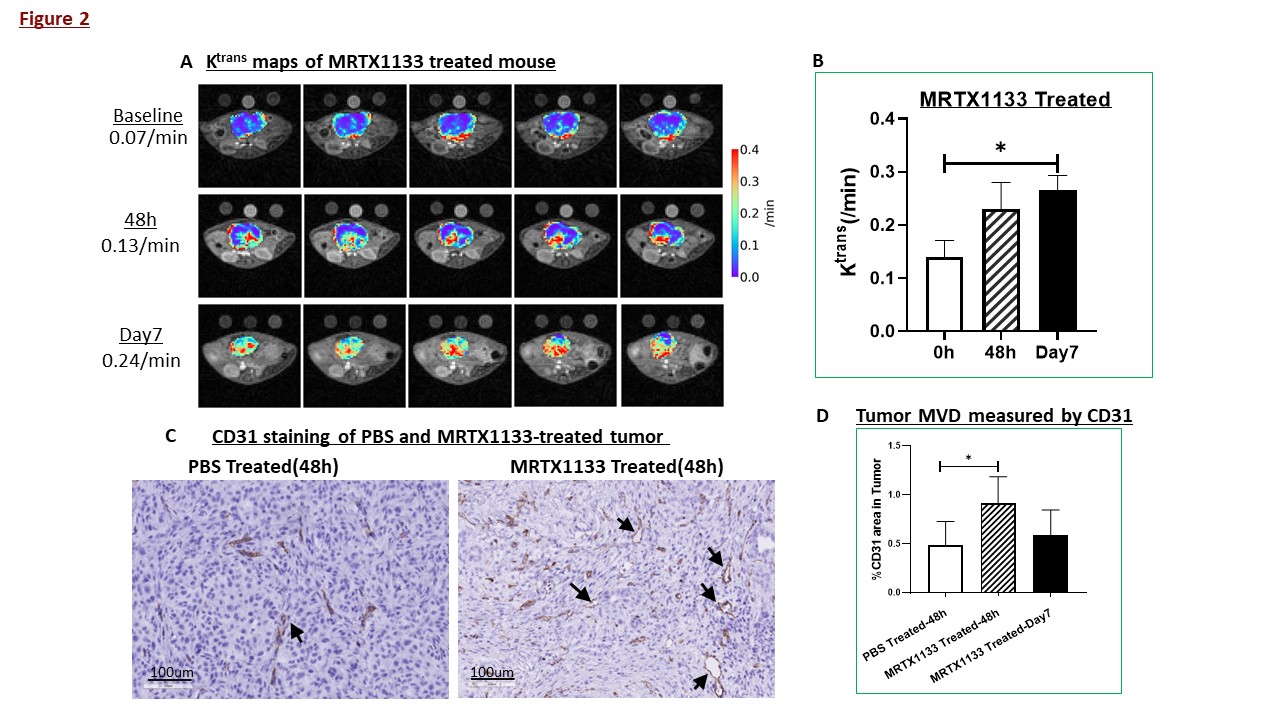
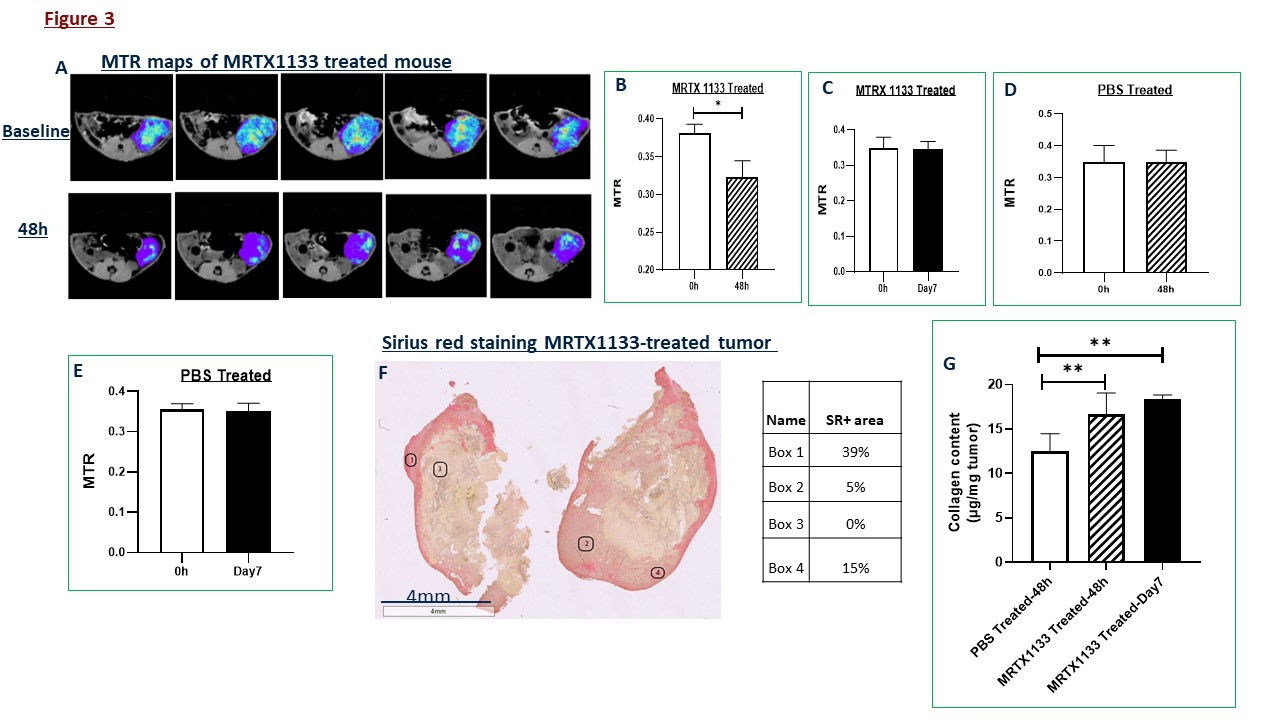
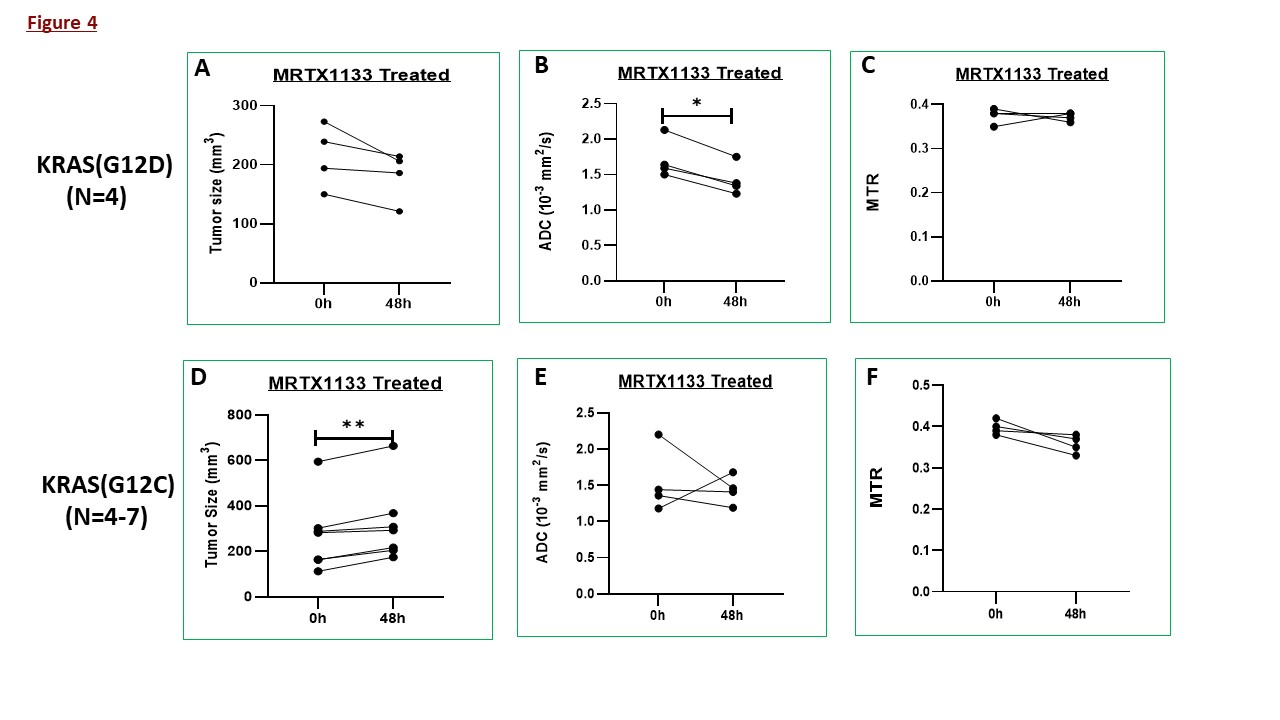
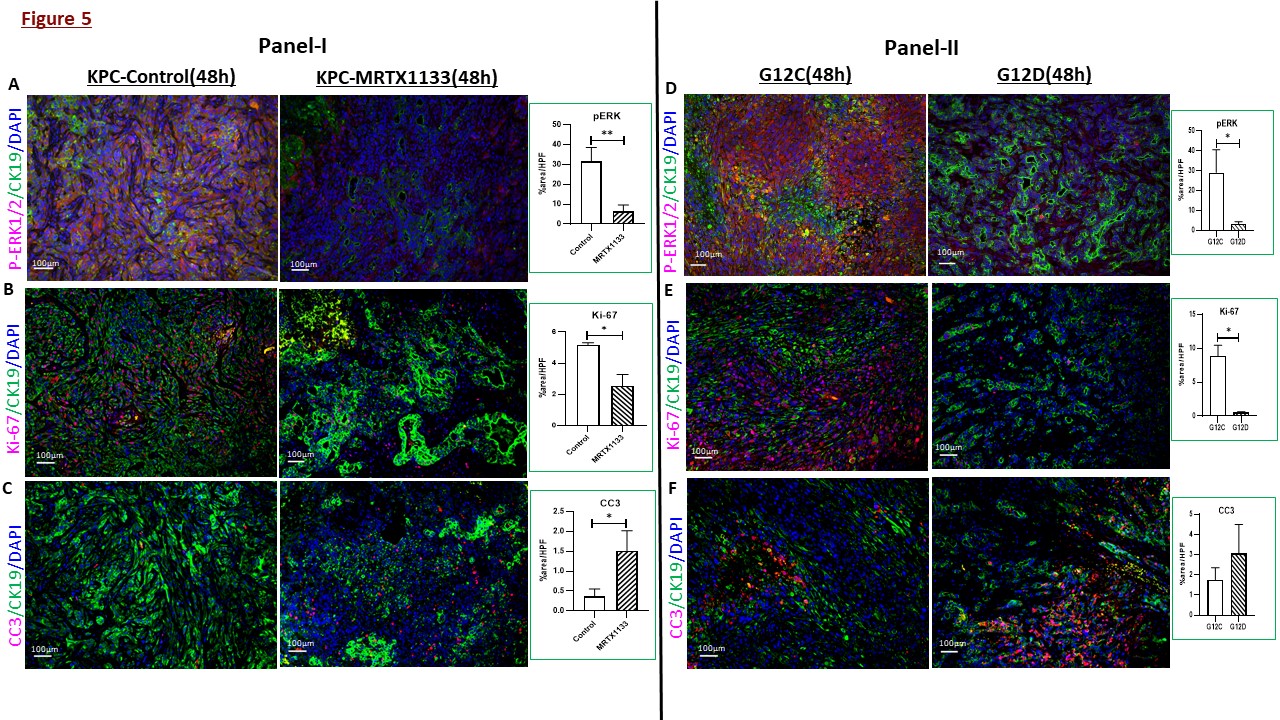
In KPC mice, striking increases of tumor ADC were detected as early as 48h after treatment initiation (Figure 1A) and was confirmed by statistical analyses at 48h and day7 accompanied by decreases of tumor size (Figure 1B, C), in contrast to increased tumor size and decreased ADC in PBS-treated mice (Figure 1D-E). H&E-stained sections revealed gross necrosis (arrow) and extensive cell death, leading to reduced cancer cell density albeit heterogenous across the tumor (Figure 1F) accompanied by increase necrosis at 48hrs and day7 following treatment (Figure 1G). In tumors harvested after MRI, immunofluorescence confirmed the drug-target engagement by dramatically reduced p-ERK1/2 in treated mice accompanied by significantly reduced proliferation (by Ki67) and increased cell death (by cleaved caspase 3) shown in Figure 5A-C. A clear increase of Ktrans suggesting an increase of capillary permeability and/or perfusion was detected at 48h persisting to day7 (Figure 2A-B), corroborated by significant increase in microvascular density (MVD) by CD31 staining at 48hrs. Enlarged capillary lumen (arrows in Figure 2C) were observed, suggesting reduced IFP. Assays are being performed to estimate reduction of stromal hyaluronic acid (HA), which led to IFP reduction and increased permeability /perfusion(15,16). MTR metric captured a remarkable reduction at 48h(Figure 3A-B), whereas no changes in PBS-treated mic(Figure 3D-E.) Sirius red (SR) staining for collagen revealed a high degree of heterogeneity where regions of depletion versus dense SR staining coexist (boxes in Figure 3F), meanwhile an overall increase of tumor collagen content was detected by collagen assay (Figure 3G). These data suggest that MTR did not represent the change of tumor collagen content in this setting. Other factors that may contribute to MTR signal are being evaluated. We further demonstrated that the ADC captured the MRTX1133’s specificity to KRAS(G12D) mutation(Figure 4B,E) as it was ineffective to tumors bearing G12C mutation, leading to progression(Figure 4D). Such specificity was confirmed by immunofluorescence-based quantification of p-ERK1/2 and Ki-67 in G12D versus G12C tumors(D-E).Conclusion
In this first MRI study of the new KRAS inhibitor, our data support that multimetric MRI approach captured early cancer cell death and profound changes of tumor microenvironment upon engagement of MRTX1133 to its target. With further validation, we expect these translatable MRI metrics(ADC, Ktrans and MTR) to facilitate patient selection and management in the setting of KRAS(G12D) inhibitor therapy.Acknowledgements
U24-CA231858 (Penn Pancreatic Cancer Imaging Resource),
Mouse Hospital of the Abramson Cancer Center for providing mice bred, Small
Animal Imaging Facility (SAIF) of Radiology Department at University of
Pennsylvania
References
1. Bryant KL, Mancias JD, Kimmelman AC, Der CJ. KRAS: feeding pancreatic cancer proliferation. Trends Biochem Sci 2014;39:91-100 2. DuFort CC, DelGiorno KE, Carlson MA, Osgood RJ, Zhao C, Huang Z, et al. Interstitial Pressure in Pancreatic Ductal Adenocarcinoma Is Dominated by a Gel-Fluid Phase. Biophys J 2016;110:2106-19 3. DelGiorno Kathleen E, Carlson Markus A, Osgood R, Provenzano Paolo P, Brockenbough JS, Thompson Curtis B, et al. Response to Chauhan et al.: Interstitial Pressure and Vascular Collapse in Pancreas Cancer - Fluids and Solids, Measurement and Meaning. Cancer Cell 2014;26:16-7 4. Sahai E, Astsaturov I, Cukierman E, DeNardo DG, Egeblad M, Evans RM, et al. A framework for advancing our understanding of cancer-associated fibroblasts. Nat Rev Cancer 2020;20:174-86 5. Wang X, Allen S, Blake JF, Bowcut V, Briere DM, Calinisan A, et al. Identification of MRTX1133, a Noncovalent, Potent, and Selective KRASG12D Inhibitor. Journal of medicinal chemistry 2022;65:3123-33 6. Hallin J, Bowcut V, Calinisan A, Briere DM, Hargis L, Engstrom LD, et al. Anti-tumor efficacy of a potent and selective non-covalent KRASG12D inhibitor. Nature Medicine 2022;28:2171-82 7. Kemp SB, Cheng N, Markosyan N, Sor R, Kim IK, Hallin J, et al. Efficacy of a small molecule inhibitor of KrasG12D in immunocompetent models of pancreatic cancer. Cancer Discov 2023;13:298-311 8. Skoulidis F, Li BT, Dy GK, Price TJ, Falchook GS, Wolf J, et al. Sotorasib for Lung Cancers with KRAS p.G12C Mutation. New England Journal of Medicine 2021;384:2371-81 9. Cao J, Song HK, Yang H, Castillo V, Chen J, Clendenin C, et al. Respiratory Motion Mitigation and Repeatability of Two Diffusion-Weighted MRI Methods Applied to a Murine Model of Spontaneous Pancreatic Cancer. Tomography : a journal for imaging research 2021;7:66-79 10. Pickup S, Romanello M, Gupta M, Song HK, Zhou R. Dynamic Contrast-Enhanced MRI in the Abdomen of Mice with High Temporal and Spatial Resolution Using Stack-of-Stars Sampling and KWIC Reconstruction. Tomography : a journal for imaging research 2022;8:2113-28 11. Romanello Joaquim M, Furth EE, Fan Y, Song HK, Pickup S, Cao J, et al. DWI Metrics Differentiating Benign Intraductal Papillary Mucinous Neoplasms from Invasive Pancreatic Cancer: A Study in GEM Models. Cancers 2022;14:4017 12. Hingorani SR, Petricoin EF, Maitra A, Rajapakse V, King C, Jacobetz MA, et al. Preinvasive and invasive ductal pancreatic cancer and its early detection in the mouse. Cancer Cell 2003;4:437-50 13. Hingorani SR, Wang L, Multani AS, Combs C, Deramaudt TB, Hruban RH, et al. Trp53R172H and KrasG12D cooperate to promote chromosomal instability and widely metastatic pancreatic ductal adenocarcinoma in mice. Cancer Cell 2005;7:469-83 14. Clark CE, Beatty GL, Vonderheide RH. Immunosurveillance of pancreatic adenocarcinoma: insights from genetically engineered mouse models of cancer. Cancer letters 2009;279:1-7 15. Cao J, Pickup S, Clendenin C, Blouw B, Choi H, Kang D, et al. Dynamic Contrast-enhanced MRI Detects Responses to Stroma-directed Therapy in Mouse Models of Pancreatic Ductal Adenocarcinoma. Clin Cancer Res 2019;25:2314-22 16. Hingorani SR, Harris WP, Beck JT, Berdov BA, Wagner SA, Pshevlotsky EM, et al. Phase Ib Study of PEGylated Recombinant Human Hyaluronidase and Gemcitabine in Patients with Advanced Pancreatic Cancer. Clin Cancer Res 2016;22:2848-54Figures