4540
Comparison of breast cancer subtypes in treatment response using Dynamic Contrast-Enhanced MRI1Radiology, Weill Cornell Medical, New York City, NY, United States, 2Citigroup Biomedical Imaging Center, Weill Cornell Medical, New York City, NY, United States
Synopsis
Keywords: Biology, Models, Methods, Breast, Vascular, Image Reconstruction, Cancer
Motivation: Breast cancer molecular subtype may affect therapeutic efficacy of metronomic chemotherapy, which currently has not been investigated with non-invasive methods.
Goal(s): This study is to utilize DCE-MRI for quantitative measurement of treatment response in different breast cancer subtypes.
Approach: Preclinical orthotopic models 67NR(ER+) and 4T1(triple negative) of breast cancer were treated with the same metronomic chemotherapy, while the heterogenous treatment response was evaluated using DCE-MRI.
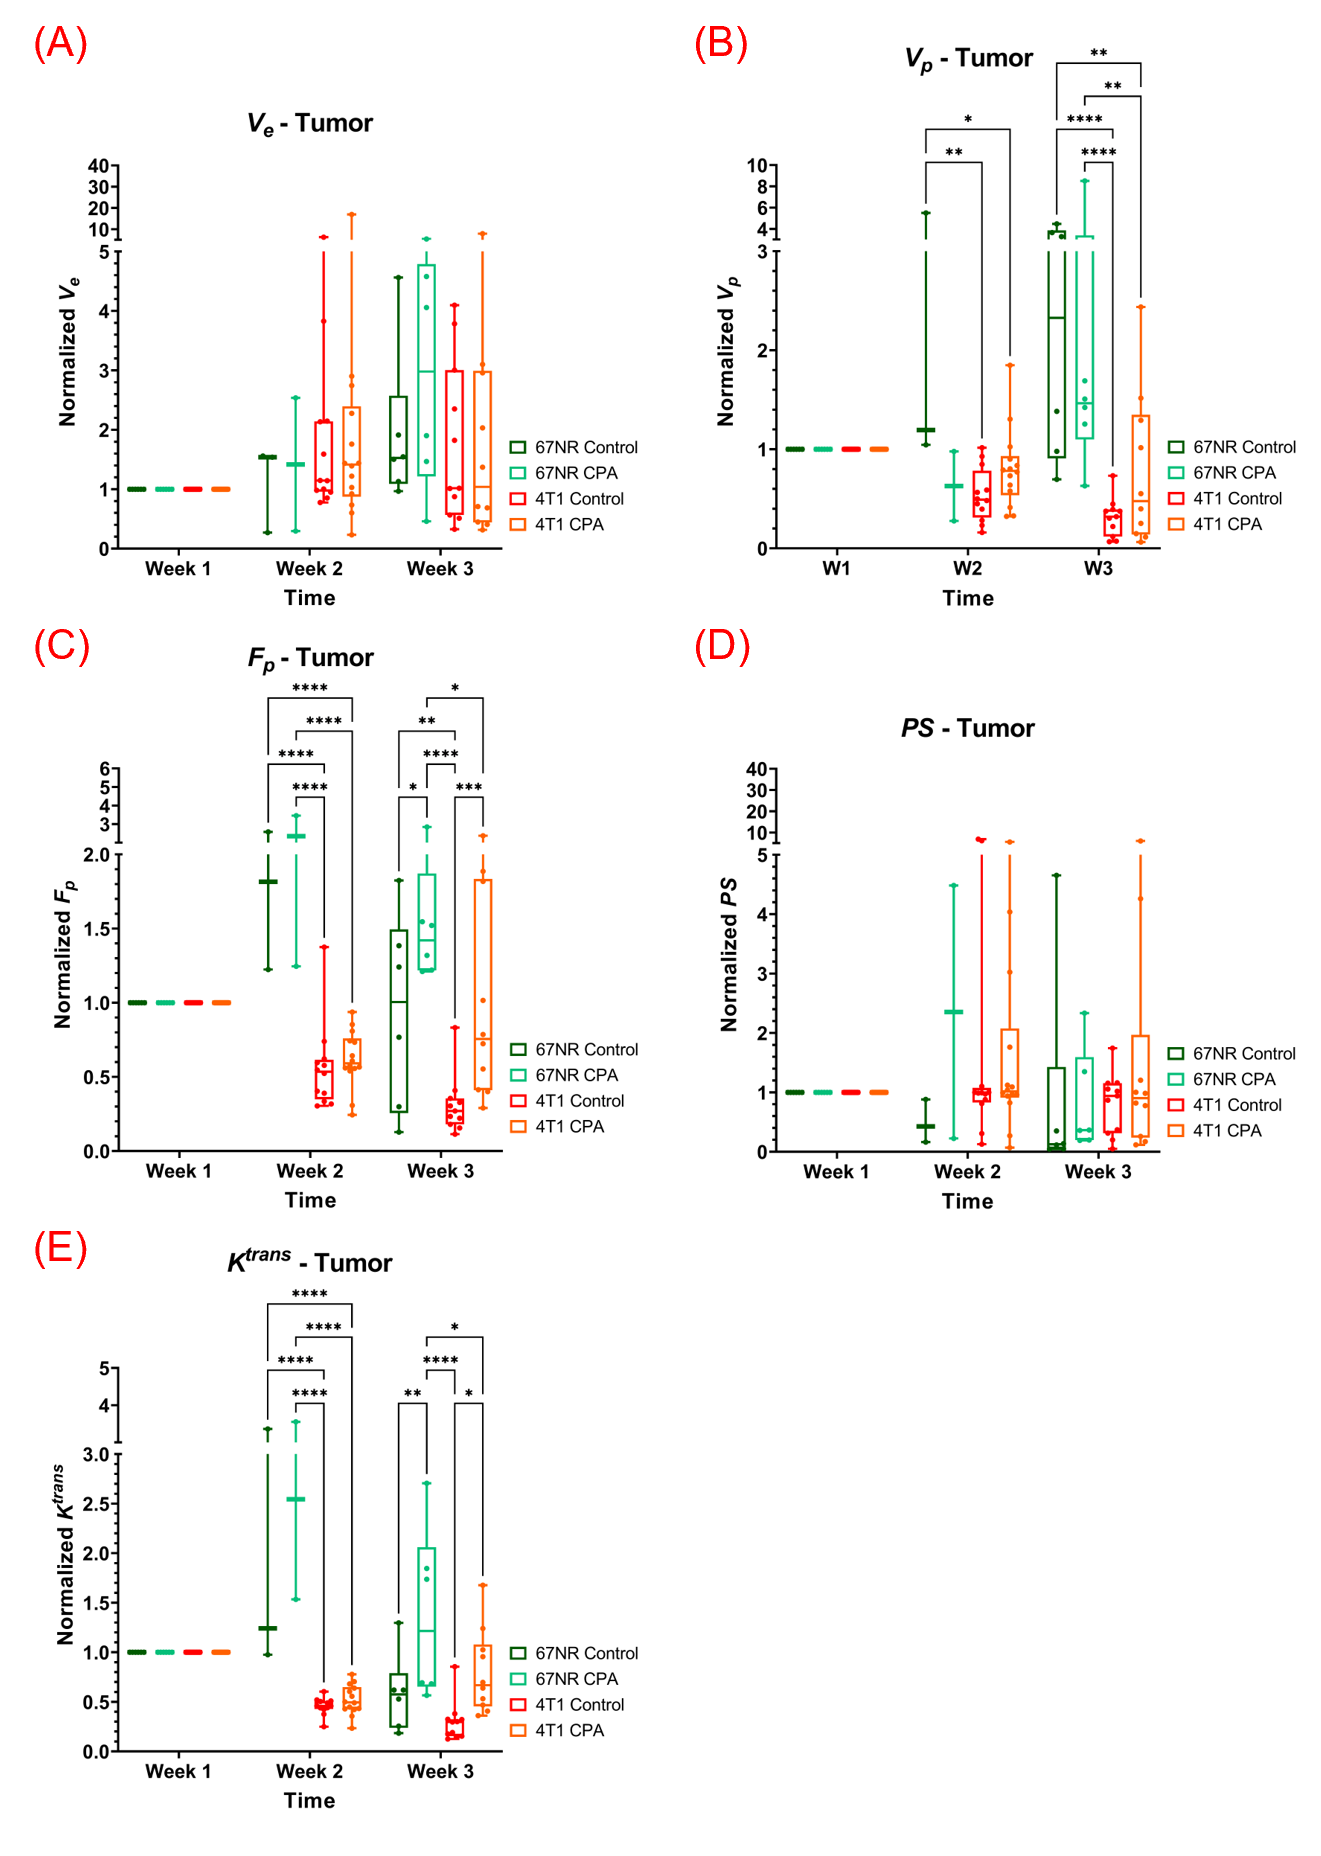
Results: In both tumor models, treatment induced higher Vp, Fp, and Ktrans. The 67NR tumors had higher vascular measures with slower growth rates than the 4T1 tumors.
Impact: The preliminary data in this study suggest that the tumor volume alone does not provide adequate information about the changes induced by treatment, and the treatment response differs substantially between breast cancer subtypes as observed by DCE-MRI parameters.
Introduction
Metronomic chemotherapy may induce different therapeutic effects depending on the molecular subtype of breast cancer1-5. However, it has not been investigated with non-invasive imaging methods. The aim of this study is to quantitively assess these differences using DCE-MRI.Methods
This study was conducted with 4T1 and 67NR murine models of triple negative breast cancer (TNBC) and ER-positive breast cancer, respectively. Both cell lines (10,000 cells in 20 μL of PBS) were injected into the 4th set, left side, of the mammary fat pad in BALB/cJ mice (n=46). On post-injection day 8, a baseline scan was conducted (Week1). Two additional scans were done at Week2 and Week3. The last scan was followed by tumor harvest for histology. For the control groups, the 4T1 (n=16) and 67NR (n=6) had received saline IP 3 times a week. For the treated group, each animal in the 4T1 (n=18) and 67NR (n=6) received IP injections of cyclophosphamide (CPA; 70mg/kg, 3 times a week). Treatment started immediately after Week1 MRI scans. For the histological analysis, the tumor tissue was formalin fixed paraffin embedded (FFPE) for H&E staining.All MRI scans were conducted on a 7T preclinical MRI system (Bruker) using a 4-channel phased array receive-only surface coil with a custom-made 3D printed holder. The DCE-MRI scan was conducted with a 3D UTE pulse sequence (TR=5ms and TE=0.028ms) with golden angle projections4 to minimize the T2* effect depending on Gd concentration and to achieve an isotropic spatial resolution. This DCE-MRI scan runs for 11 min 19s for a total of 48,500 projections and has multiple flip angles to estimate pre contrast T16-9. The temporal resolution used in the image reconstruction was 5s/frame and spatial resolution was 210 x 210 x 210 μm3 (isotropic). Sixty seconds into the acquisition, a bolus of gadobutrol (Gadavist; 0.1 mmol/kg) was delivered via a tail vein catheter.
A population-based AIF generated from a cohort of BALB/c mice was used for the pharmacokinetic analysis. A two-compartment exchange model was used to estimate pre-contrast T10, Ve (extravascular extracellular volume fraction), Vp (blood plasma volume fraction), PS (permeability surface area product), and Fp (blood flow). Ktrans (volume transfer constant) was calculated from the estimated PS and Fp.
Results
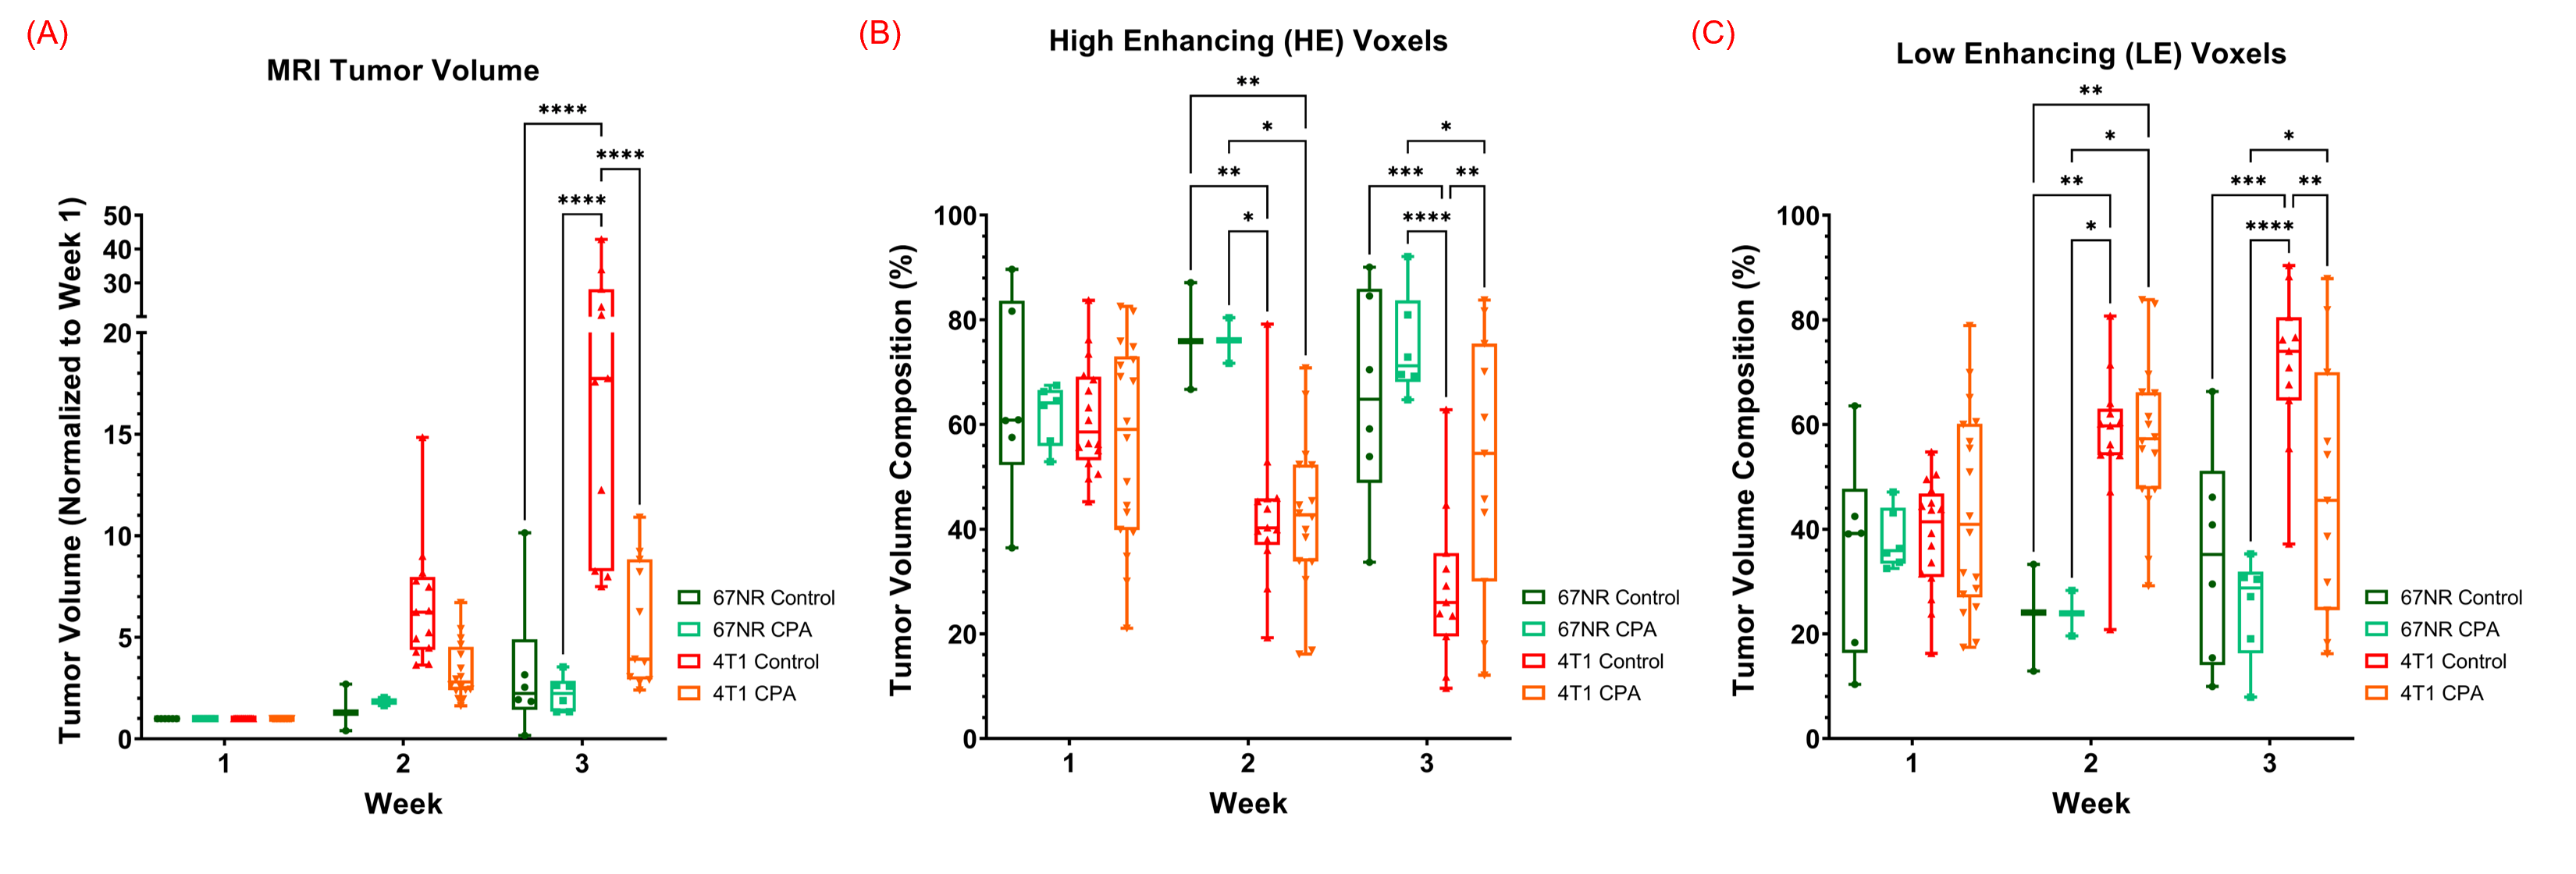
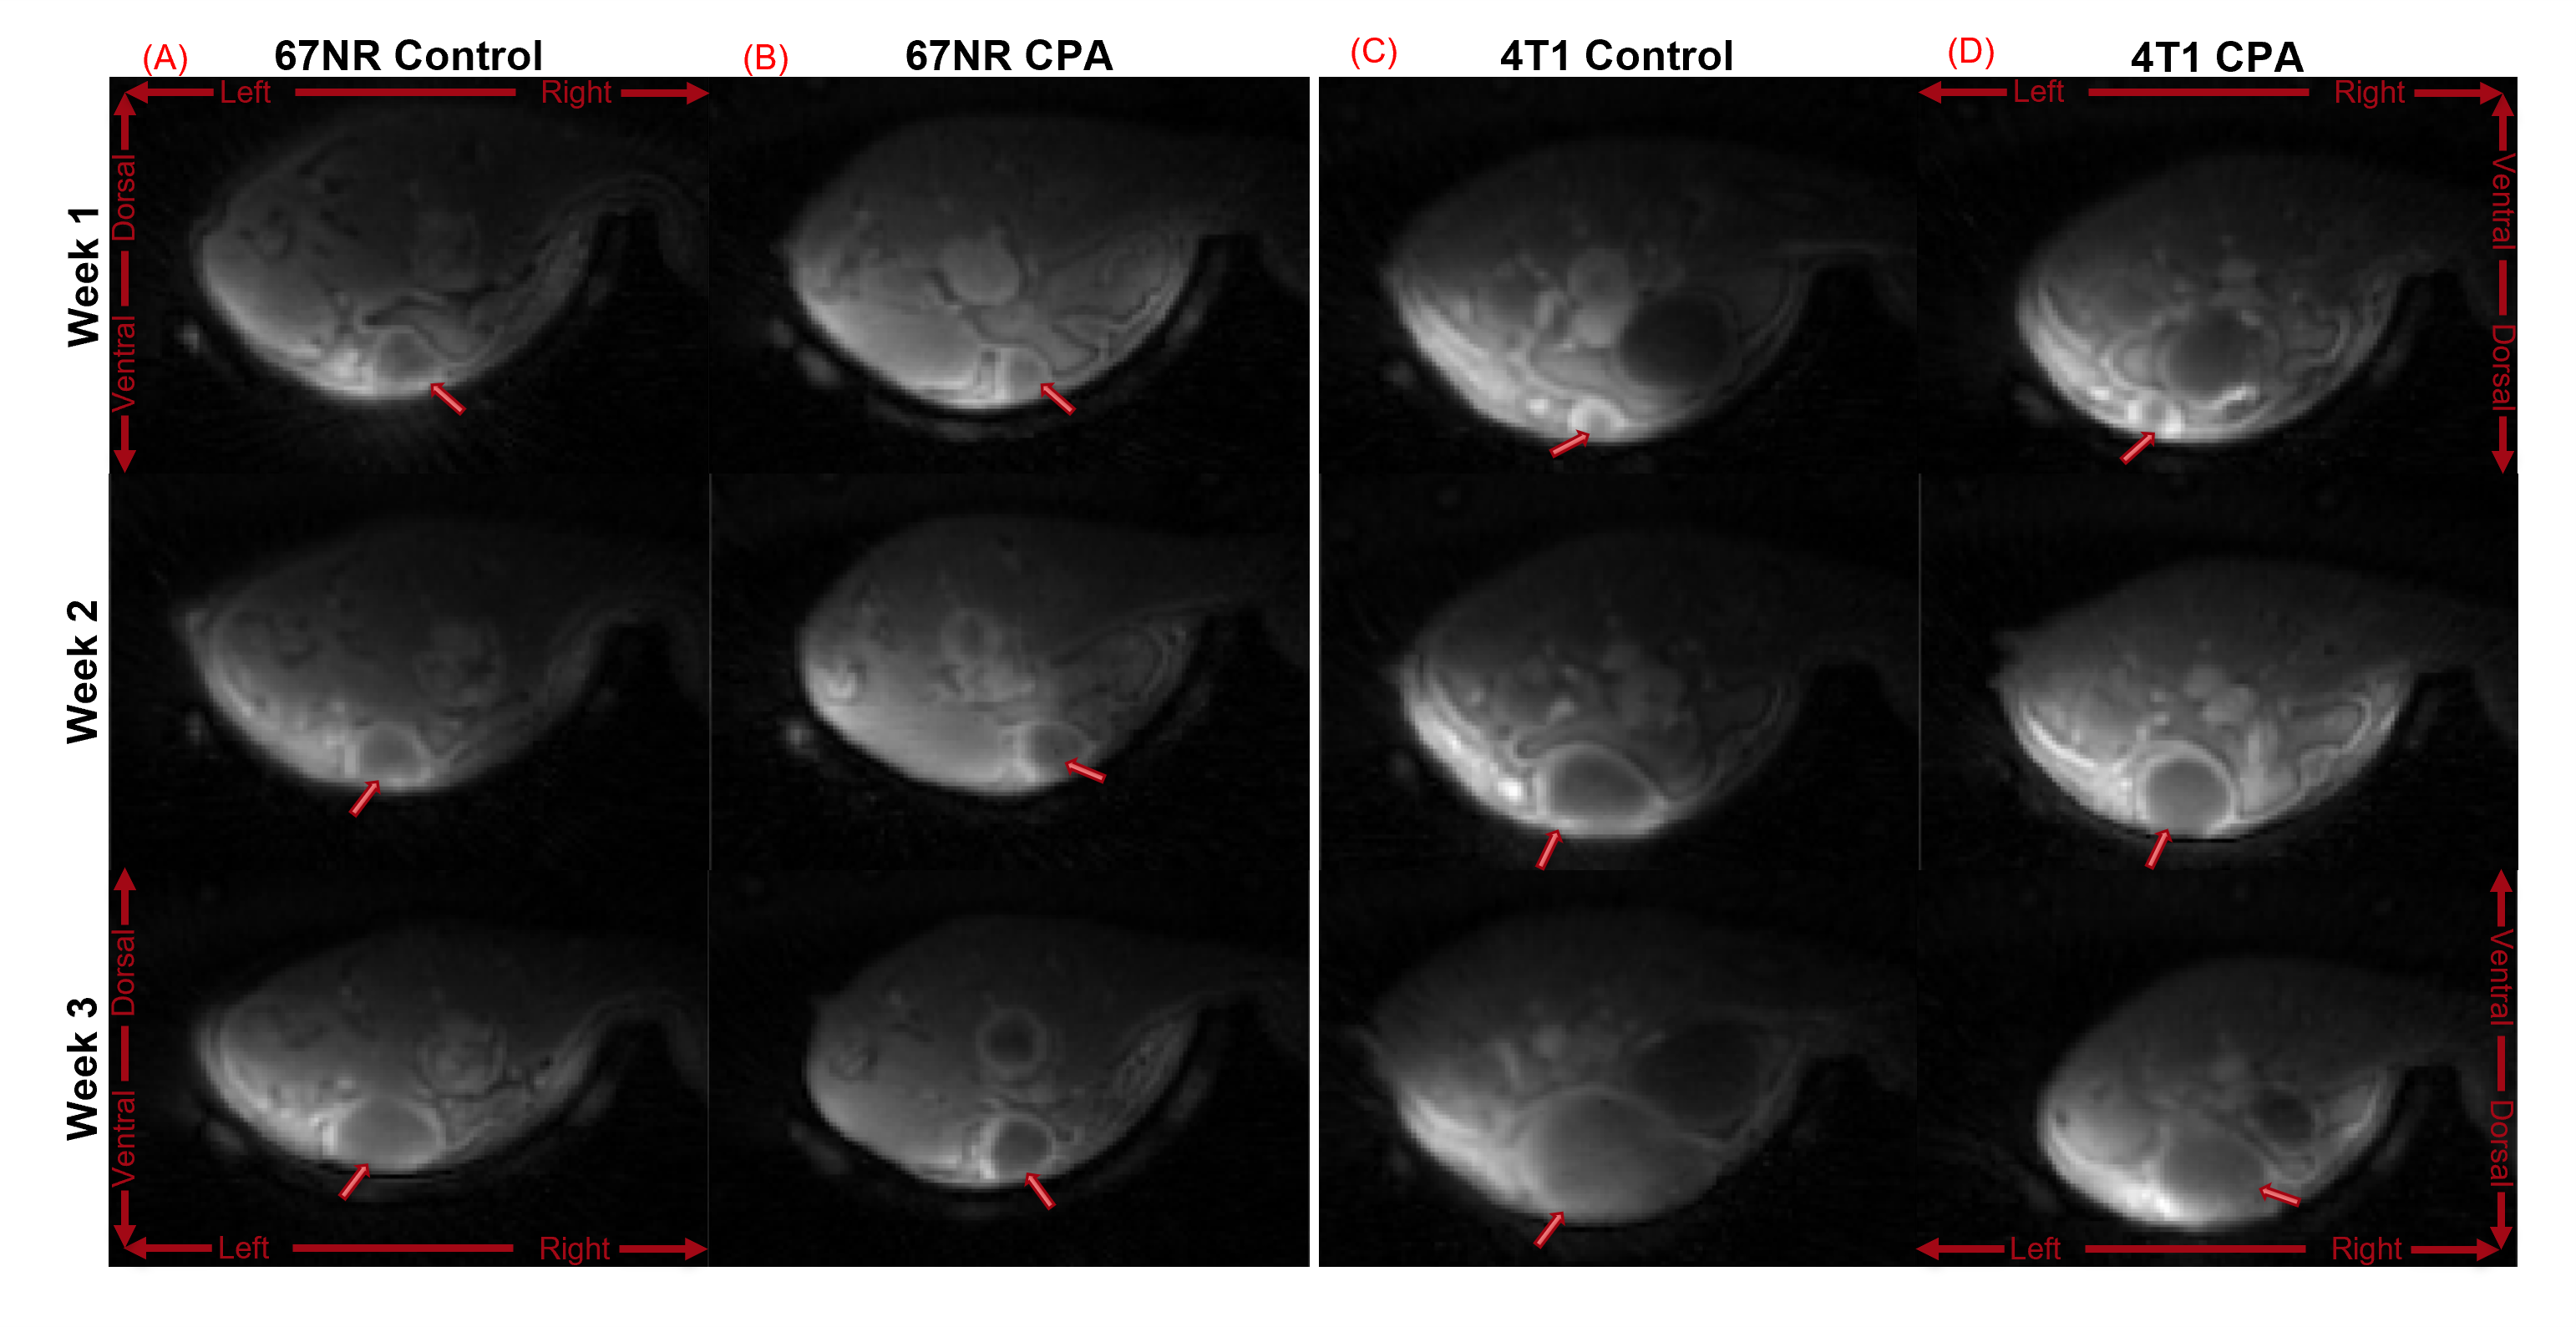
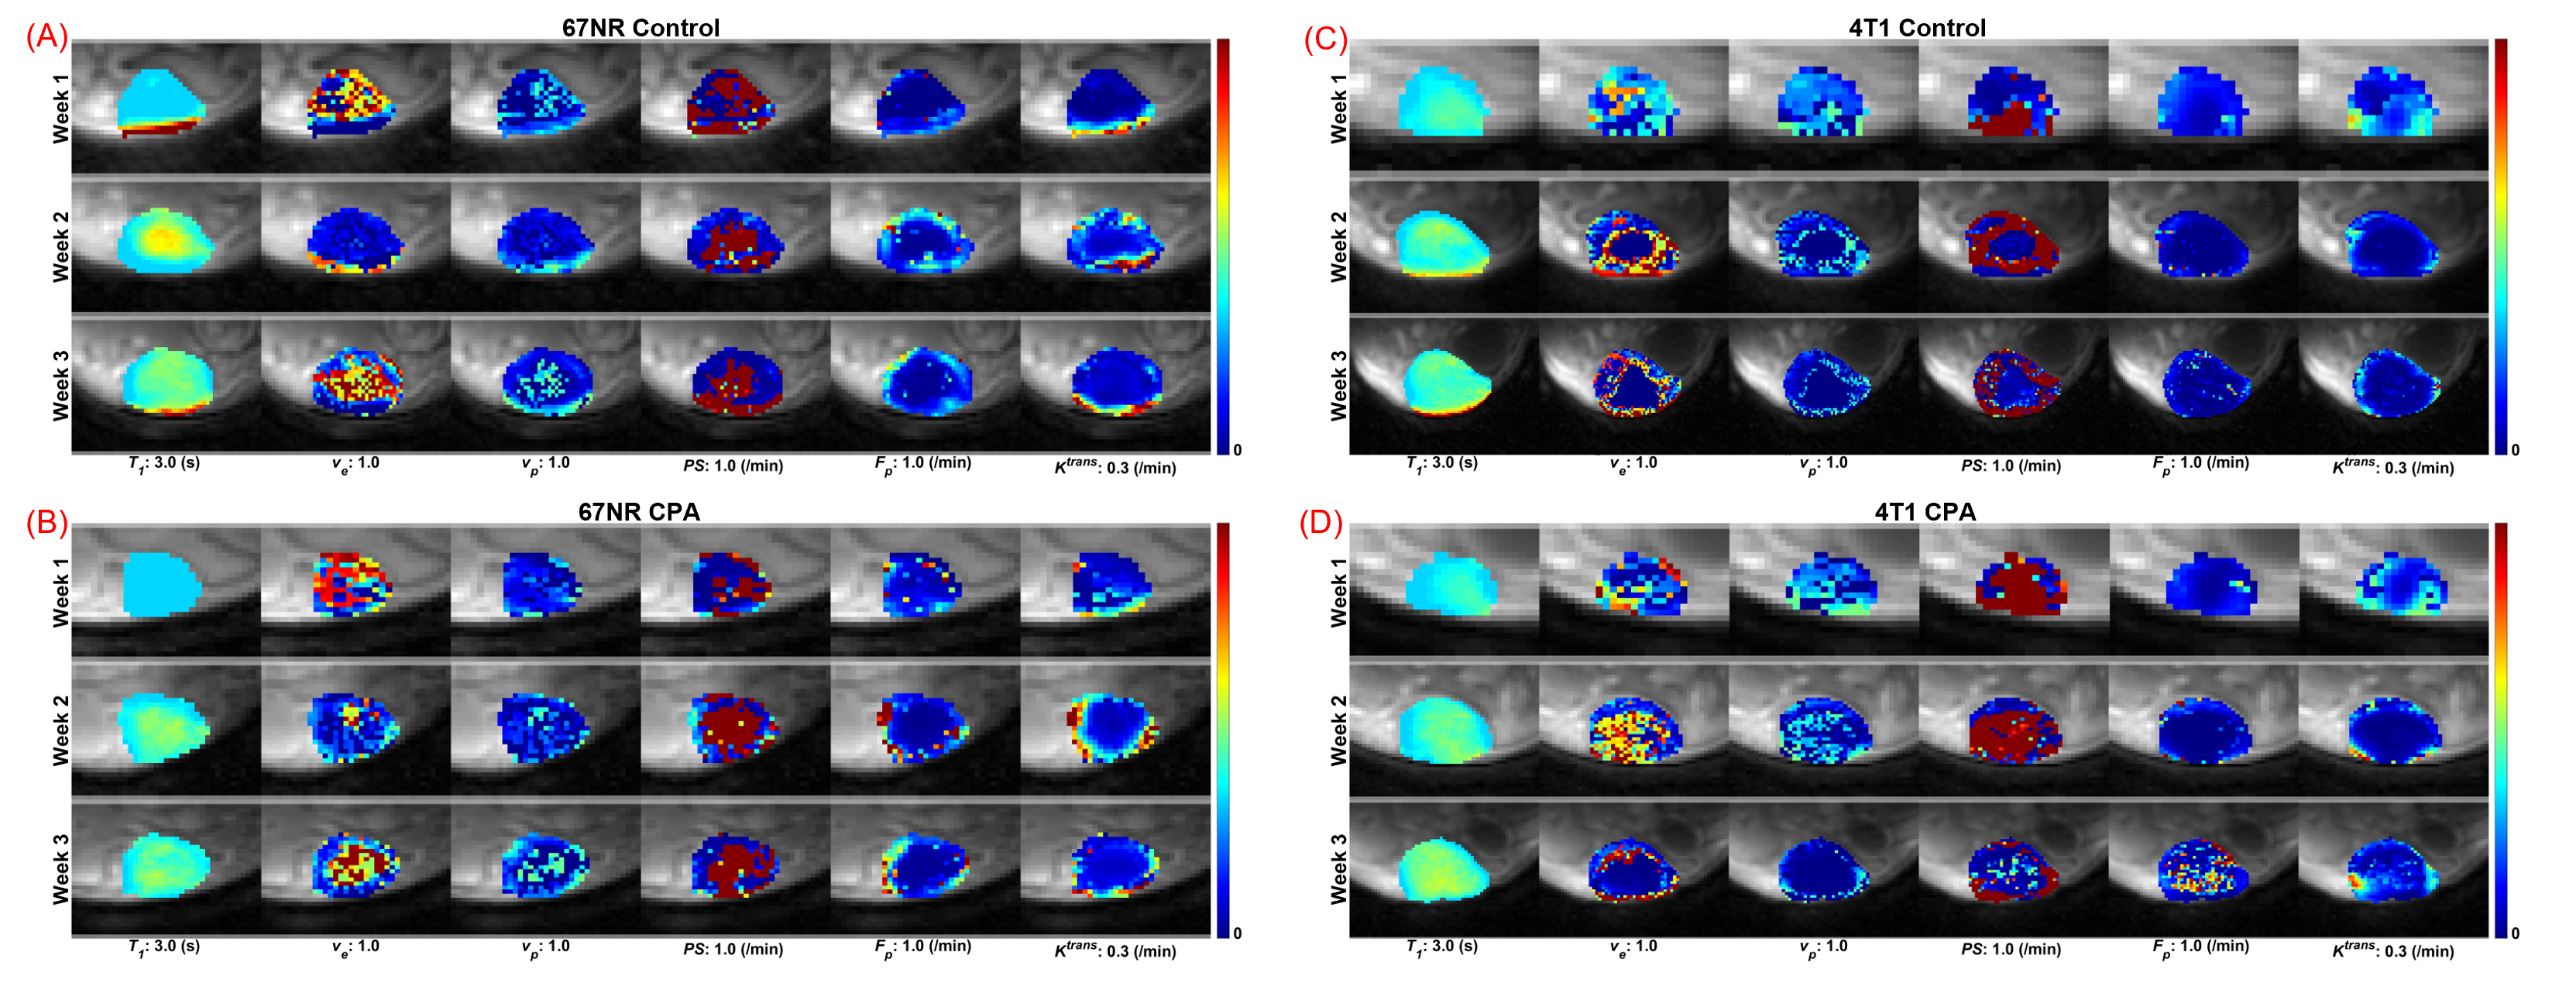
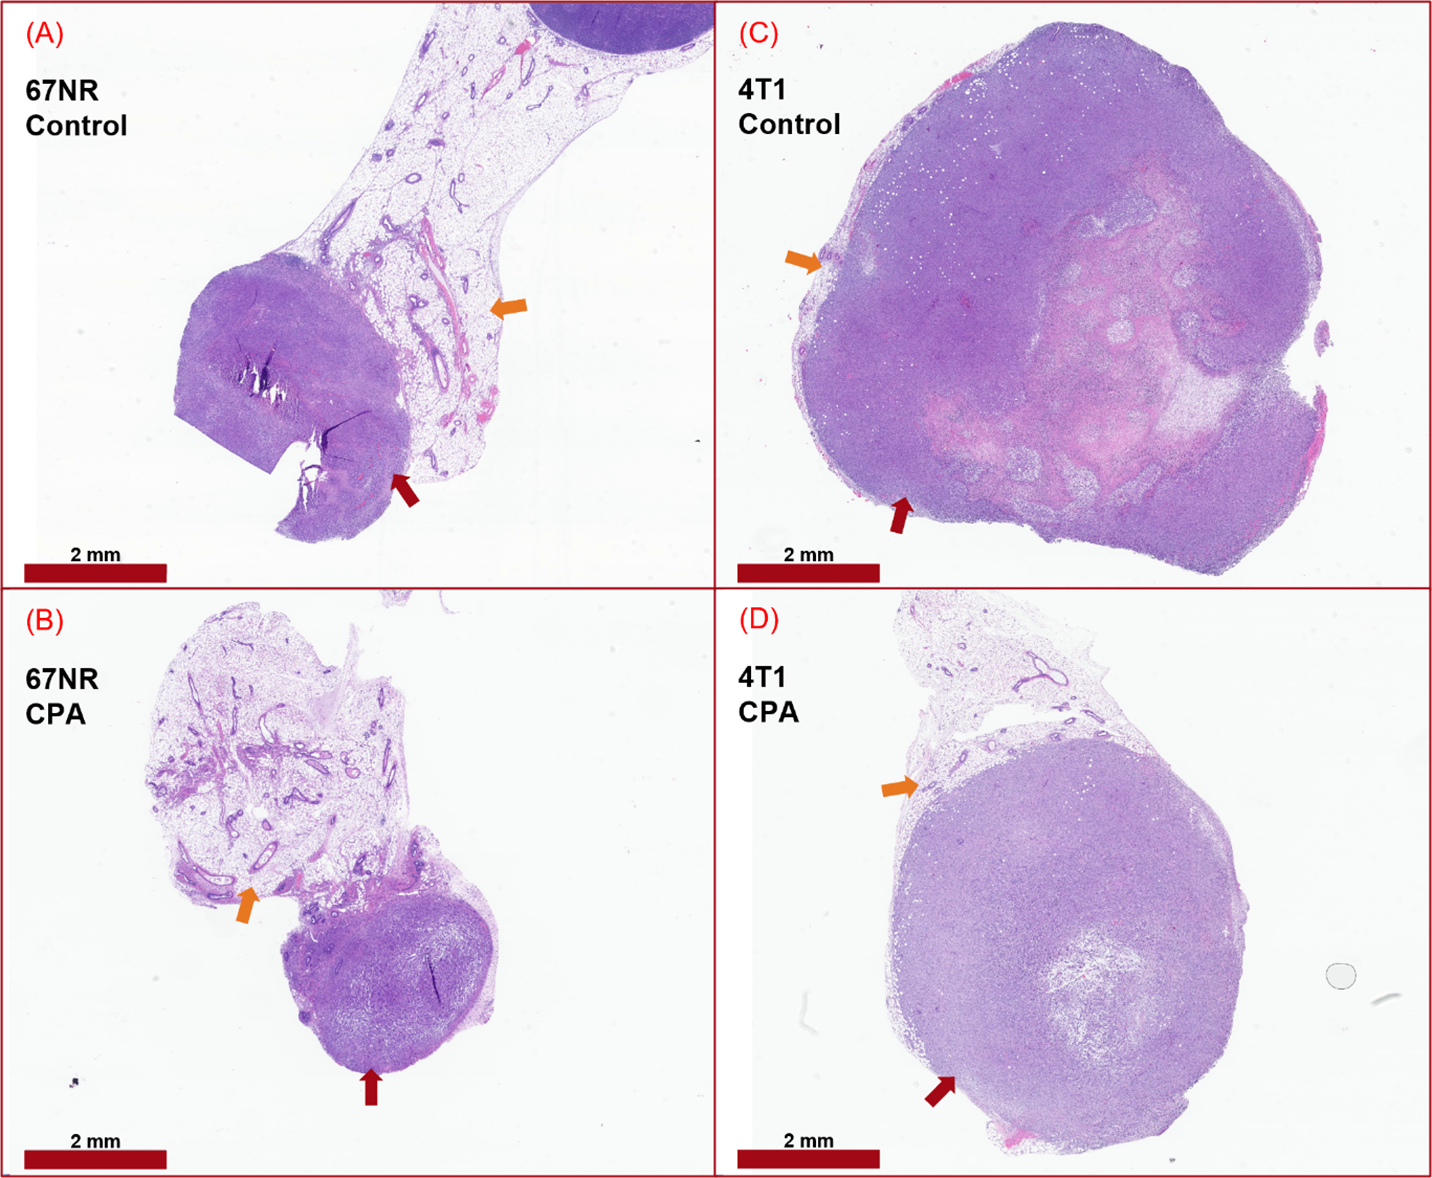
The 4T1 tumors grew substantially faster than the 67NR tumors (Fig.1A). The 4T1 tumors had about less than 50% of voxels with the initial area of enhancement > 0.4, while the 67NR tumors had more than 50% voxels with IAUC > 0.4 at Week-2 and 3 (Fig.1). Overall, both tumor models had enhancing voxels mostly in the tumor rim (Fig.2). The rim enhancement was associated with higher Vp, Fp, and Ktrans (Fig.3). Figure 4 summarizes how the pharmacokinetic model parameters change over the 2 weeks during the treatment. Both the 67NR and 4T1 groups had their CPA cohorts showing higher values of Fp and Ktrans than their controls. This difference between the treated and control groups was larger at Week3 than at Week2. The 67NR groups had higher Vp, Fp, and Ktrans than the 4T1 groups. Representative H&E whole tumors in Figure 5 show that the 4T1 tumors tend to have large necrotic/cystic regions in the core.Discussion
The preliminary results of this study demonstrate that the treatment response to the same metronomic chemotherapy differ remarkably between the two models of TNBC (4T1) and ER-positive (67NR) breast cancers. The cytotoxic effect of CPA is clearly observed in the fast-growing 4T1 tumors, whereas it is not as obvious in the substantially slow-growing 67NR tumors. This observation is in line with the expected effect of CPA as an alkylating agent that prevents cancer cells from dividing. In contrast, the metronomic administration of CPA induces higher vascular functionality in both tumors regardless of their growth rates. It is also interesting to note that such improvement was significant when the vascular function was reduced as in 4T1 as well as when increased as in 67NR. Future studies are warranted to monitor the 67NR tumors for a longer duration until the tumor size could be similar to those of the 4T1 tumors. Further histological studies will also be conducted to assess the vascularity (CD31), cell proliferation (Ki67) and others. Inclusion of additional breast cancer receptor subtypes may also provide more insight into the therapeutic efficacy of metronomic chemotherapy depending on tumor stage and subtype.Conclusion
This study demonstrates that quantitative DCE-MRI can be used to reveal the changes in the tumor microcirculation environment induced by metronomic chemotherapy, which can vary substantially in different breast cancer subtypes.Acknowledgements
NIH R01CA160620, R01CA219964, UH3CA228699.References
- Hoon SN, Lau PK, White AM, Bulsara MK, Banks PD, Redfern AD. Capecitabine for hormone receptor-positive versus hormone receptor-negative breast cancer. Cochrane Database Syst Rev. 2021 May 26;5(5):CD011220. doi: 10.1002/14651858.CD011220.pub2. PMID: 34037241; PMCID: PMC8150746.
- Munzone, E., Colleoni, M. Clinical overview of metronomic chemotherapy in breast cancer. Nat Rev Clin Oncol 12, 631–644 (2015). https://doi.org/10.1038/nrclinonc.2015.131.
- Wang X, Wang SS, Huang H, et al. Effect of Capecitabine Maintenance Therapy Using Lower Dosage and Higher Frequency vs Observation on Disease-Free Survival Among Patients With Early-Stage Triple-Negative Breast Cancer Who Had Received Standard Treatment: The SYSUCC-001 Randomized Clinical Trial [published correction appears in JAMA. 2022 May 17;327(19):1929]. JAMA. 2021;325(1):50-58. doi:10.1001/jama.2020.23370.
- Hoffmann E, Gerwing M, Krähling T, et al. Vascular response patterns to targeted therapies in murine breast cancer models with divergent degrees of malignancy. Breast Cancer Res. 2023;25(1):56. Published 2023 May 23. doi:10.1186/s13058-023-01658-9.
- Gerwing M, Hoffmann E, Kronenberg K, et al. Multiparametric MRI enables for differentiation of different degrees of malignancy in two murine models of breast cancer. Front Oncol. 2022;12:1000036. Published 2022 Nov 2. doi:10.3389/fonc.2022.1000036.
- Zhang J,, Kiser K, Kim S. Whole tumor pharmacokinetic model analysis with 3D isotropic high resolution using 3D-UTE-GRASP sequence at 7T. ISMRM 2020 abstract 0007.
- Zhang J, Winters K, Reynaud O, Kim SG. Simultaneous measurement of T1 /B1 and pharmacokinetic model parameters using active contrast encoding (ACE)-MRI. NMR Biomed. 2017;30(9):10.
- Zhang J, Kim SG. Estimation of cellular-interstitial water exchange in dynamic contrast enhanced MRI using two flip angles. NMR Biomed. 2019;32(11):e4135.
- Zhang J, Winters K, Kiser K, Baboli M, Kim SG. Assessment of tumor treatment response using active contrast encoding (ACE)-MRI: Comparison with conventional DCE-MRI. PLoS One. 2020;15(6):e0234520.
Figures