4539
Evaluating vascular normalization in orthotopic triple negative breast cancer with metronomic chemotherapy using 3D-UTE-GRASP DCE MRI1Radiology, Weill Cornell Medical, New York City, NY, United States, 2Citigroup Biomedical Imaging Center, Weill Cornell Medical, New York City, NY, United States
Synopsis
Keywords: Preclinical Image Analysis, Modelling, Breast, Cancer, Vascular, Image Reconstruction
Motivation: Metronomic chemotherapy shows promise as a cost-effective therapy for vascular normalization. However, it is unclear how to determine the optimal biological dose (OBD).
Goal(s): Our goal is to use dynamic contrast-enhanced (DCE) MRI and pharmacokinetic analysis for non-invasive measurements of the heterogenous tumor treatment response toward determining the OBD.
Approach: The 4T1 murine orthotopic triple negative breast cancer models were assessed longitudinally using two different dosing schemes, daily and intermittent, using cyclophosphamide. Pharmacokinetic and histological analysis (CD31, Ki67) were conducted.
Results: The intermittent dosing schedule showed higher Vp, Fp, and Ktrans in all tumor regions indicating possible vascular normalization.
Impact: The proposed 3D-UTE-GRASP DCE-MRI method provides a non-invasive platform to assess for optimal biological dose in metronomic chemotherapy. By accurately determining the heterogenous tumor vessel dynamical changes, this platform can be used to enhance treatment response over time.
Introduction
Determining the optimal biological dose (OBD) of metronomic chemotherapy remains challenging to do at the preclinical level and for individual patients1-3. The objective of our study is to assess the feasibility using quantitative DCE-MRI for determining the OBD.Methods
BALB/cJ mice, 6-8 weeks old, (n=44) with 4T1 TNBC model were utilized in this study. 10,000 cells in 20 μL PBS were injected into the left 4th set of the mammary fat pad. All animals were scanned three times; 8 days post tumor injection for baseline measurements (week1), week2, and week3. One cohort (n=16) was used as the control group (saline IP; 3 times a week). A second cohort (n=10) received cyclophosphamide daily at 30mg/kg IP (CPA30x7 cohort). A third cohort (n=18) received an intermittent dose of cyclophosphamide (70mg/kg IP) 3 times a week (CPA70x3 cohort). Treatment started immediately after week1 scan.MRI experiments were performed on a Bruker 7T micro-MRI system with a four-channel phased array receive-only MRI surface coil. DCE-MRI scan was performed using a custom-made 3D UTE pulse sequence with golden-angle projections4 (TR=5ms and TE=0.028ms) to achieve an isotropic spatial resolution and to minimize the T2* effect. It was continuously run to acquire 48,500 projections for 11 min 19 s. The multiple flip angles during the dynamic scan were used to estimate the pre-contrast T1 along with the pharmacokinetic parameters, i.e., active contrast encoding MRI6-7. Image reconstruction was conducted to have temporal resolution T= 5 s/frame and the spatial resolution of 0.210x0.210x0.210 mm3. A bolus of gadobutrol (Gadavist, Bayer) in saline at the dose of 0.1 mmol/kg was injected through a tail vein catheter, starting 60 seconds after the start of data acquisition. A population-based arterial input function (AIF) was obtained by averaging the individual AIFs obtained by selecting the median of the top 10 percent of enhancing voxels in a vessel ROI.
Pharmacokinetic model analysis was carried out with the two-compartment exchange model to simultaneously estimate pre-contrast T10, and four pharmacokinetic parameters: PS (permeability surface area product), Fp (blood flow), Ve (extracellular space volume fraction), and Vp (vascular space volume fraction). Ktrans (volume transfer constant) was calculated from the estimated PS and Fp. Tumor rim and core ROIs were determined based on the effective radius of a tumor estimated from the volume measured by the post-contrast 3D UTE image. The rim ROI was defined as an annulus with a thickness of 40% radius. After the third scan on week3, tumor tissues were collected for histological evaluation using H&E, Ki67 and CD31 staining.
Results
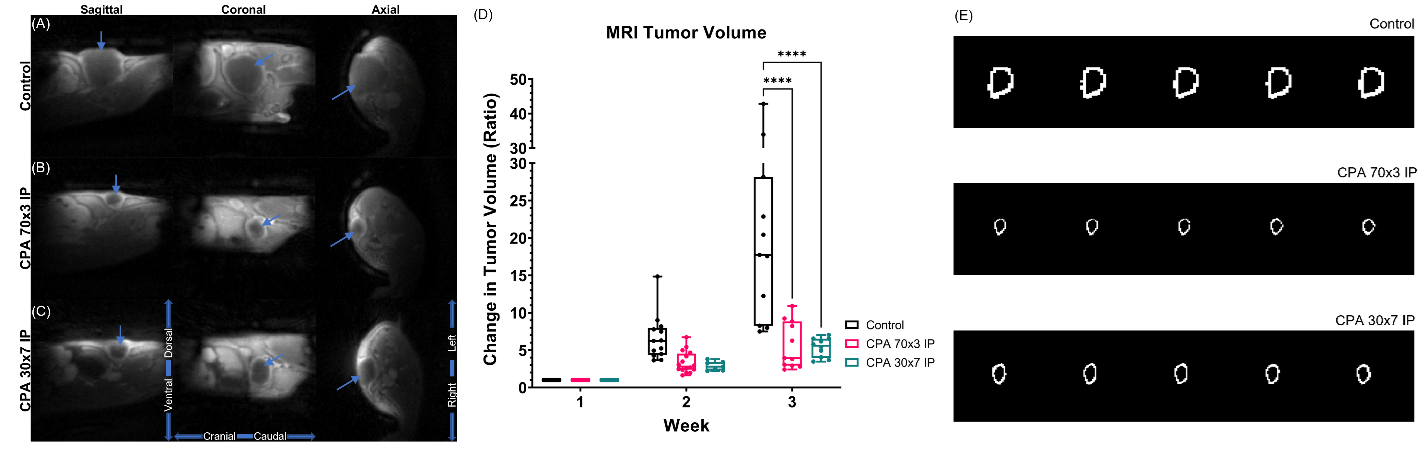
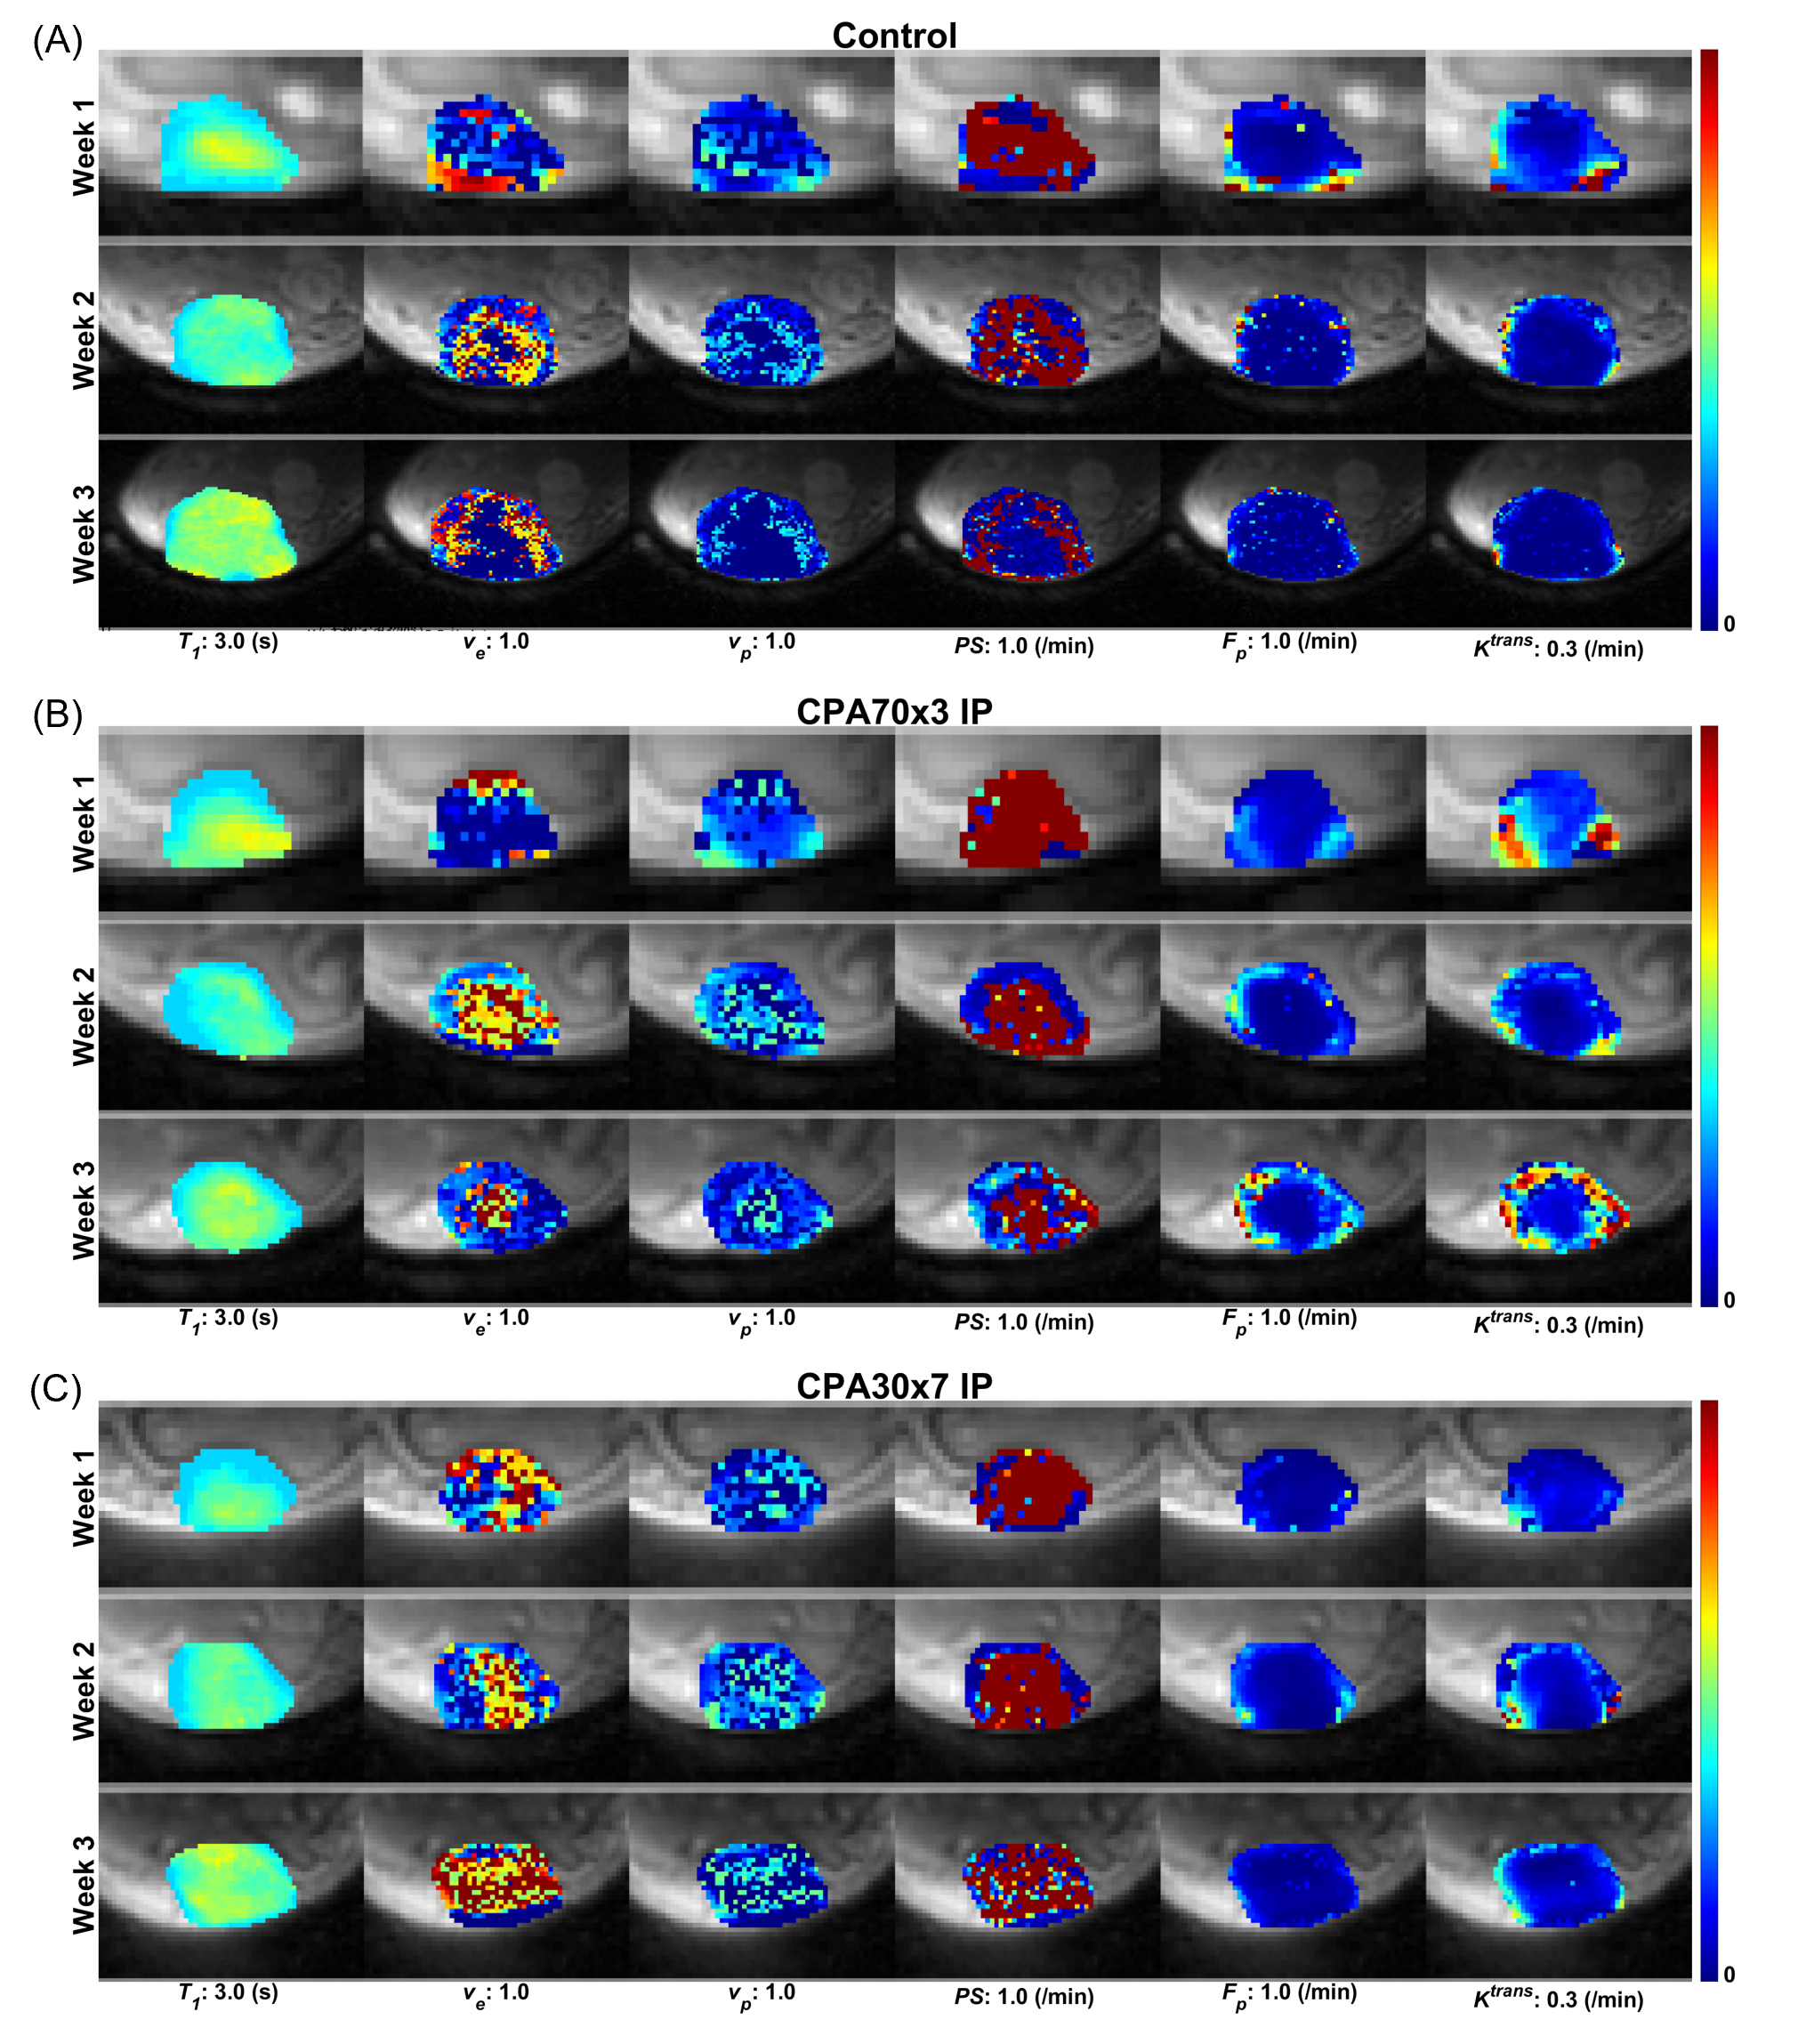
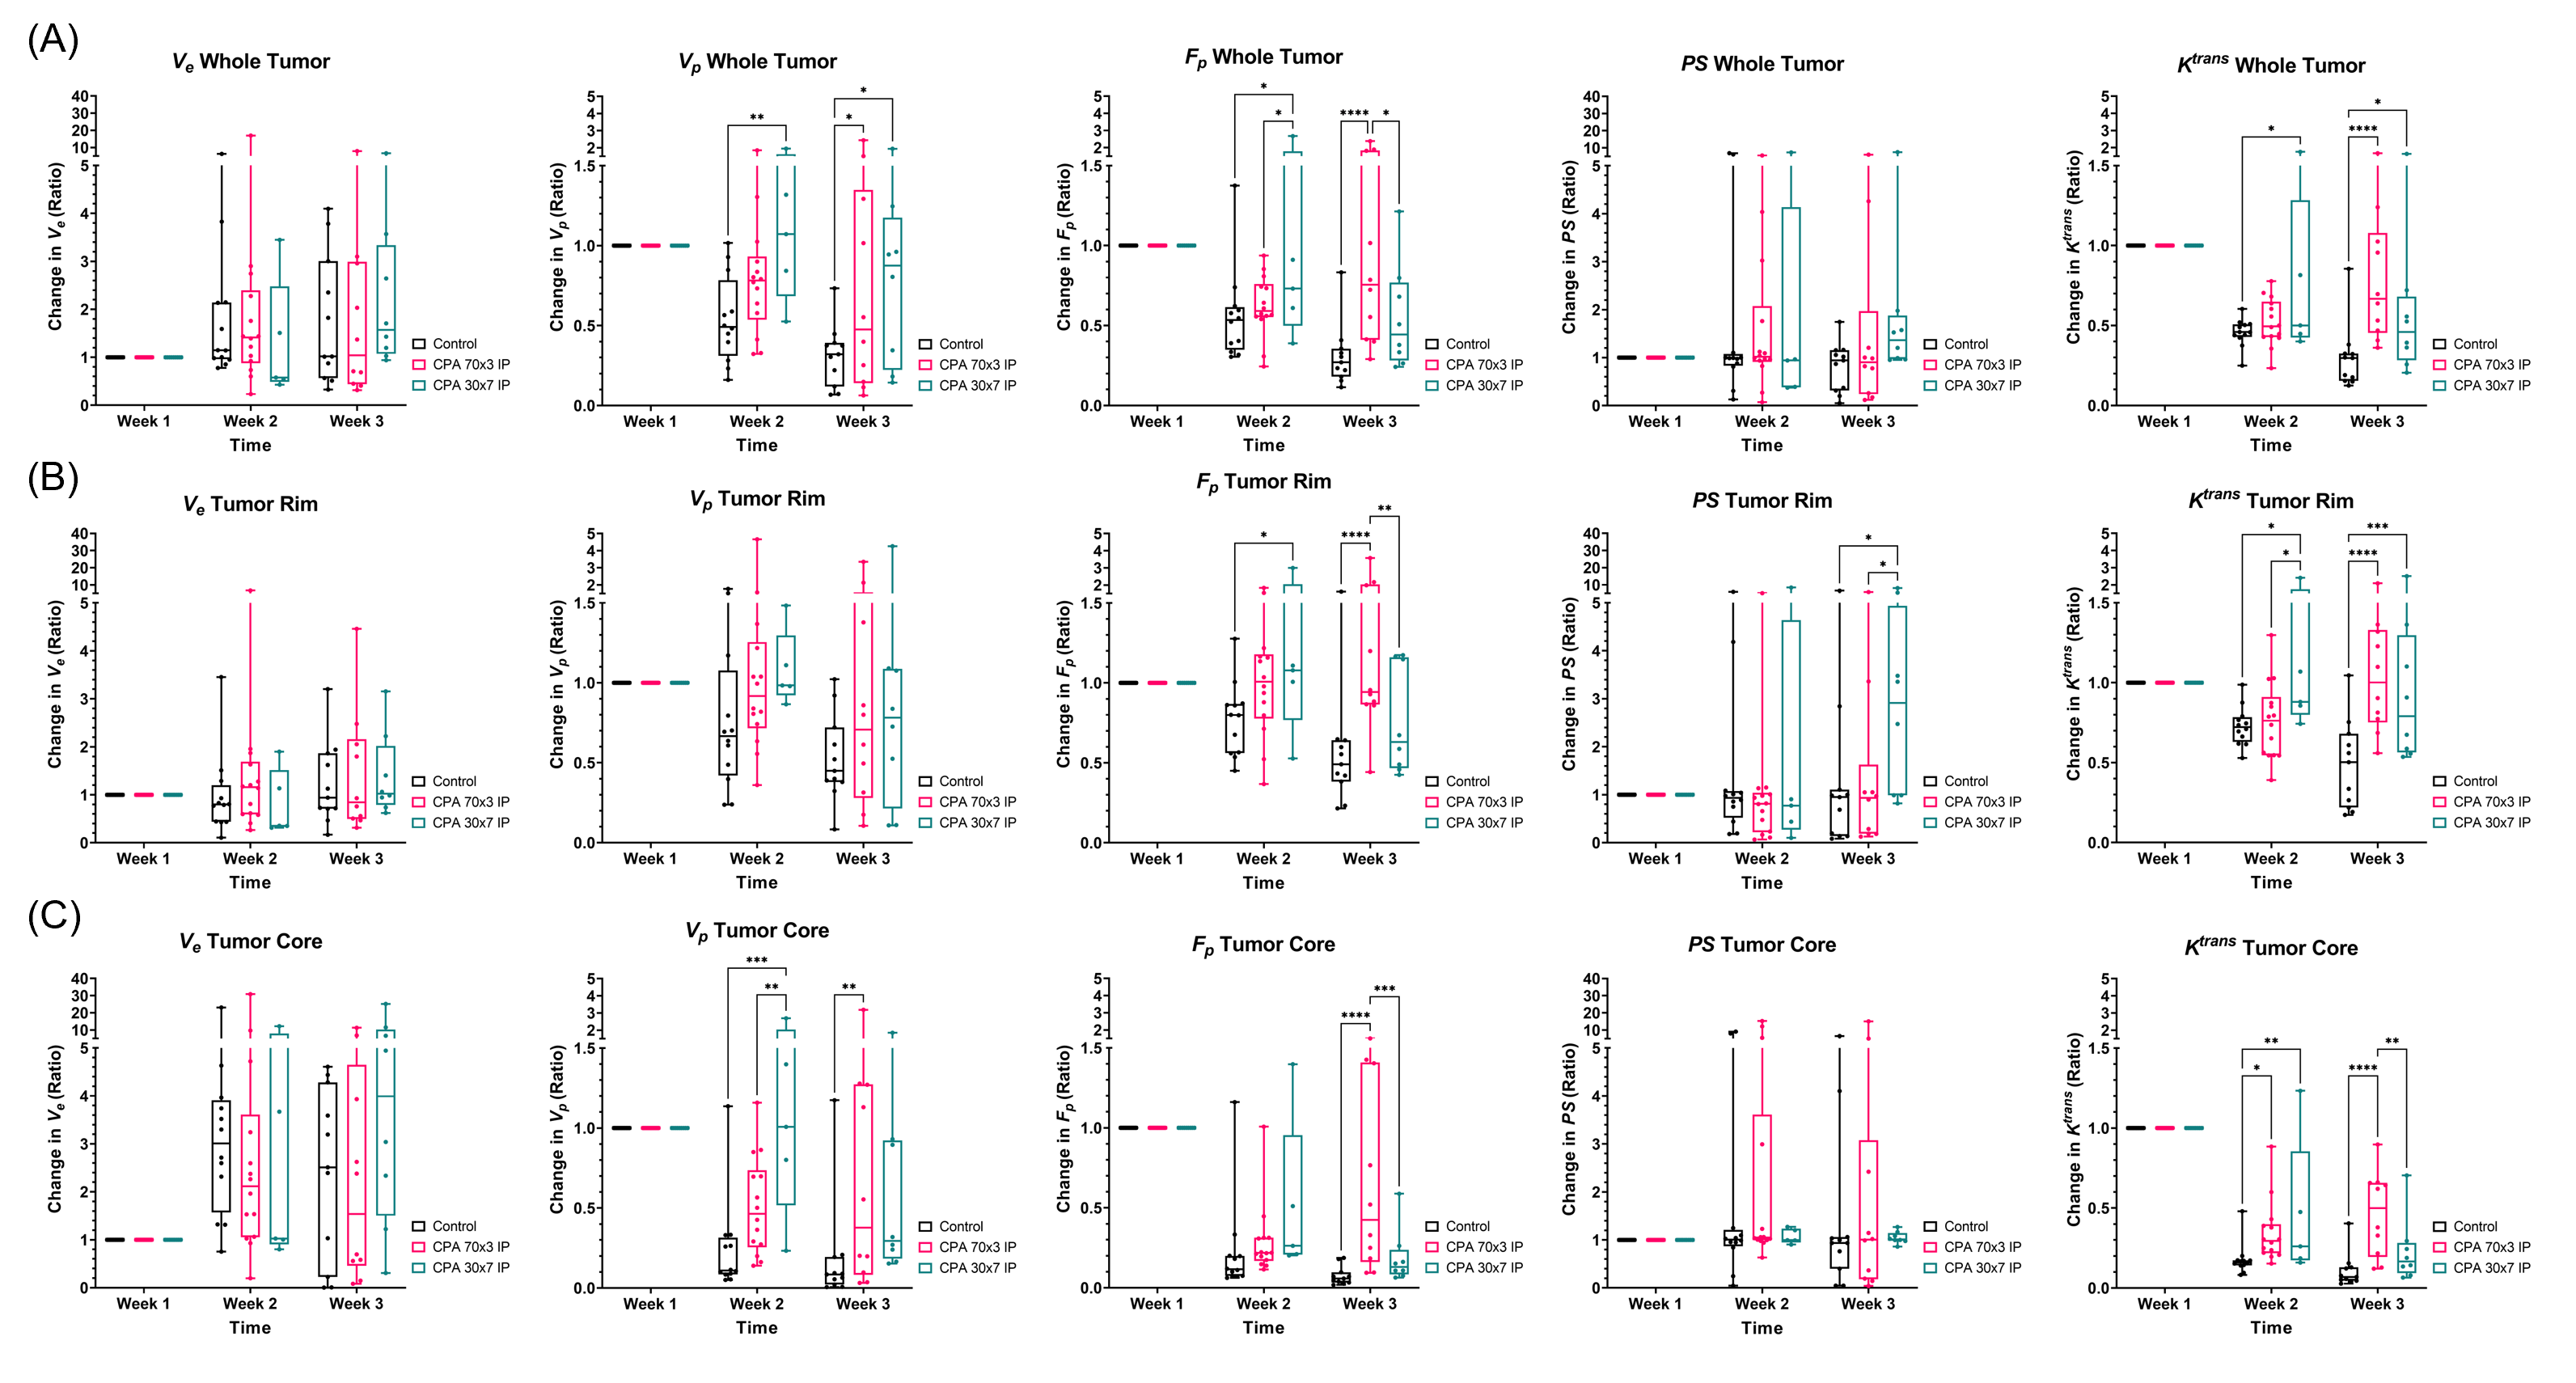
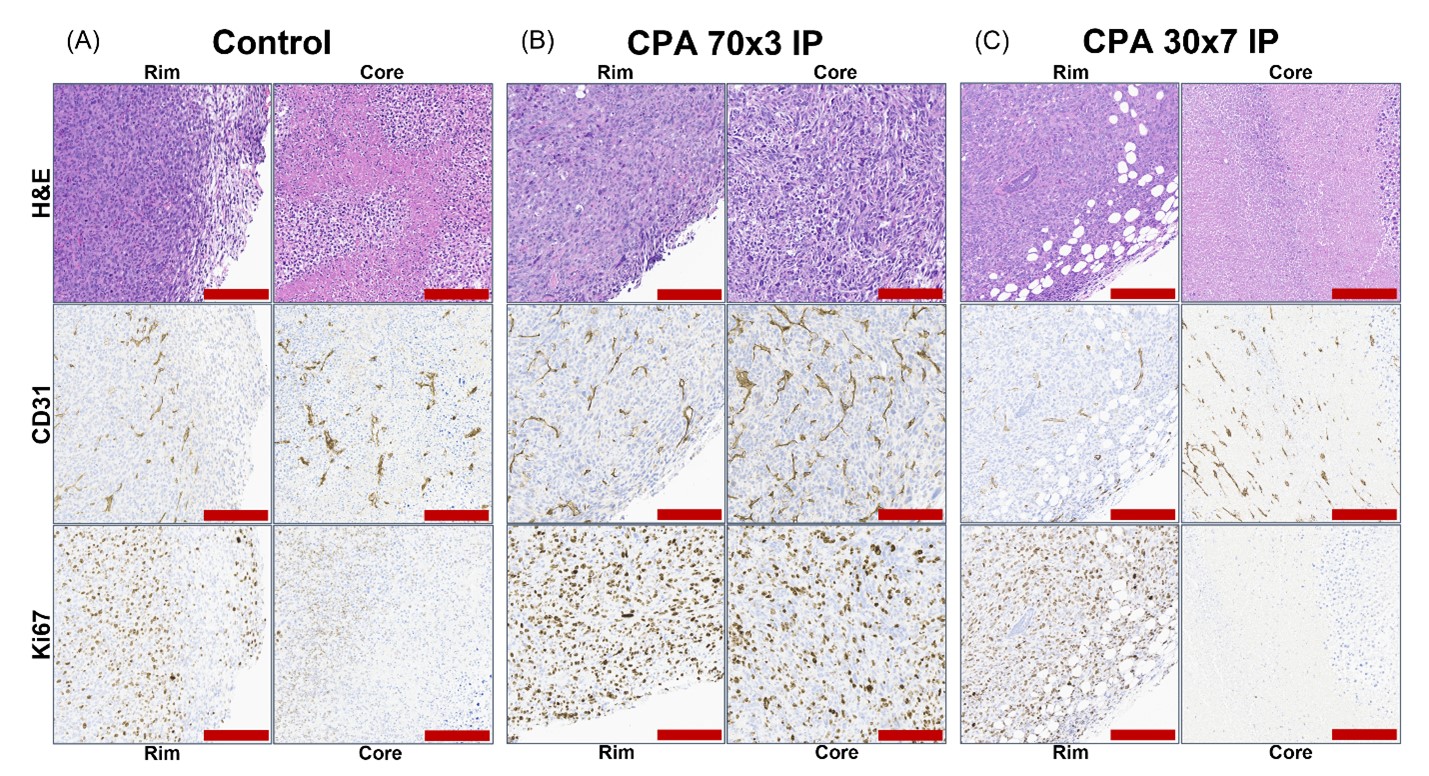
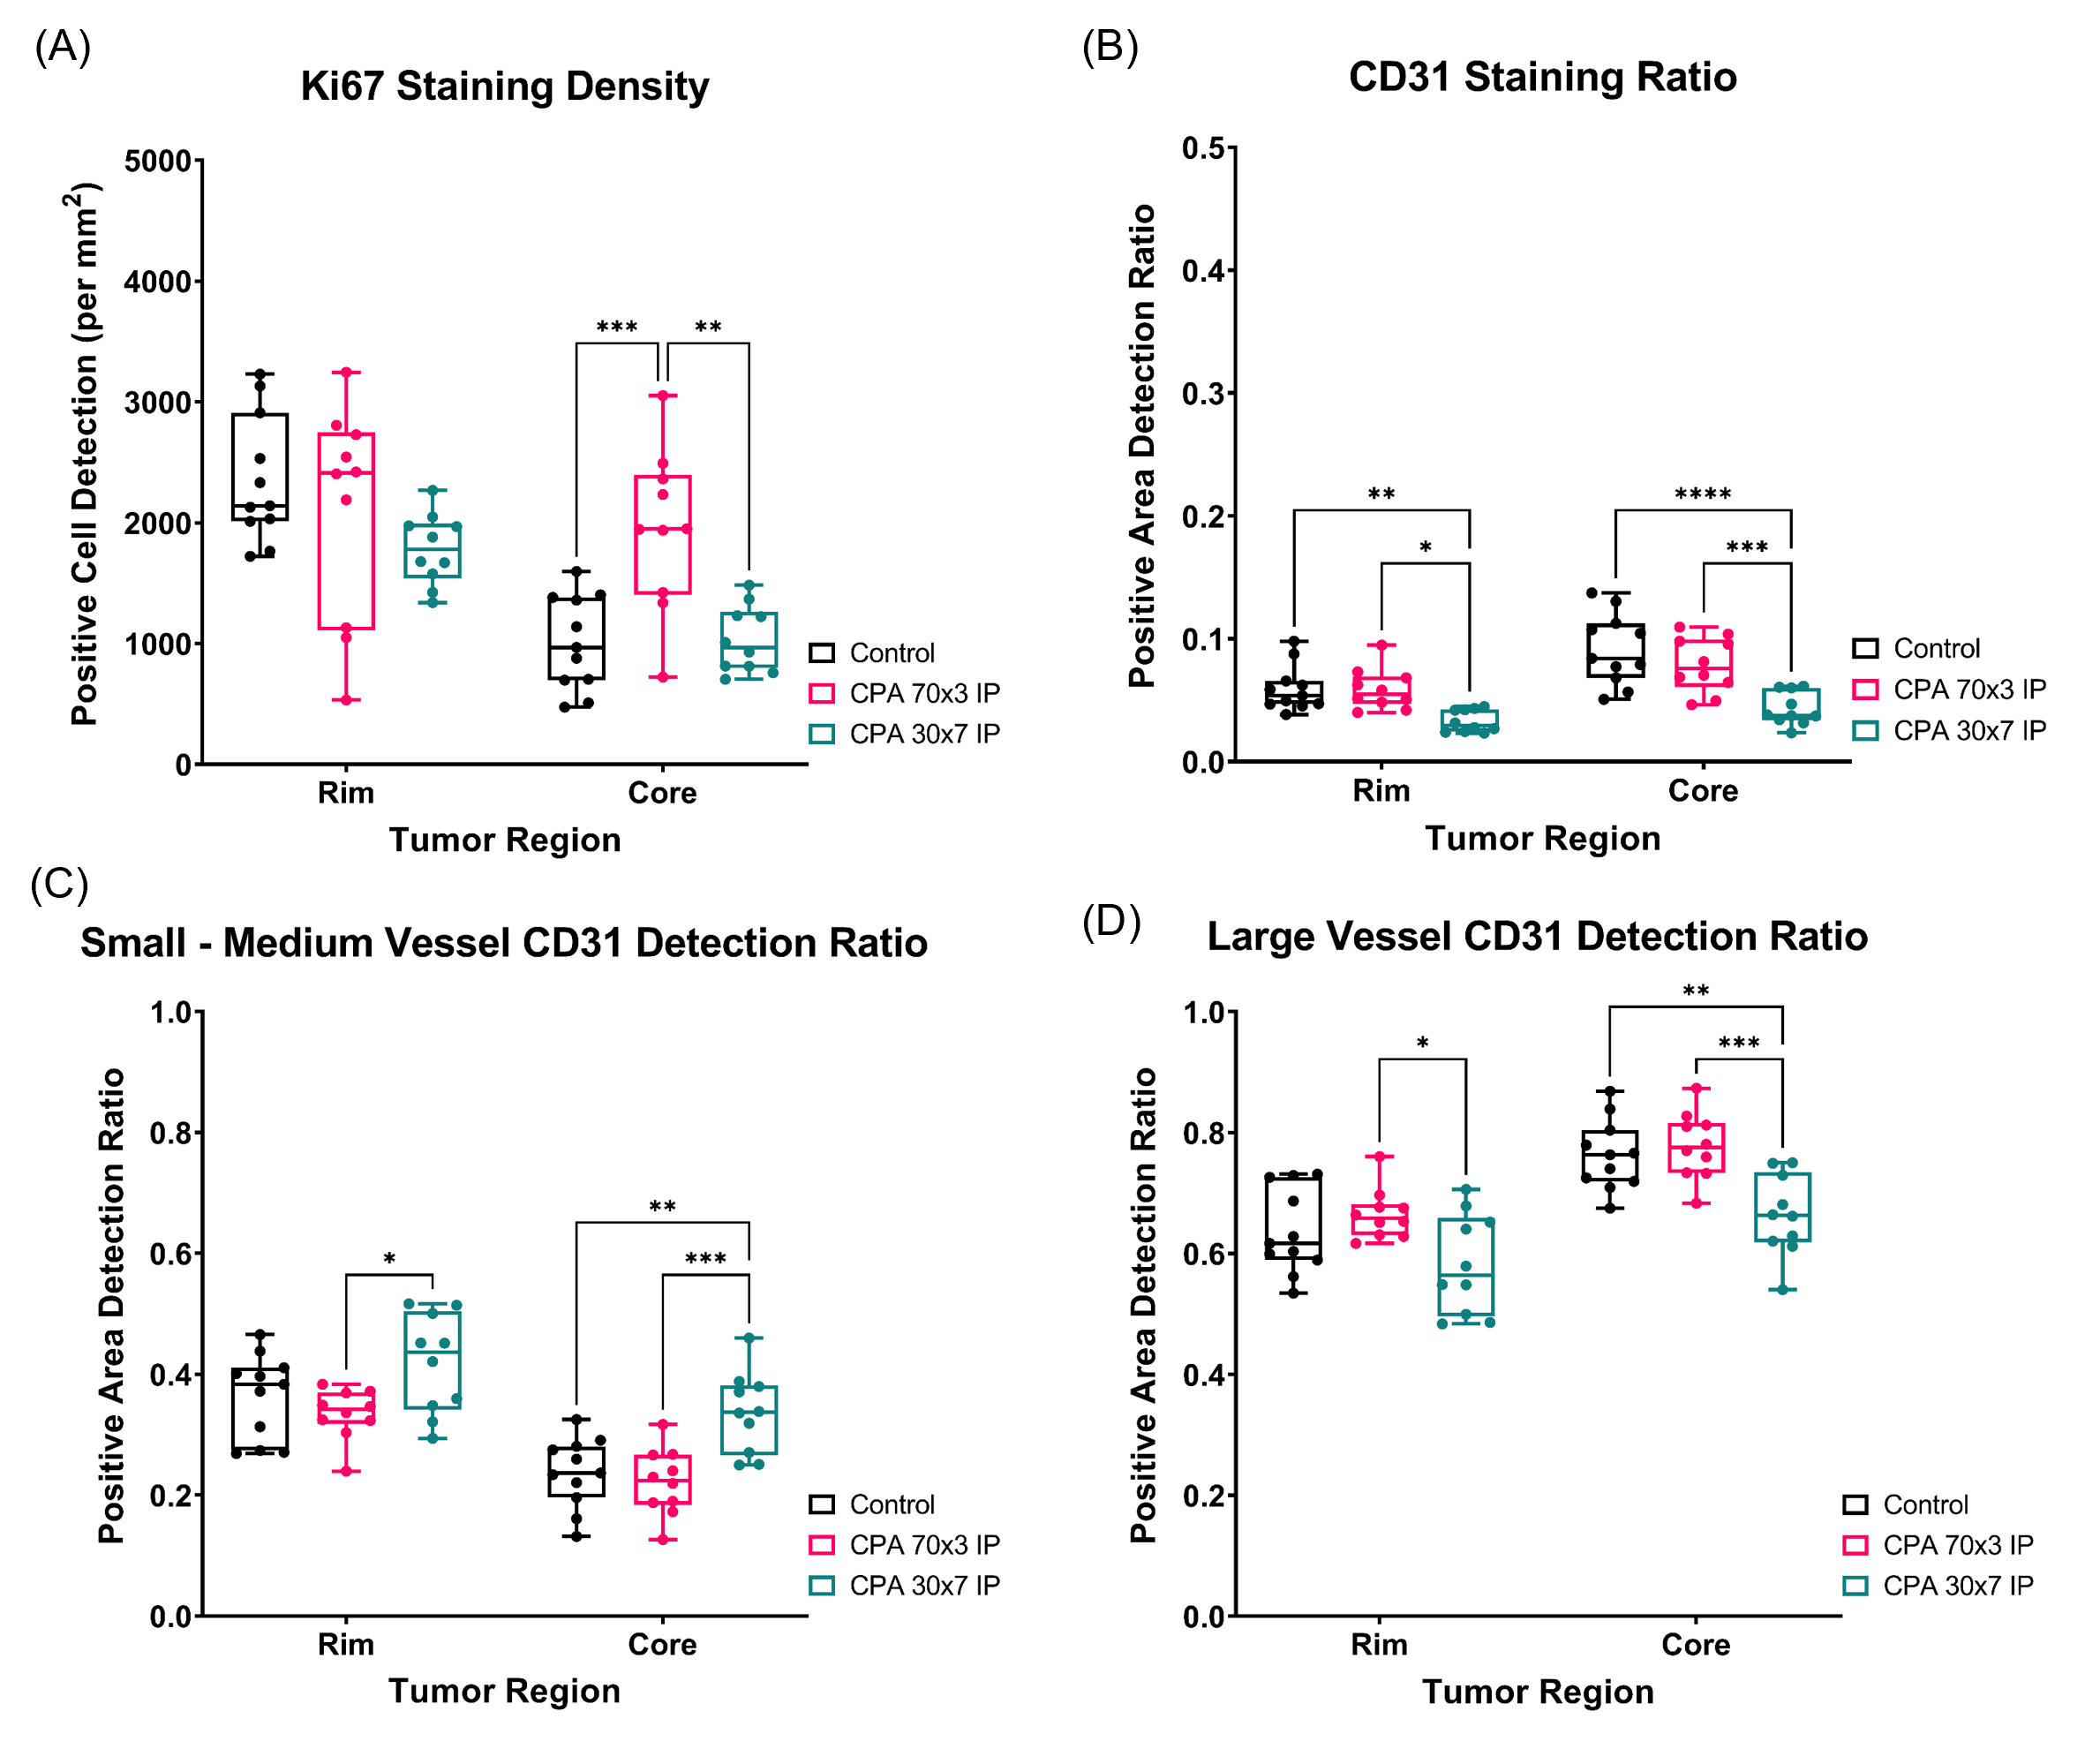
Representative images of tumors in the three groups at week-3 (Fig.1A-C) show that the tumors in the treated groups are substantially smaller than the control tumor. The tumor volumes measured by the 3D UTE images showed that both treatment methods reduced the tumor growth by about 75% (Fig.1D). Overall, the 4T1 tumors were found to be poorly enhancing as illustrated by the pharmacokinetic parameter maps in Figure 2. The parameter maps show that the CPA70x3 cohort example has higher Fp and Ktrans at week3 than other examples. This trend was also observed in all animals as shown by the box plots of the median parameter values in Figure 3. The CPA70x3 cohort had significantly higher Fp and Ktrans values than the control and CPA30x7 cohorts. Representative histological images of H&E, CD31, and Ki67 are shown in Figure 4, demonstrating higher CD31 and Ki67 expression levels in the CPA70x3 case than the others. This trend was also observed by a quantitative analysis of the histology images of Ki67 (Fig.5). CD31 staining density was lower in CPA30x7 than in control and CPA70x3 groups. In contrast, the CD31 staining density trend was revered when considering only the small vessels (< 300 μm2) observed in the slides.Discussion
These results indicate that the intermittent dosing schedule (CPA70x3) has more success in inducing an antiangiogenic-like response using only cyclophosphamide than the daily dosed schedule (CPA30x7). Vascular parameters, Vp, Fp, and Ktrans, were higher by endpoint for the intermittent schedule. However, some discrepancy between the MRI vascular parameters and CD31 staining may be because CD31 stains all vessels regardless of their functionality. The elevated Ki67 staining in the tumor core along with increased vascular parameters in the CPA70x3 cohort that achieved best tumor suppression may indicate tumor vascular normalization that provides improved drug delivery as well as nutrient for tumor.Conclusion
The results in this study suggest that quantitative DCE-MRI can be used to assess the efficacy of metronomic chemotherapy toward determining the optimal biological dose.Acknowledgements
NIH R01CA160620, R01CA219964, UH3CA228699.References
- Fraisse, J., Dinart, D., Tosi, D. et al. Optimal biological dose: a systematic review in cancer phase I clinical trials. BMC Cancer 21, 60 (2021). https://doi.org/10.1186/s12885-021-07782-z.
- Chen CS, Doloff JC, Waxman DJ. Intermittent metronomic drug schedule is essential for activating antitumor innate immunity and tumor xenograft regression. Neoplasia. 2014;16(1):84-96. doi:10.1593/neo.131910.
- Khan, K.A., Ponce de
Léon, J.L., Benguigui, M. et al. Immunostimulatory and
anti-tumor metronomic cyclophosphamide regimens assessed in primary orthotopic
and metastatic murine breast cancer. npj Breast Cancer 6,
29 (2020). https://doi.org/10.1038/s41523-020-0171-1.
- Zhang J,, Kiser K, Kim S. Whole tumor pharmacokinetic model analysis with 3D isotropic high resolution using 3D-UTE-GRASP sequence at 7T. ISMRM 2020 abstract 0007.
- Zhang J, Winters K, Reynaud O, Kim SG. Simultaneous measurement of T1 /B1 and pharmacokinetic model parameters using active contrast encoding (ACE)-MRI. NMR Biomed. 2017;30(9):10.
- Zhang J, Kim SG. Estimation of cellular-interstitial water exchange in dynamic contrast enhanced MRI using two flip angles. NMR Biomed. 2019;32(11):e4135.
- Zhang J, Winters K, Kiser K, Baboli M, Kim SG. Assessment of tumor treatment response using active contrast encoding (ACE)-MRI: Comparison with conventional DCE-MRI. PLoS One. 2020;15(6):e0234520.
Figures