4535
Inverse Z-spectrum analysis of chemical exchange saturation transfer MRI in orthotopic models of paediatric-type diffuse high grade glioma.1Division of Radiotherapy & Imaging, Institute of Cancer Research, London, United Kingdom, 2Division of Molecular Pathology, Institute of Cancer Research, London, United Kingdom
Synopsis
Keywords: Biology, Models, Methods, Cancer, Preclinical; CEST & MT
Motivation: The diffuse growth of paediatric-type diffuse high grade glioma (PDHGG) precludes complete delineation with conventional MRI.
Goal(s): Molecular imaging with CEST may improve tumour detection.
Approach: Three orthotopic models of PDHGG were assessed using inverse Z-spectrum analysis of CEST data.
Results: Clear distinction between tumour and contralateral normal-appearing brain in ssMT and rNOE maps, which relate to macromolecular content, was observed in two well-defined tumour models when analysed using MTRRex and AREX. Similar CEST contrast was also apparent in a third more diffuse model, inconspicuous on T2w-MRI. This CEST approach can successfully stratify PDHGG tumours in vivo.
Impact: Relaxation compensated CEST metrics provide novel biochemical contrasts in three orthotopic models of paediatric-type diffuse high grade glioma, enabling detection of diffuse disease, highlighting the clinical potential of CEST contrasts to stratifying tumours.
Introduction
Paediatric-type diffuse high grade glioma (PDHGG) is a devastating childhood cancer, with dismal average survival of 9-15 months[1]. Current imaging modalities struggle to delineate areas of diffuse growth and cannot accurately assess treatment response.Chemical exchange saturation transfer (CEST) MRI is being exploited for the identification and assessment of cellular metabolites within adult brain tumours, primarily with amide proton transfer imaging, providing excellent image contrast based on endogenous mobile proteins and peptides[2, 3].
Inverse Z-spectrum analysis has been used to derive the relaxation compensated magnetization transfer ratio (MTRRex), corrected for direct water saturation on the CEST pool resonance (“spillover”) and MT contrast emanating from macromolecules. MTRRex can be extended by compensating for T1 relaxation in apparent exchange-dependent relaxation (AREX)[4]. These CEST metrics can provide multiple and more discrete contrast relating to immobile (semi-solid magnetization transfer, ssMT), and mobile macromolecules (relayed nuclear Overhauser effect, rNOE), as well as proteins (amides and amines), at high resolution.
Here, CEST imaging and inverse Z-spectrum analysis was developed and applied to map and quantify the metabolic phenotype arising in three orthotopic models of PDHGG.
Methods
ICR-CXJ-001 and KNS42 PDHGG cells, and ICR-CXJ-073 dissociated PDHGG tissue (n=5,4,3), were injected supratentorially into NSG or athymic nude mice. Tumour-bearing mice were anaesthetised (isoflurane in air) and imaged on a Bruker 7T horizontal bore system using a 2x2cm mouse brain array coil. Anatomical T2-weighted (T2w) RARE (TR/TE=4500/36ms) were first acquired for tumour localisation.B0 and B1 maps were acquired with a 2D WASABI pulse[5] (TR=3000ms, RARE Factor=26, FOV=16x15x1mm, Resolution=0.2x0.2x1mm, B1=5µT, Tsat=5ms, saturation pulse applied at 25 frequencies between -1.2 and 1.1ppm). Z spectra images (TR=6250ms, RARE Factor=26, B1=0.8/1.2µT, Tsat=6000ms) were then acquired at 89 frequencies between -100 and 100ppm. Sampling was acquired more densely around frequencies corresponding to metabolite pools. Reference images with the same parameters, saturation time and pulse amplitude were acquired using a saturation frequency of -300ppm. T1 and T2 were quantified using an IR-trueFISP sequence[6] (TR=3.7ms, RARE Factor=9, 50 inversion times).
Z-spectra were analysed in MATLAB with the open source CEST-eval master and Bruker extension, methodology adapted from Mennecke et al[7], and B0/B1 correction applied[8]. Further B0 correction was achieved by Lorentzian fitting the direct water saturation peak and shifting to 0ppm. Images were denoised by principal component analysis with MP denoising toolbox[9, 10] and registered to correct for motion with the inbuilt MATLAB function imregister. The IDEAL algorithm[11] was used to fit the Z-spectra with a five pool Lorentzian with the MATLAB function lsqcurvefit, with an additional straight-line term to account for coil heating during imaging. MTRRex and AREX were calculated as described by Zaiss et al[4, 12, 13].
The MTRRex and AREX signals associated with ssMT (-1.49ppm), rNOE (-3.5ppm), amide (3.5ppm) and amine (2.0ppm) proton transfer were interrogated from ROIs drawn around the tumour or the contralateral normal-appearing brain (CNAB).
Results and Discussion
MTRRex maps revealed clear tumour delineation associated with a marked overall reduction in ssMT, rNOE and amide signal in well-defined ICR-CXJ-001 and KNS42 models (Figure 1).Quantitatively, lower MTRRex ssMT and rNOE signal was consistently determined in both these models, consistent with a lower macromolecular content relative to CNAB (Figure 2). Intriguingly, MTRRex amide maps also showed lower signal in tumour compared to CNAB. An additional rNOE peak, corresponding to aromatic carbons, is present between 1-4ppm, which may influence this contrast and requires correction to isolate the CEST signal relating to protein content[12]. Interestingly, MTRRex amine signal was consistently higher in ICR-CXJ-001 tumours compared to CNAB, but lower in KNS42 tumours. As increased amine CEST signal is associated with lower tissue pH, this may reflect a more acidic microenvironment within ICR-CXJ-001 tumours[14].
T1 data was used to calculate AREX for the ICR-CXJ-001 cohort (Figure 3). Note the differences in all CEST signals between the tumour and CNAB persists, indicating that the difference seen in the amine MTRRex is not solely due to the T1 component.
ICR-CXJ-073 patient-derived xenografts demonstrated a more radiologically diffuse growth phenotype and could not be clearly delineated on T2w images. However, regions of decreased signal in the MTRRex ssMT and rNOE maps corresponding to the frontal location of tumour implantation were observed, indicating lower macromolecular content associated with the tumours (Figure 4).
Conclusion
Inverse Z-spectrum analysis of CEST imaging data can successfully delineate tumours from CNAB in well-defined PDHGG models, and demonstrates potential in detecting more diffuse tumour growth. Multiple CEST contrasts could therefore be beneficial for assessing the heterogeneous growth patterns observed clinically in PDHGG.Acknowledgements
We acknowledgement support from the Cancer Research UK Centre at the ICR and Cancer Research UK grant C16412/A27725.References
1. Mackay, A., et al., Integrated Molecular Meta-Analysis of 1,000 Pediatric High-Grade and Diffuse Intrinsic Pontine Glioma. Cancer Cell, 2017. 32(4): p. 520-537 e5.
2. Jones, C.K., et al., Amide proton transfer imaging of human brain tumors at 3T. Magn Reson Med, 2006. 56(3): p. 585-92.
3. Ma, B., et al., Applying amide proton transfer-weighted MRI to distinguish pseudoprogression from true progression in malignant gliomas. J Magn Reson Imaging, 2016. 44(2): p. 456-62.
4. Zaiss, M., et al., Inverse Z-spectrum analysis for spillover-, MT-, and T1 -corrected steady-state pulsed CEST-MRI--application to pH-weighted MRI of acute stroke. NMR Biomed, 2014. 27(3): p. 240-52.
5. Schuenke, P., et al., Simultaneous mapping of water shift and B1 (WASABI)-Application to field-Inhomogeneity correction of CEST MRI data. Magn Reson Med, 2017. 77(2): p. 571-580.
6. Schmitt, P., et al., Inversion recovery TrueFISP: quantification of T(1), T(2), and spin density. Magn Reson Med, 2004. 51(4): p. 661-7.
7. Mennecke, A., et al., 7 tricks for 7 T CEST: Improving the reproducibility of multipool evaluation provides insights into the effects of age and the early stages of Parkinson's disease. NMR Biomed, 2023. 36(6): p. e4717.
8. Windschuh, J., et al., Correction of B1-inhomogeneities for relaxation-compensated CEST imaging at 7 T. NMR Biomed, 2015. 28(5): p. 529-37.
9. Veraart, J., et al., Denoising of diffusion MRI using random matrix theory. Neuroimage, 2016. 142: p. 394-406.
10. Does, M.D., et al., Evaluation of principal component analysis image denoising on multi-exponential MRI relaxometry. Magn Reson Med, 2019. 81(6): p. 3503-3514.
11. Zhou, I.Y., et al., Quantitative chemical exchange saturation transfer (CEST) MRI of glioma using Image Downsampling Expedited Adaptive Least-squares (IDEAL) fitting. Sci Rep, 2017. 7(1): p. 84.
12. Zaiss, M., et al., Downfield-NOE-suppressed amide-CEST-MRI at 7 Tesla provides a unique contrast in human glioblastoma. Magn Reson Med, 2017. 77(1): p. 196-208.
13. Zaiss, M., et al., Relaxation-compensated CEST-MRI of the human brain at 7T: Unbiased insight into NOE and amide signal changes in human glioblastoma. Neuroimage, 2015. 112: p. 180-188.
14. Boyd, P.S., et al., Mapping intracellular pH in tumors using amide and guanidyl CEST-MRI at 9.4 T. Magn Reson Med, 2022. 87(5): p. 2436-2452.
Figures
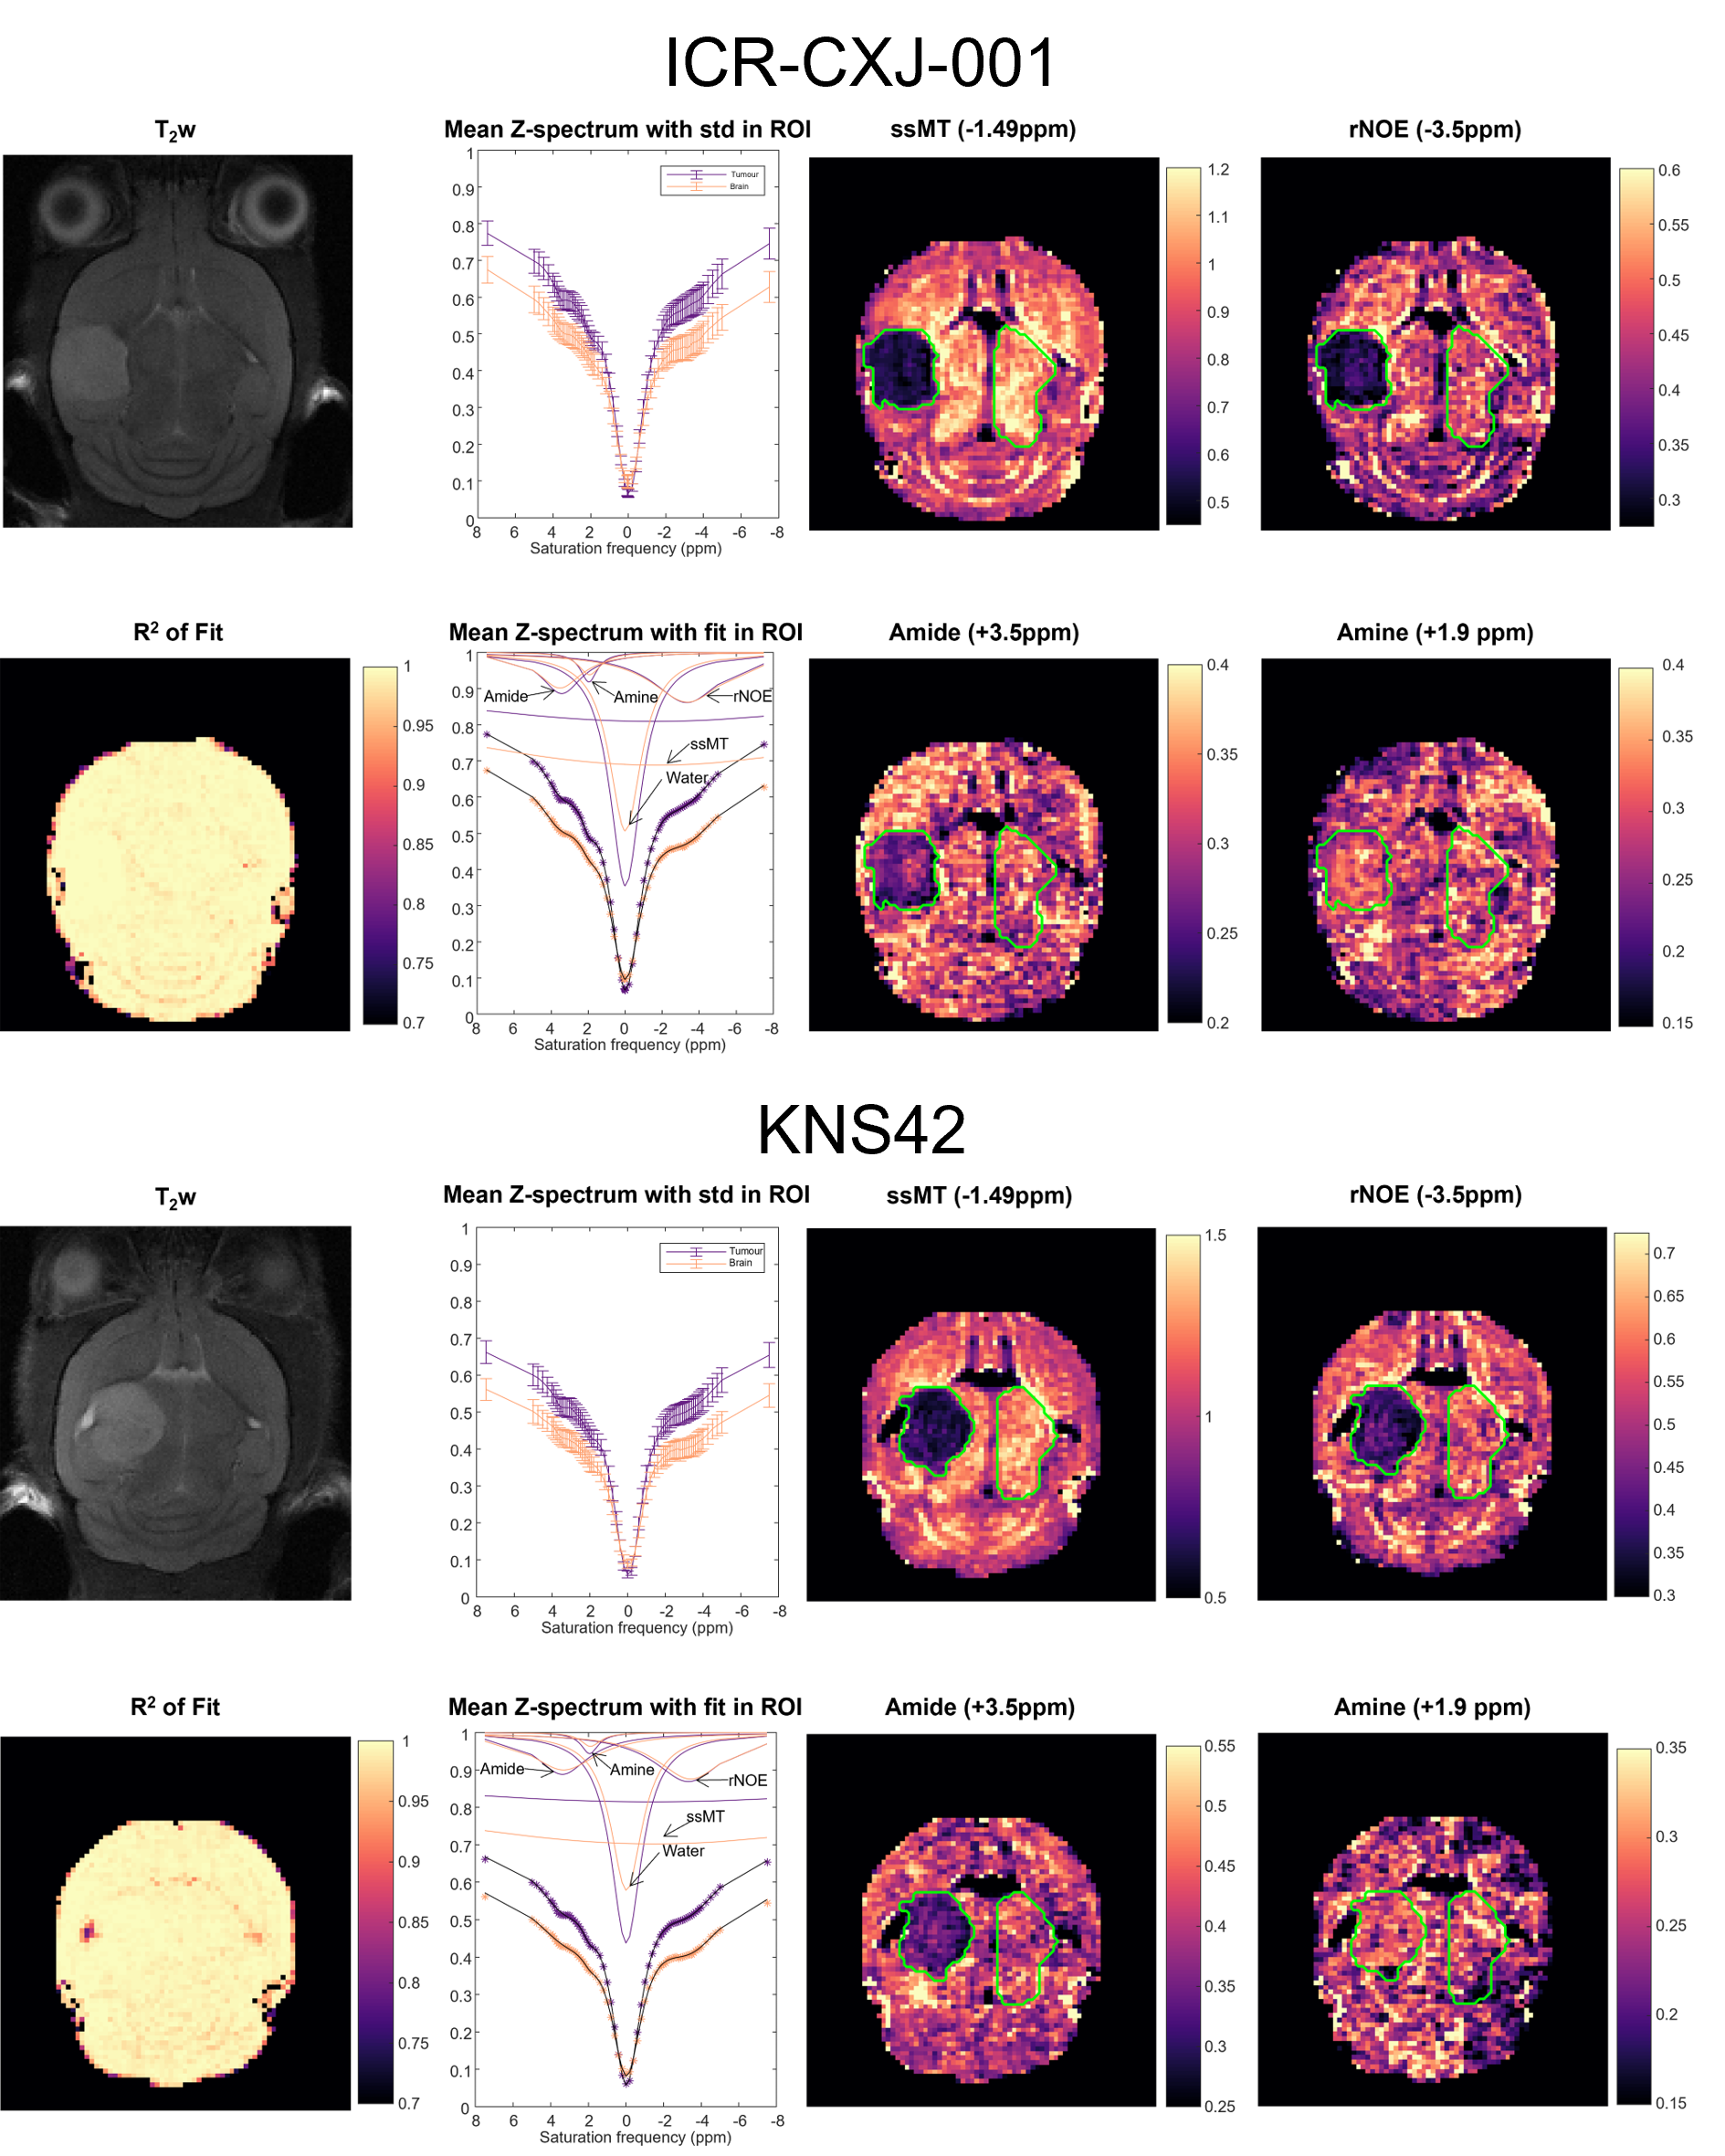
Figure 1: T2w images showing tumour location in mice bearing ICR-CXJ-001 (NSG) or KNS42 (nude) tumours. Z-spectra of tumour (purple) and CNAB (orange) with error bars from pixel values within the ROIs from the 1.2µT saturation pulse. Mean fit (black) and individual Lorentzian components for each ROI (tumour purple, CNAB orange). R2 of each pixel of the mean fit and acquired data. MTRRex maps of CEST signal pools (ROIs in green) from the ssMT, rNOE, amide and amine contrasts. Note the different dynamic scale range used in the maps between the two models.
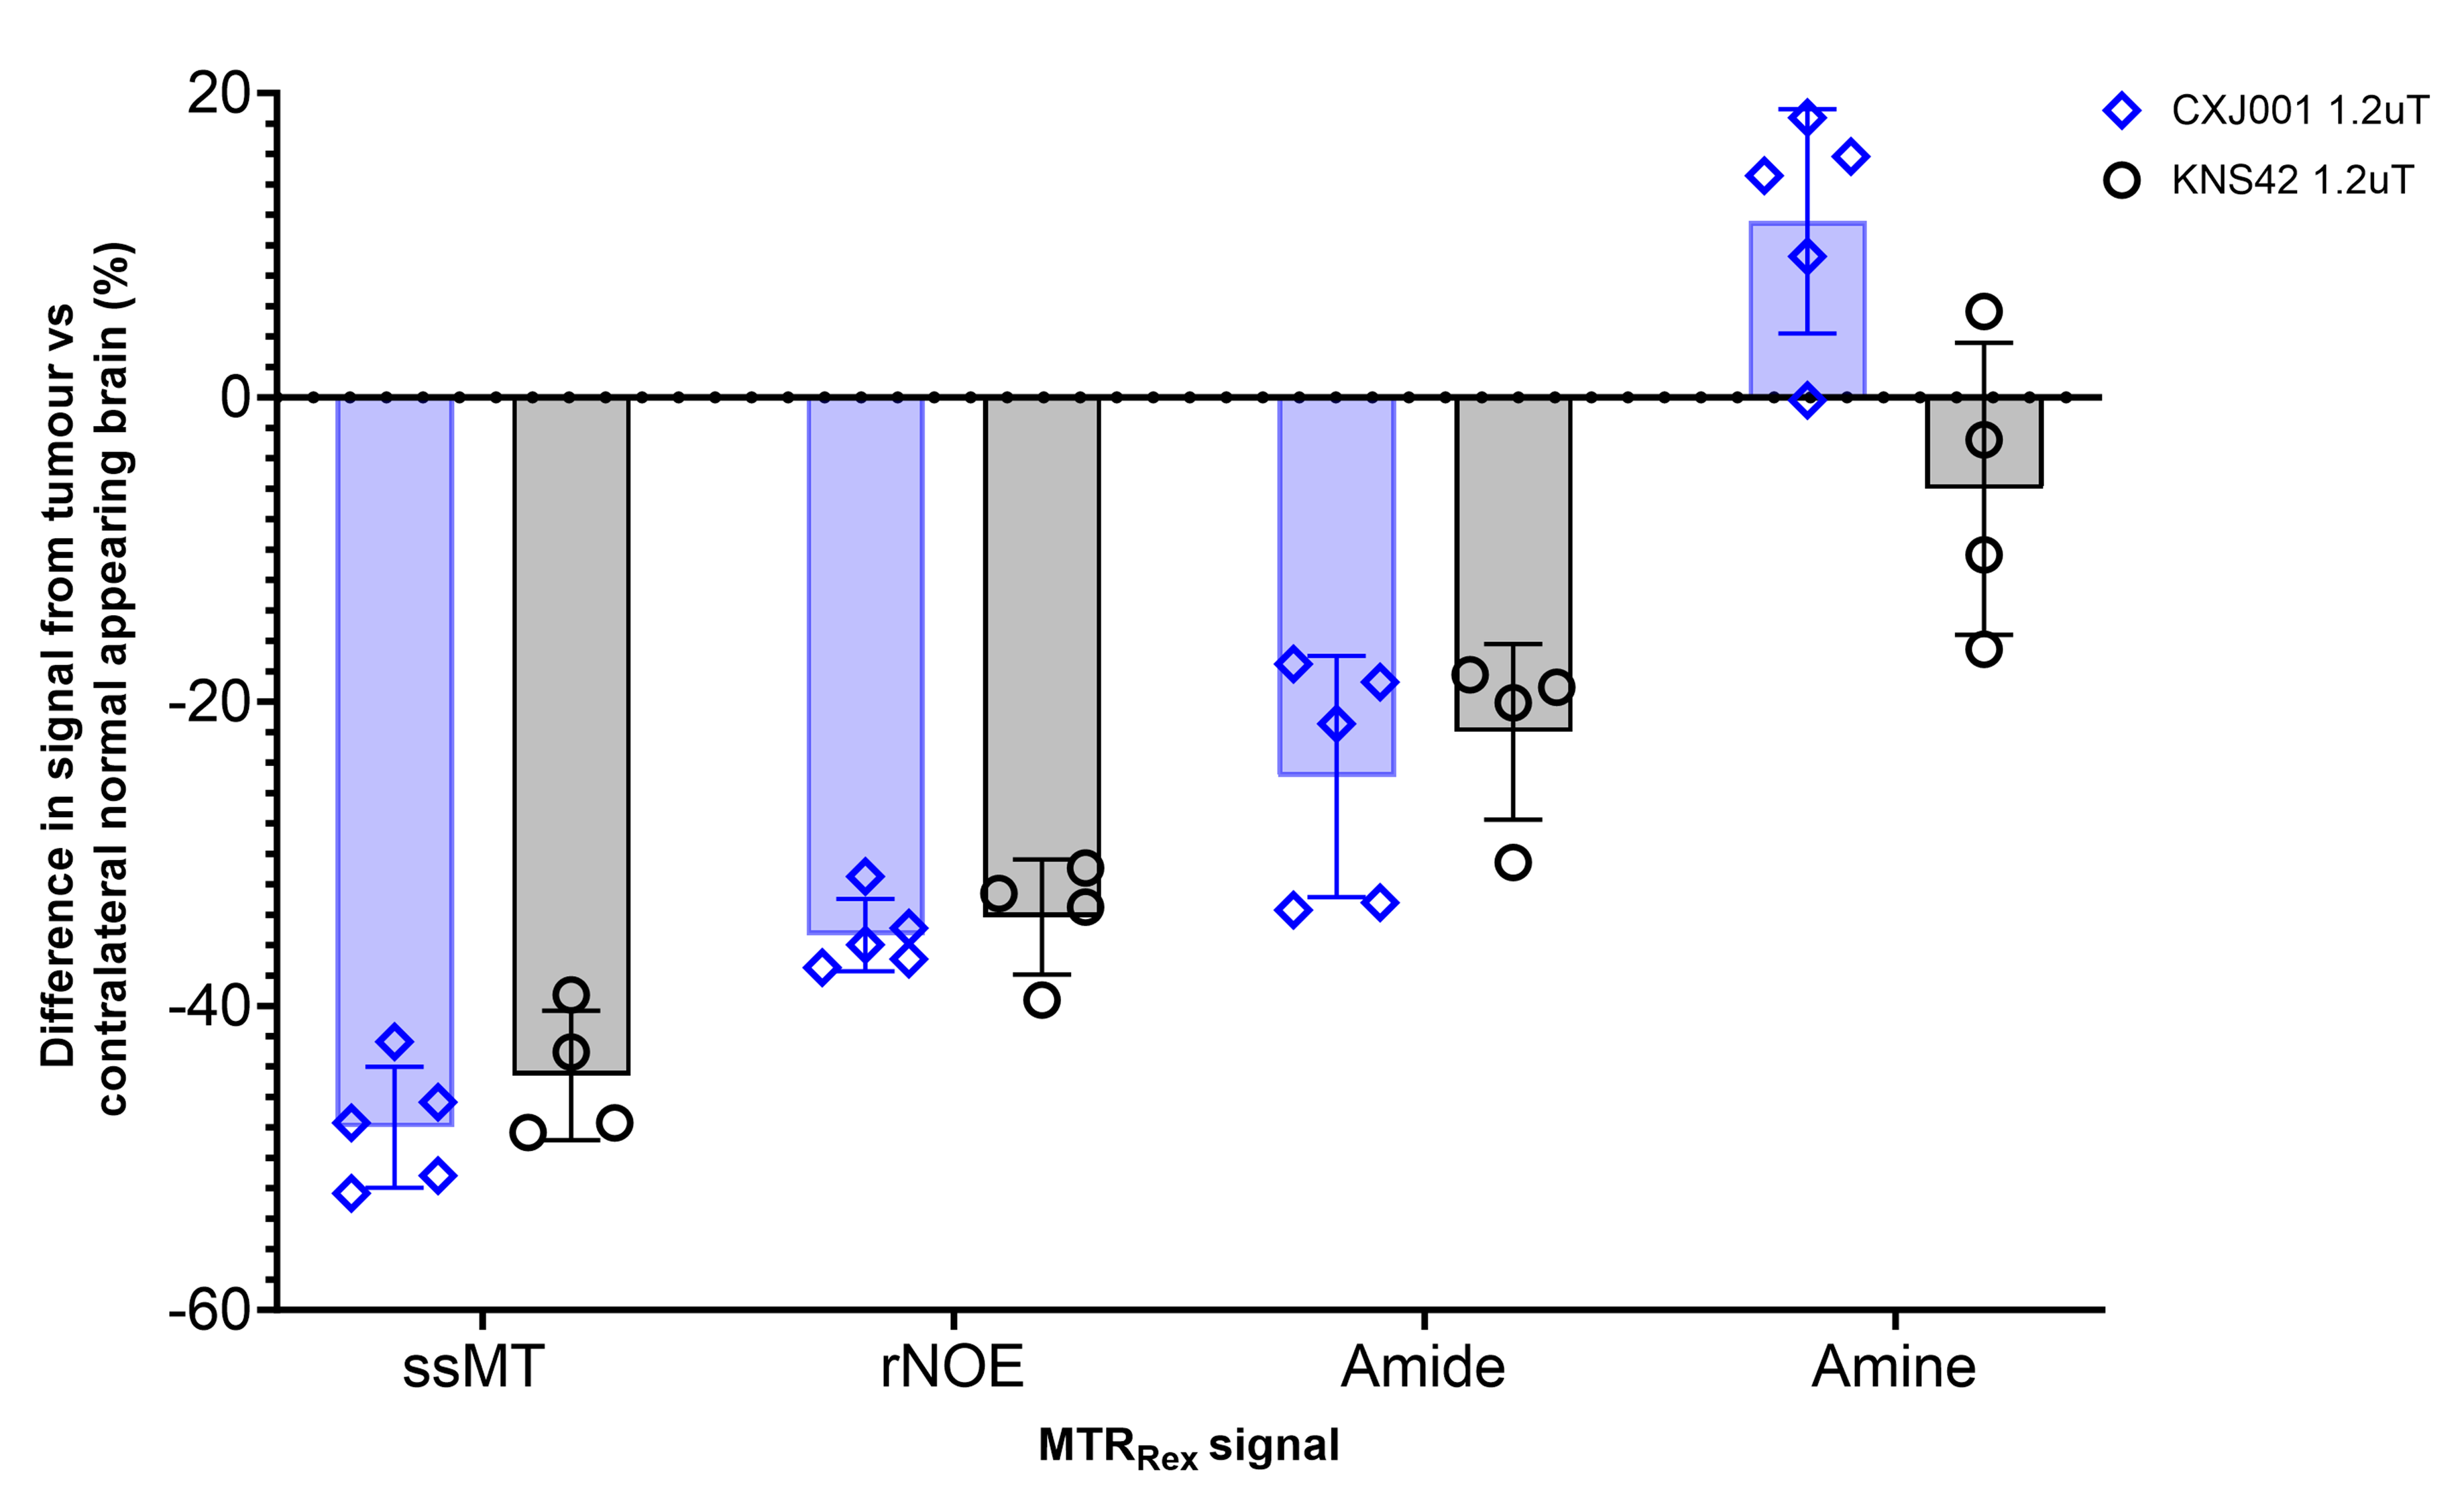
Figure 2: Difference in median CEST signal between the tumour and CNAB ROIs, which is then normalised as a % of the median CNAB ROI to account for any difference in signal across the MTRRex contrasts from the 1.2µT saturation pulse.
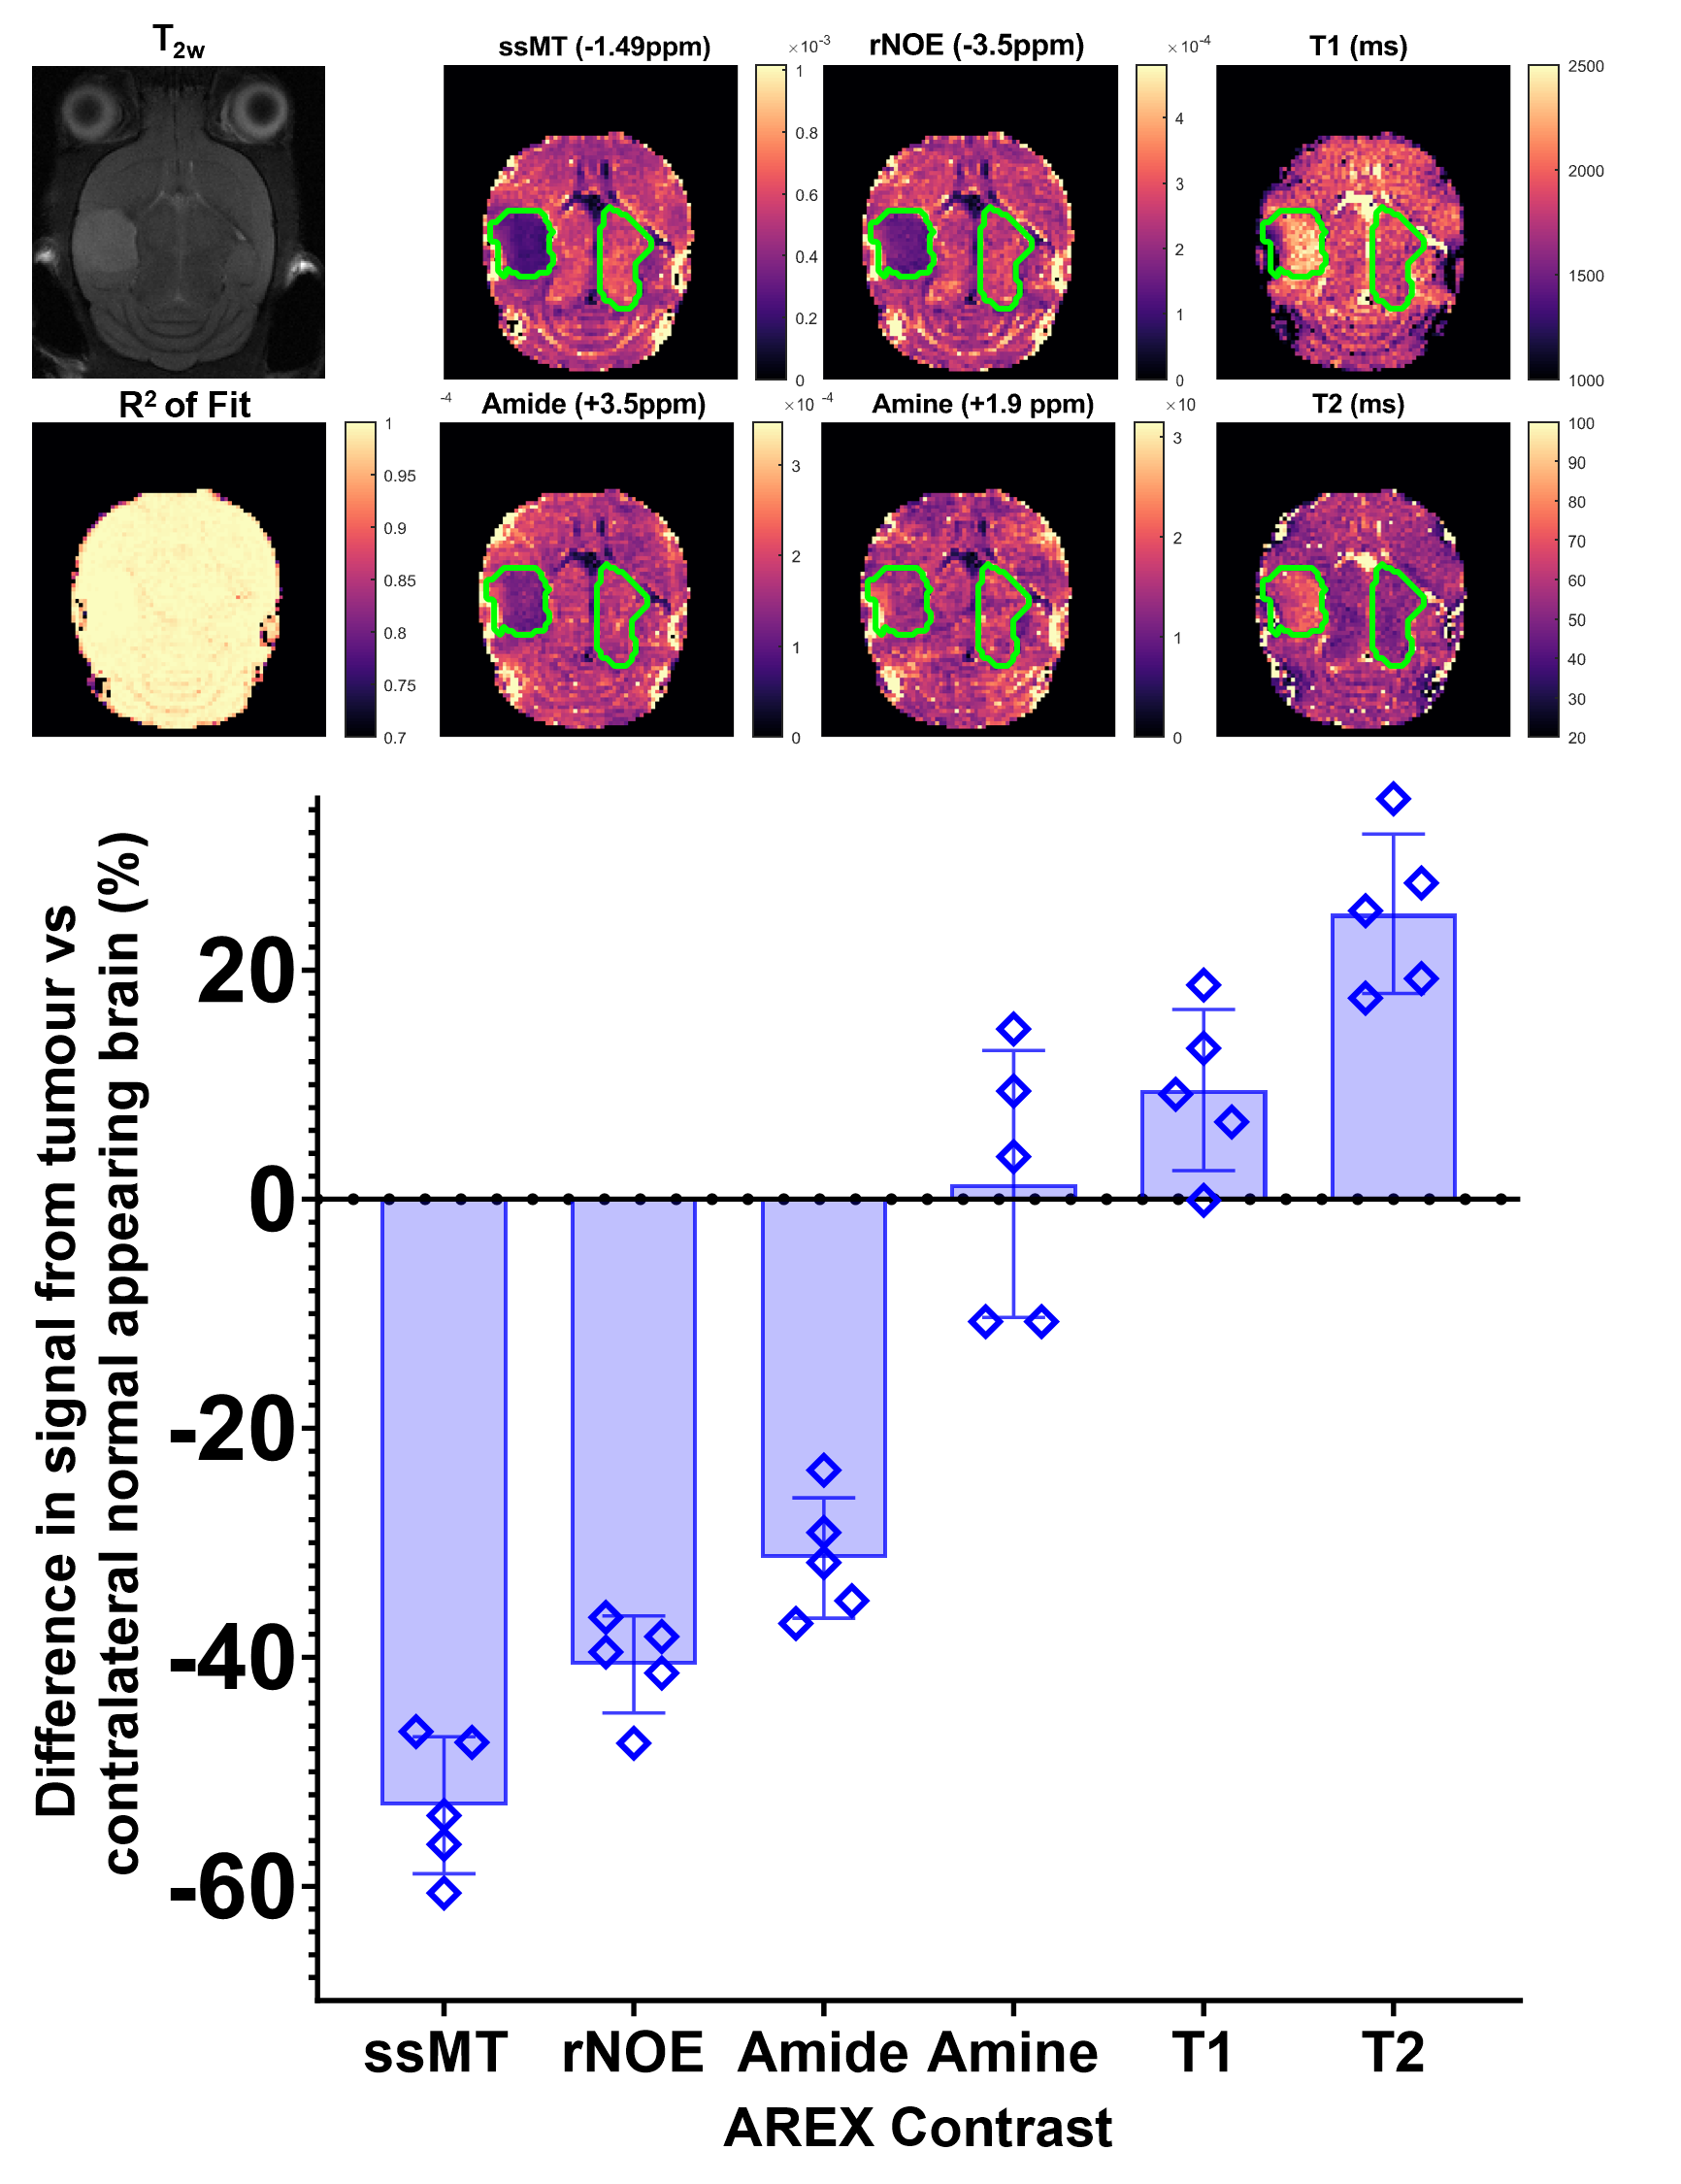
Figure 3: T2w image of the same ICR-CXJ-001 tumour-bearing mouse as in Figure 1 alongside AREX contrasts from the 1.2µT saturation pulse in ms-1, T1 and T2 maps and R2 map of each pixel of the mean fit and acquired data. % difference between tumour and CNAB in AREX maps across multiple contrasts. % difference taken as the difference in median value of tumour and CNAB ROIs normalised to the median value of the CNAB ROI.
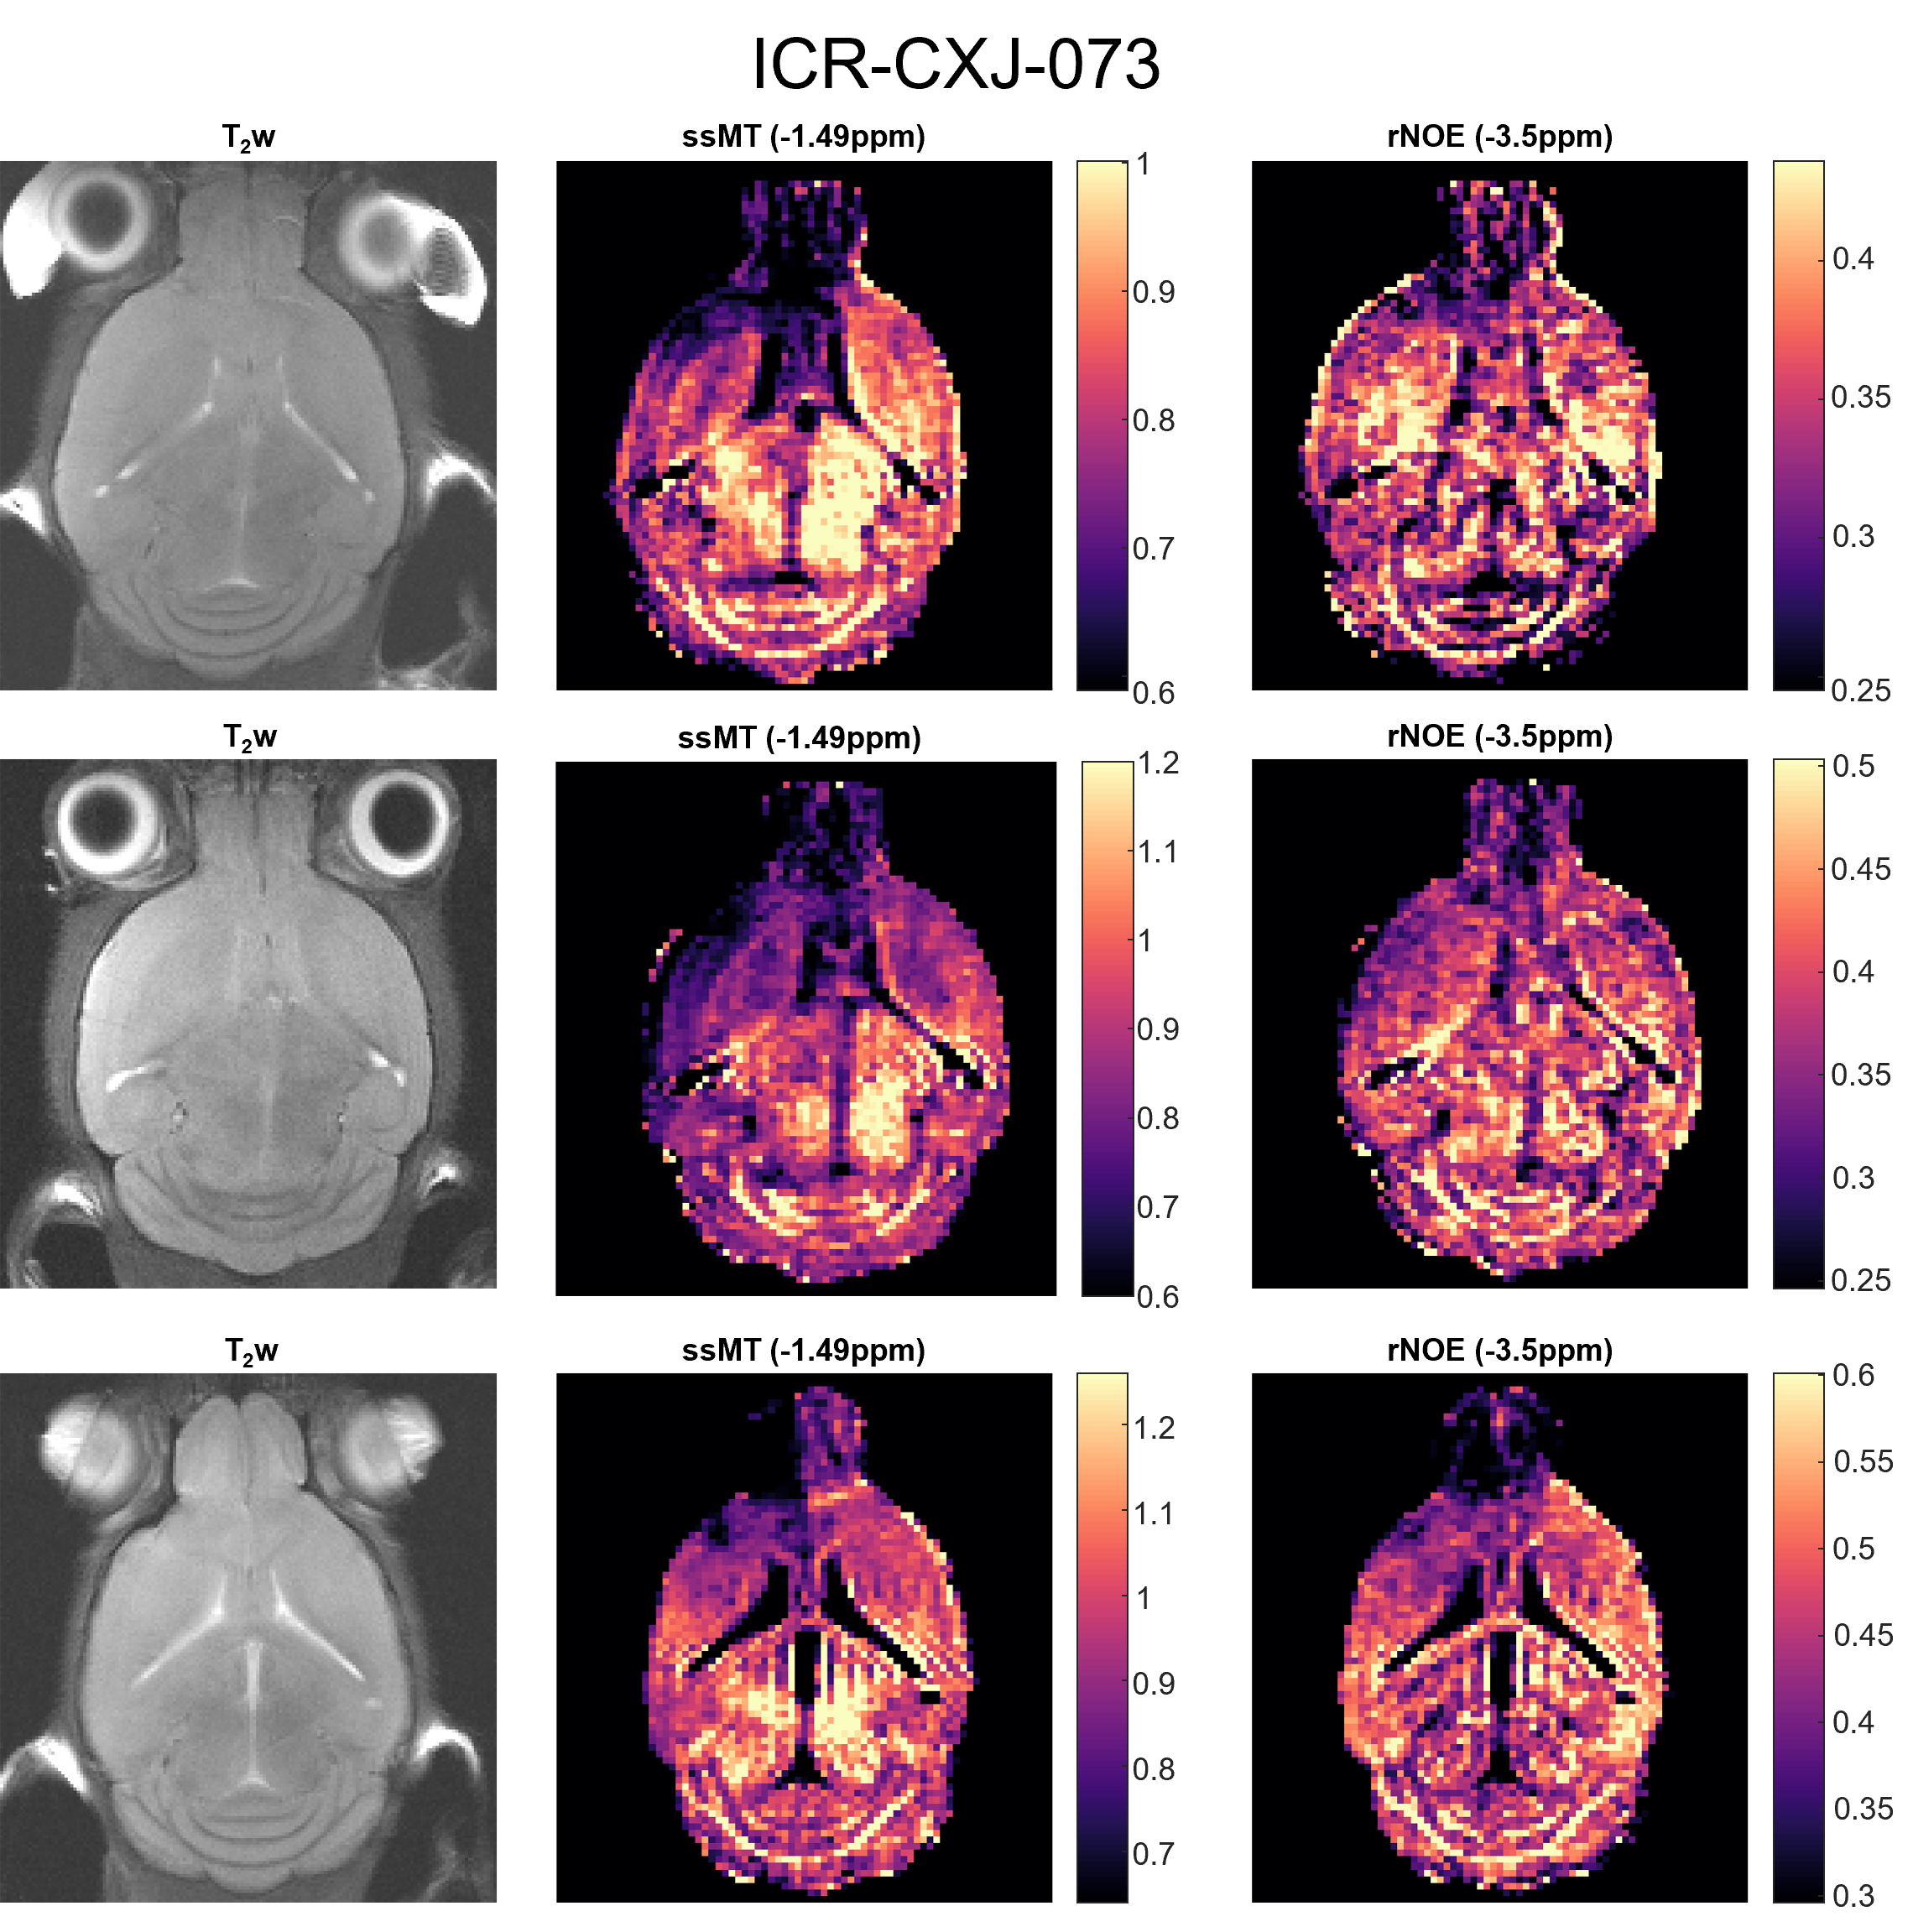
Figure 4: T2w images of three NSG mice bearing ICR-CXJ-073 patient-derived xenografts, demonstrating diffuse hyperintensity in the front right hemisphere (left of image) and midline shift, but no clear margins of tumour. MTRRex images from the 1.2µT scans of ssMT and rNOE, show clearer regions of lower contrast in the same areas. Note, motion in the 0.8µT CEST scans of the mouse shown in bottom row precluded its use in the B1 correction, so B1 was corrected for assuming no saturation at 0µT.