4534
Assessing host-tumour vasculature and glycolytic metabolism in response to hypoxia in a chick CAM model of GBM using MRI and MRS1Molecular and Clinical Cancer Medicine, Institute of Systems, Molecular & Integrative Biology, University of Liverpool, Liverpool, United Kingdom, 2Centre for Preclinical Imaging, Liverpool Shared Research Facilities, University of Liverpool, Liverpool, United Kingdom, 3Egg Facility, Liverpool Shared Research Facilities, University of Liverpool, Liverpool, United Kingdom, 4Department of Radiology, University of Pennsylvania, Philadelphia, PA, United States, 5Biochemistry, Cell and Systems Biology, Institute of Systems, Molecular & Integrative Biology, University of Liverpool, Liverpool, United Kingdom
Synopsis
Keywords: Biology, Models, Methods, Cancer, Glioblastoma, hypoxia, vasculature, metabolism, chick embryo CAM model
Motivation: Understanding vasculature, hypoxia and glycolysis in GBM is paramount towards understanding its resistance to therapies, but cannot be done in vitro. The CAM model is attractive as it provides the interaction between host vasculature and the tumour.
Goal(s): Optimise MRI and MRS to assess hypoxia, tumour-host vasculature and glycolytic metabolism in the GBM-CAM.
Approach: GBM-CAM xenografts were created under normoxic- and hypoxic-conditions. Imaging was performed using microscopy and MRI, and lactate detection via MRS.
Results: Distinct morphological differences in vasculature were identified between conditions. MRI revealed vessel penetration, MRS detected lactate levels, which were significantly higher in hypoxic tumours than in the CAM.
Impact: Developing tools to characterise vascular morphology and quantify lactate levels in the CAM GBM model can shed light on fundamental biological mechanisms, and support the development of therapeutic strategies for the clinic.
Introduction
Glioblastoma multiforme (GBM) is a deadly primary brain tumour, characterized by aberrant angiogenesis and hypoxia, promoting tumour growth and treatment resistance1,2. During aggressive tumour development, these major hallmarks are observed alongside reprogramming to glycolytic metabolism3,4. Resulting elevated lactate levels correlate with glioma tumour malignancy, offering a potential non-invasive marker of tumour microenvironment5,6. The chick chorioallantoic membrane (CAM) is an increasingly popular alternative to rodent models, is amenable to in vivo imaging, and its well-developed vasculature readily enables engraftment of tumour cells, making it ideal for studying the host- tumour vascular relationship7,8. Previous studies assessing the effects of hypoxia on CAM-tumour xenografts have shown that tumours display a more aggressive phenotype following hypoxia preconditioning, and more accurately recapitulate the patient tumour9,10. However, none such studies have utilised MRI for quantitative assessment of changes to vasculature, and none have reported MRS studies in this model. Our aim to utilise MRI and MRS to assess the effects of hypoxia on tumour/host vasculature and glycolytic metabolism using the GBM-CAM model.Method
Tumour xenografts were generated by implanting 2x10⁶ U251 cells onto the CAM on embryonic day 7 (E7). For normoxic tumours (n=3), cells were maintained at 21%O2 and for hypoxic tumours (n=3), cells were conditioned in a hypoxia chamber at 1%O2 for 72 hours prior to implantation. On E13, control and tumour xenografted CAMs were imaged in ovo by brightfield (BF) microscopy under a Leica M165FC stereomicroscope, and MRI with a horizontal bore 9.4 T system. Eggs were placed in a custom-built cradle with an actively decoupled 20 mm diameter surface coil placed above the site of the tumour, used together with an 86 mm inner diameter quadrature coil for signal transmission. A 3D TurboRARE (spin-echo, T2-weighted) pulse sequence was used: field of view 40 x 40 x 2.097 mm3, resolution = 156 x 156 x 1210 microns, TR/TE = 2000/9.162 ms, effective TE: 45.81 ms, Echo spacing: 9.162 ms, RARE factor = 14, slab thickness = 2 mm, averages 4, flip angle 90, scan time 28m48 s. Image-selected in vivo spectroscopy (ISIS) was performed using the selective multiple quantum filter technique (SelMQC) for lactate detection. For microscopy, the IKOSA CAM Assay was used to determine total blood vessel area, mean thickness and number of branching points. Amira software was used to determine blood vessel volume for 3D MR images, by manually drawing over blood vessels in each slice. Both analyses were performed on a region of interest of 10X10 mm for each chick. MR spectra were quantified using lactate/ water ratio.Results
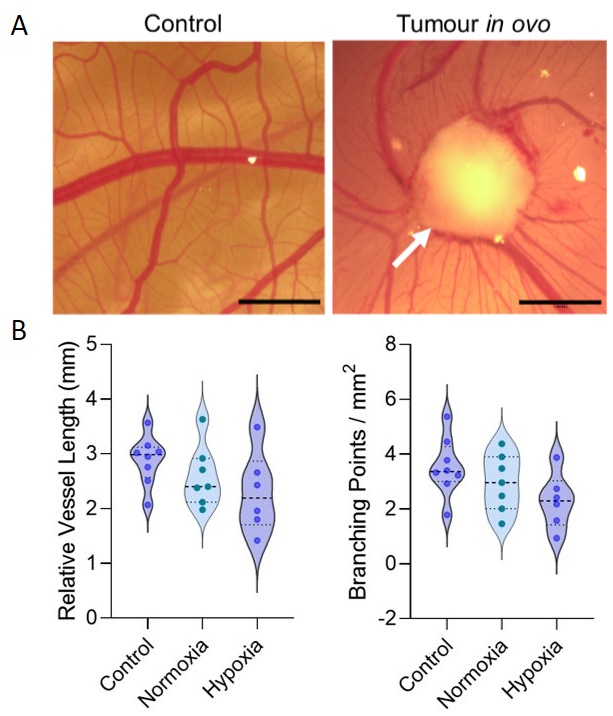
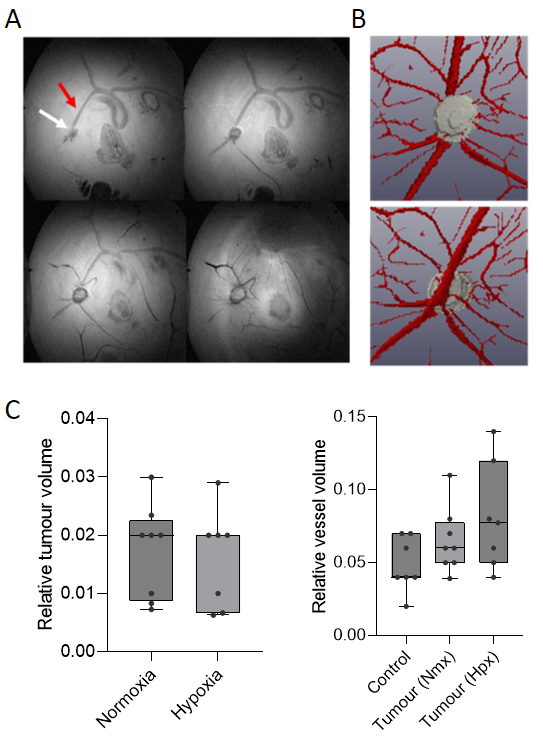
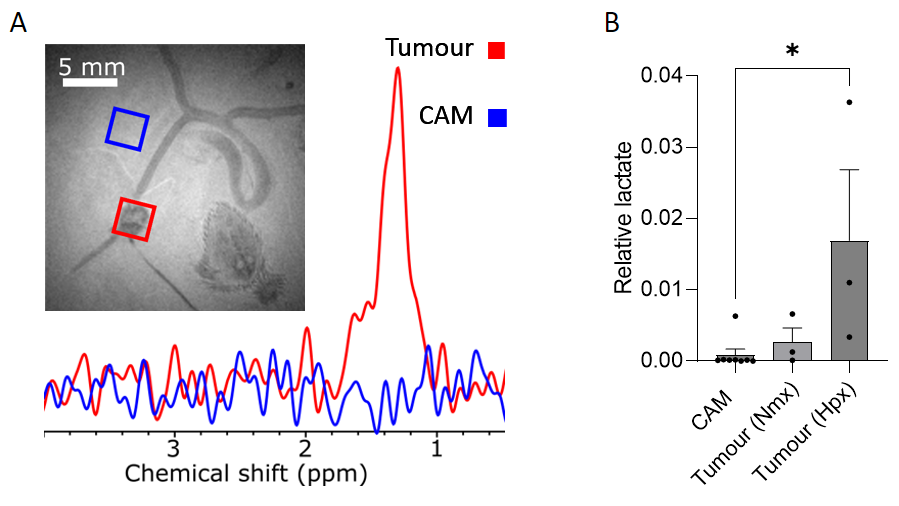
Distinct morphological differences in vasculature were observed in GBM-xenografted CAMs compared with non-tumour bearing control CAMs (Fig. 1). Blood vessels formed a radial ‘spoke-like’ pattern surrounding the tumour, with a trend towards more abundant vasculature in the hypoxic tumour group. MRI revealed vessels penetrating the nodules not visible by microscopy, and quantification showed a trend towards increased blood vessel volume in tumour-bearing CAMs compared with controls. While tumour volume was similar between the hypoxic and normoxic groups, there was a trend towards greater blood vessel volume in the hypoxic group (Fig. 2). Lactate was detected in tumour xenografts, with significantly higher lactate levels in the hypoxic group compared with controls (CAM membrane control n=8, hpx n=3, p= 0.02) (Fig. 3).Discussion
Hypoxia appears to induce more aggressive features of GBM in our CAM model, with regards to morphology and metabolism, suggesting that a ‘memory’ of hypoxic signature is preserved, as reported in previous studies. In combination, microscopy and MRI provide a comprehensive assessment of tumour/ host vasculature, while MRI provides additional 3D information through the layers of the CAM. Lactate detection in our GBM-CAM model suggests these tumours to be glycolytic in nature as seen in patients. The observed association between hypoxia-induced metabolic changes and morphological alterations in our CAM model mirrors that seen in the clinic and could be used to shed light on the response of patient GBM tumours to hypoxia as well as offer insights into the development of more effective treatment strategies.Conclusion
Our study shows that the relationship between tumour hypoxia, angiogenesis, and glycolytic metabolism in GBM can be studied efficiently in the CAM model using MRI and MRS.Acknowledgements
The authors would like to acknowledge the use of the Chick Embryo Facility (CEF) and Centre for Pre-Clinical Imaging (CPI), provided by Liverpool Shared Research Facilities, Faculty of Health and Life Sciences, University of Liverpool. We are grateful to the Isle of Man Anti-Cancer Association for their support.References
- Ribatti D. The chick embryo chorioallantoic membrane as an experimental model to study in vivo angiogenesis in glioblastoma multiforme. Brain Res Bull. 2022 May;182:26-29. doi: 10.1016/j.brainresbull.2022.02.005. Epub 2022 Feb 8. PMID: 35143927.
- Torrisi F, Alberghina C, D'Aprile S, Pavone AM, Longhitano L, Giallongo S, Tibullo D, Di Rosa M, Zappalà A, Cammarata FP, Russo G, Ippolito M, Cuttone G, Li Volti G, Vicario N, Parenti R. The Hallmarks of Glioblastoma: Heterogeneity, Intercellular Crosstalk and Molecular Signature of Invasiveness and Progression. Biomedicines. 2022 Mar 30;10(4):806. doi: 10.3390/biomedicines10040806. PMID: 35453557; PMCID: PMC9031586.
- Toyonaga T, Yamaguchi S, Hirata K, Kobayashi K, Manabe O, Watanabe S, Terasaka S, Kobayashi H, Hattori N, Shiga T, Kuge Y, Tanaka S, Ito YM, Tamaki N. Hypoxic glucose metabolism in glioblastoma as a potential prognostic factor. Eur J Nucl Med Mol Imaging. 2017 Apr;44(4):611-619. doi: 10.1007/s00259-016-3541-z. Epub 2016 Oct 18. PMID: 27752745.
- Talasila KM, Røsland GV, Hagland HR, Eskilsson E, Flønes IH, Fritah S, Azuaje F, Atai N, Harter PN, Mittelbronn M, Andersen M, Joseph JV, Hossain JA, Vallar L, Noorden CJ, Niclou SP, Thorsen F, Tronstad KJ, Tzoulis C, Bjerkvig R, Miletic H. The angiogenic switch leads to a metabolic shift in human glioblastoma. Neuro Oncol. 2017 Mar 1;19(3):383-393. doi: 10.1093/neuonc/now175. PMID: 27591677; PMCID: PMC5464376.
- Kahlon AS, Alexander M, Kahlon A, Wright J. Lactate levels with glioblastoma multiforme. Proc (Bayl Univ Med Cent). 2016 Jul;29(3):313-4. doi: 10.1080/08998280.2016.11929449. PMID: 27365883; PMCID: PMC4900781.
- Sitter B, Forsmark A, Solheim O. Elevated Serum Lactate in Glioma Patients: Associated Factors. Front Oncol. 2022 May 19;12:831079. doi: 10.3389/fonc.2022.831079. PMID: 35664752; PMCID: PMC9161145.
- Tufan AC, Satiroglu-Tufan NL. The chick embryo chorioallantoic membrane as a model system for the study of tumor angiogenesis, invasion and development of anti-angiogenic agents. Curr Cancer Drug Targets. 2005 Jun;5(4):249-66. doi: 10.2174/1568009054064624. PMID: 15975046.
- Ribatti D. The chick embryo chorioallantoic membrane in the study of tumor angiogenesis. Rom J Morphol Embryol. 2008;49(2):131-5. PMID: 18516317.
- Draper J, Alexander J, Nair RM, Scullion N, Narayana RVL, Aughton K, Herrmann A, Vemuganti GK, Kalirai H, Coupland SE. Using the Chick Embryo Model to Examine the Effects of Hypoxia Pre-conditioning of Uveal Melanoma Cells on Tumor Growth and Metastasis. Curr Eye Res. 2023 Apr;48(4):408-415. doi: 10.1080/02713683.2022.2152055. Epub 2022 Dec 9. Erratum in: Curr Eye Res. 2023 Mar 20;:1. PMID: 36484268.
- Al-Mutawa YK, Herrmann A, Corbishley C, Losty PD, Phelan M, Sée V. Effects of hypoxic preconditioning on neuroblastoma tumour oxygenation and metabolic signature in a chick embryo model. Biosci Rep. 2018 Aug 29;38(4):BSR20180185. doi: 10.1042/BSR20180185. PMID: 30026261; PMCID: PMC6131206.
Figures