4533
Repeatability of a quantitative multiparametric MRI protocol for imaging hypoxia, cellularity, and perfusion in a murine model of glioblastoma1Biomedical Engineering, University of Texas at Austin, Austin, TX, United States, 2Oden Institute for Computational Science and Engineering, University of Texas at Austin, Austin, TX, United States, 3Diagnostic Imaging, Dell Medical School, Austin, TX, United States, 4Livestrong Cancer Institutes, Dell Medical School, Austin, TX, United States, 5Oncology, Dell Medical School, Austin, TX, United States, 6Imaging Physics, MD Anderson Cancer Center, Houston, TX, United States
Synopsis
Keywords: Preclinical Image Analysis, Quantitative Imaging, hypoxia
Motivation: Heterogeneous distributions of hypoxic tissues lead to divergent radiotherapy response. Thus, developing a practical, accurate, and reproducible method of quantifying hypoxia is of great interest.
Goal(s): Establish a repeatable, multiparametric MRI protocol for quantifying hypoxia.
Approach: We induced C6 brain tumors in rats and conducted test-retest TOLD-MRI, DCE-MRI, and DW-MRI exams on each rat. We then analyzed the MRI data to identify spatially distinct physiological clusters within the tumor.
Results: An initial assessment of repeatability of hypoxia, normoxia, and necrotic tissue localization within a tumor.
Impact: Developing a quantitative and repeatable protocol for quantifying tumor hypoxia will have immediate applications in studies seeking to design, assess, and optimize radiotherapy regimens.
Introduction
Tumor oxygen heterogeneity complicates radiotherapy by introducing variations in radiation efficacy. More specifically, tumor hypoxia, which often occurs within tumors, leads to increases in resistance to radiotherapy and results in poorer patient outcomes.1 Several quantitative MRI methods have been developed to assess tumor heterogeneity. For example, dynamic contrast-enhanced magnetic resonance imaging (DCE-MRI) provides insights on perfusion, and diffusion weighted (DW)-MRI tracks water movement to evaluate tissue microstructure. More recently, Tissue Oxygenation Level Dependent (TOLD)-MRI has been shown to quantitatively measure hypoxia through changes in the amount of dissolved oxygen in tissue.3 Here, we report on efforts at developing a quantitative and repeatable multi-parametric protocol in which image-derived measurements of hypoxia are combined with measures of perfusion and cellularity to identify regions of hypoxia, normoxia, and necrosis in a murine model of glioblastoma.Methods
MRI acquisition. A Bruker 7.0 T MRI system was used to collect: an anatomical T2-weighted scan for tumor segmentation, a DW-MRI scan, TOLD-MRI scan, a T1-map via a variable flip angle (VFA) approach, and a DCE-MRI scan. We have applied this protocol on C6 rat brain tumors (n = 5). General anesthesia was induced by 1.5% isoflurane in medical air. Breathing was maintained at 50 breaths/minute and animal body temperature was maintained at 37 °C by an air heater. A second set of scans were obtained after at least five half-lives of the contrast agent had passed. MRI data analysis was completed in MATLAB (Mathworks Inc, Nattick, MA).MRI protocol and analysis
DW-MRI: The diffusion data was collected using a spin echo sequence (b values: 100, 300, 800 mm/s2), allowing for estimation of apparent diffusion coefficient (ADC) maps by fitting the signal intensities from the three b-values to the standard, mono-exponential decay equation to estimate the ADC for each voxel.
TOLD-MRI: The TOLD-MRI data were collected using a gradient echo (GRE) sequence (TE/TR/FA: 3.4 ms/11 ms/24°) and the signal intensities were converted to T1 using the signal intensity equation for the gradient echo sequence. Importantly, the TOLD-MRI scan contains a gas challenge from medical air to 100% oxygen to medical air with each section lasting 5 minutes.
T1-mapping: T1 maps were constructed from a GRE sequence (TR/TE: 2 ms/200 ms) acquired at flip angles of 5°,10°,15°,20°, and 45°. For each pixel, the signal intensities from the flip angle data were fit to the gradient echo signal intensity to obtain the T1 value.
DCE-MRI: The DCE-MRI data were collected using a GRE sequence (TE/TR/FA: 2.6 ms/90 ms/24°). The DCE-MRI data was analyzed via the reference region model using the sinister temporalis muscle as the internal reference.4
Clustering Analysis The tumor voxels of the multiparametric MRI dataset from both scans were then concatenated and k-means clustering was applied to categorize the voxels into three distinct clusters.5
Statistical Analysis: A Wilcoxon signed-rank test was used to test the null hypothesis between the test and retest measurements. The repeatability value (r) was also computed for each parameter.
Results
Figure 1 displays test/retest parameter maps on one rat tumor. The parameter maps are grouped by the corresponding scan. The top row are images collected from the test protocol, and the bottom row are collected from the retest protocol. The range of values within the tumor indicates the degree of spatial heterogeneity within the tumor.Figure 2 displays Bland Altman plots for all the parameters across all the animals. There are no obvious systemic biases in the measurements. Wilcoxon signed rank tests between test and retest scans were nonsignificant for any pair of parameters: p(ADC) = 1, p(TOLD-derived ΔT1,) = 0.81, p(T1) = 0.63, p(Ktrans) = 0.13, p(ve) = 0.31.
We report the average and standard deviation of parameter values within clusters on test data (Figure 3A) and retest data (Figure 3B). The clusters are visualized for all the rats in Figure 4. Three distinct regions are identified using this multiparametric dataset. The clusters were distributed similarly between test and retest scans.
Discussion and Conclusion
We are working to establish a repeatable quantitative and multiparametric MRI protocol for assessing tumor heterogeneity. Our image-derived quantification of hypoxia, cellularity, and perfusion can capture tumor heterogeneity at the ROI level. The distribution for each parameter is visually similar, as seen in this data. A majority of the trend between the average parameters of the clusters is also retained between the two scan sessions. Ongoing studies include adding additional animals to strengthen the results and, ultimately, using this data to a inform biology-based mathematical models6 to predict the growth and response of glioma to radiotherapy.Acknowledgements
NIH T32EB007507, 1R01CA260003, CPRIT RP220225References
[1] Ostrom, Q. T.; Gittleman, H.; Farah, P.; Ondracek, A.; Chen, Y.; Wolinsky, Y.; Stroup, N. E.; Kruchko, C.; Barnholtz-Sloan, J. S. CBTRUS statistical report: Primary brain and central nervous system tumors diagnosed in the United States in 2006-2010. Neuro Oncol 2013, 15 Suppl 2 (Suppl 2), ii1-56. [2] Sorace AG, Wu C, Barnes SL, Jarrett AM, Avery S, Patt D, Goodgame B, Luci JJ, Kang H, Abramson RG, Yankeelov TE, Virostko J. Repeatability, reproducibility, and accuracy of quantitative mri of the breast in the community radiology setting. J Magn Reson Imaging. 2018 Mar 23 [3] Hallac RR, Zhou H, Pidikiti R, Song K, Stojadinovic S, Zhao D, Solberg T, Peschke P, Mason RP. Correlations of noninvasive BOLD and TOLD MRI with pO2 and relevance to tumor radiation response. Magn Reson Med. 2014 May;71(5):1863-73. doi: 10.1002/mrm.24846. Epub 2013 Jun 27. PMID: 23813468; PMCID: PMC3883977.[4] Yankeelov, T. E.; Cron, G. O.; Addison, C. L.; Wallace, J. C.; Wilkins, R. C.; Pappas, B. A.; Santyr, G. E.; Gore, J. C. Comparison of a reference region model with direct measurement of an AIF in the analysis of DCE-MRI data. Magn Reson Med 2007, 57 (2), 353-361. [5] Slavkova KP, Patel SH, Cacini Z, Kazerouni AS, Gardner AL, Yankeelov TE, Hormuth DA 2nd. Mathematical modelling of the dynamics of image-informed tumor habitats in a murine model of glioma. Sci Rep. 2023 Feb 20;13(1):2916. doi: 10.1038/s41598-023-30010-6. Erratum in: Sci Rep. 2023 May 22;13(1):8279. PMID: 36804605; PMCID: PMC9941120. [6] Hormuth DA 2nd, Jarrett AM, Yankeelov TE. Forecasting tumor and vasculature response dynamics to radiation therapy via image based mathematical modeling. Radiat Oncol. 2020 Jan 2;15(1):4.Figures
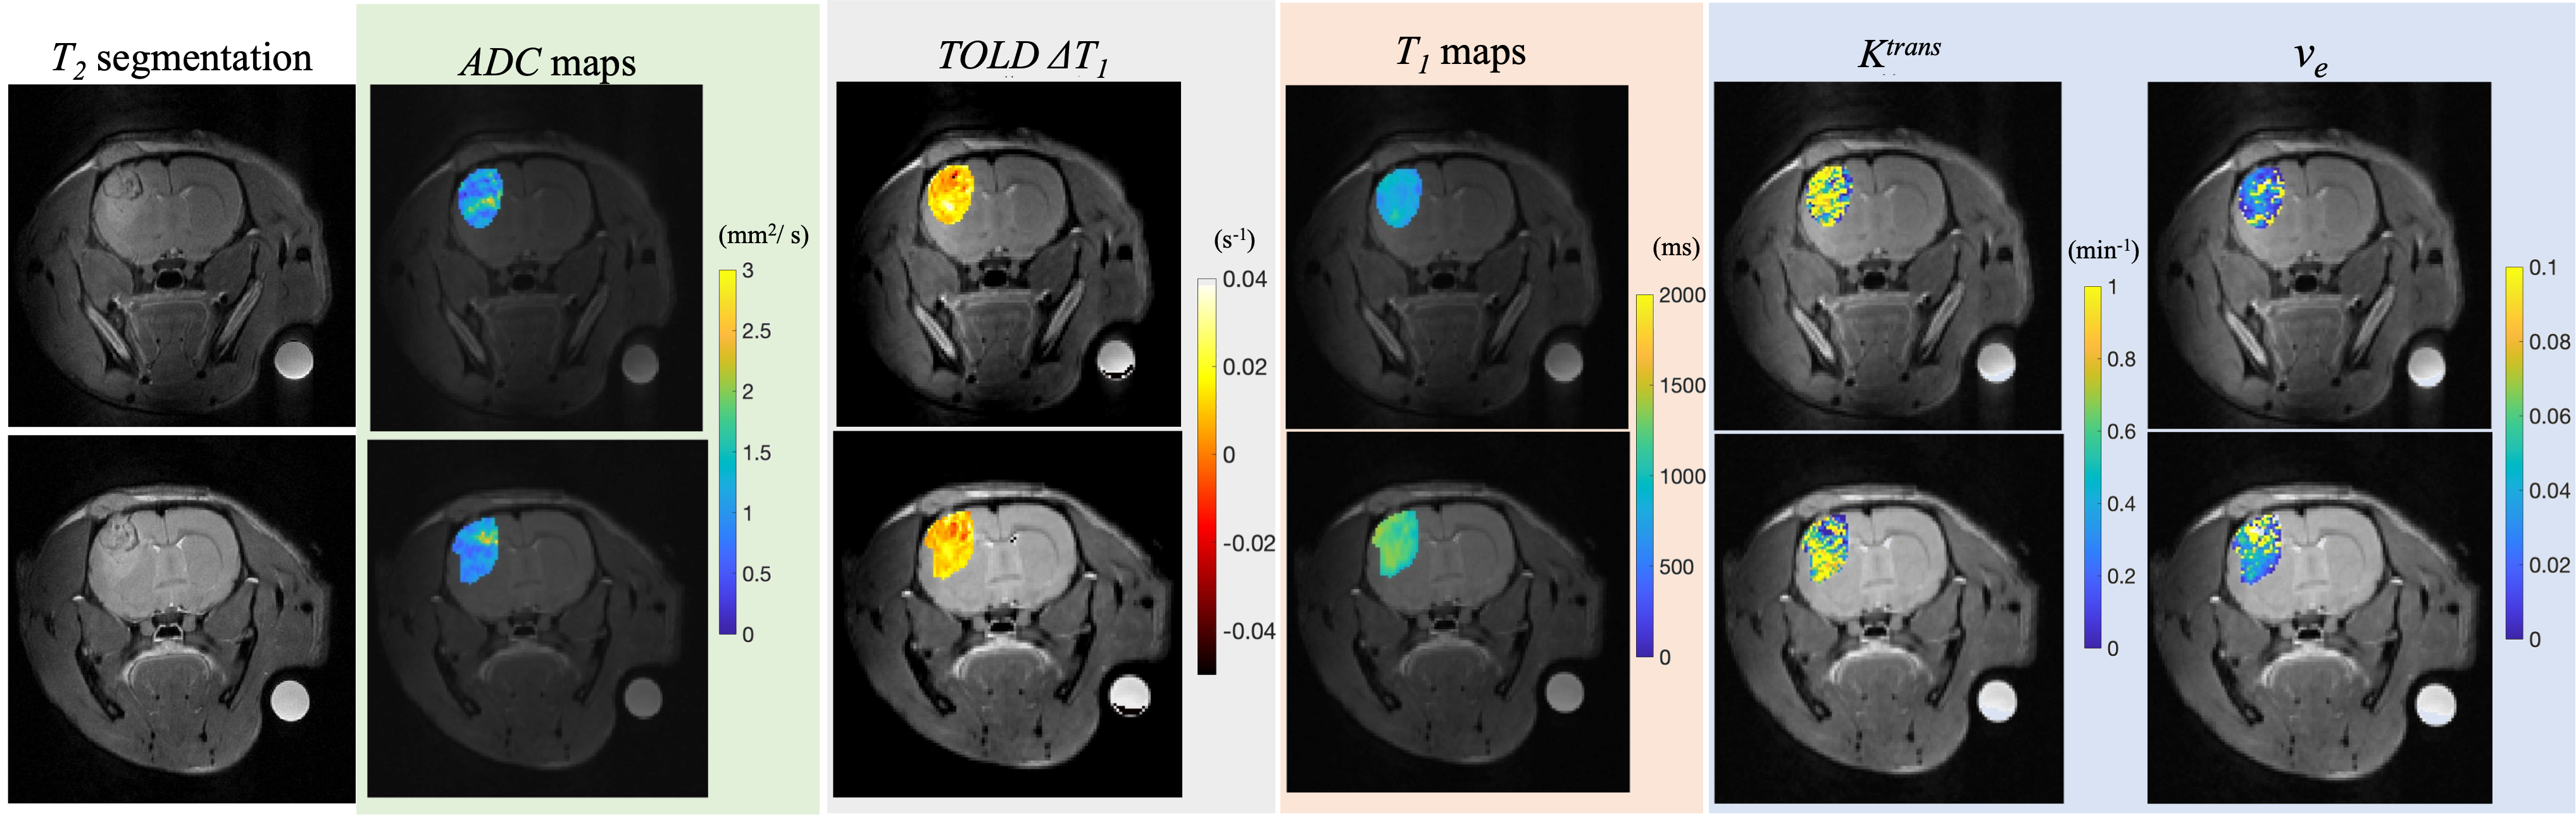
Figure 1. The parameter maps are grouped by the corresponding scan in the scan order. The top row are images collected from the test protocol, while the bottom row is collected from the retest protocol. Observe how most of the distributions for the parameters are visually similar between the scans; the Tables and Figures below quantify the degree to which this comment is true.
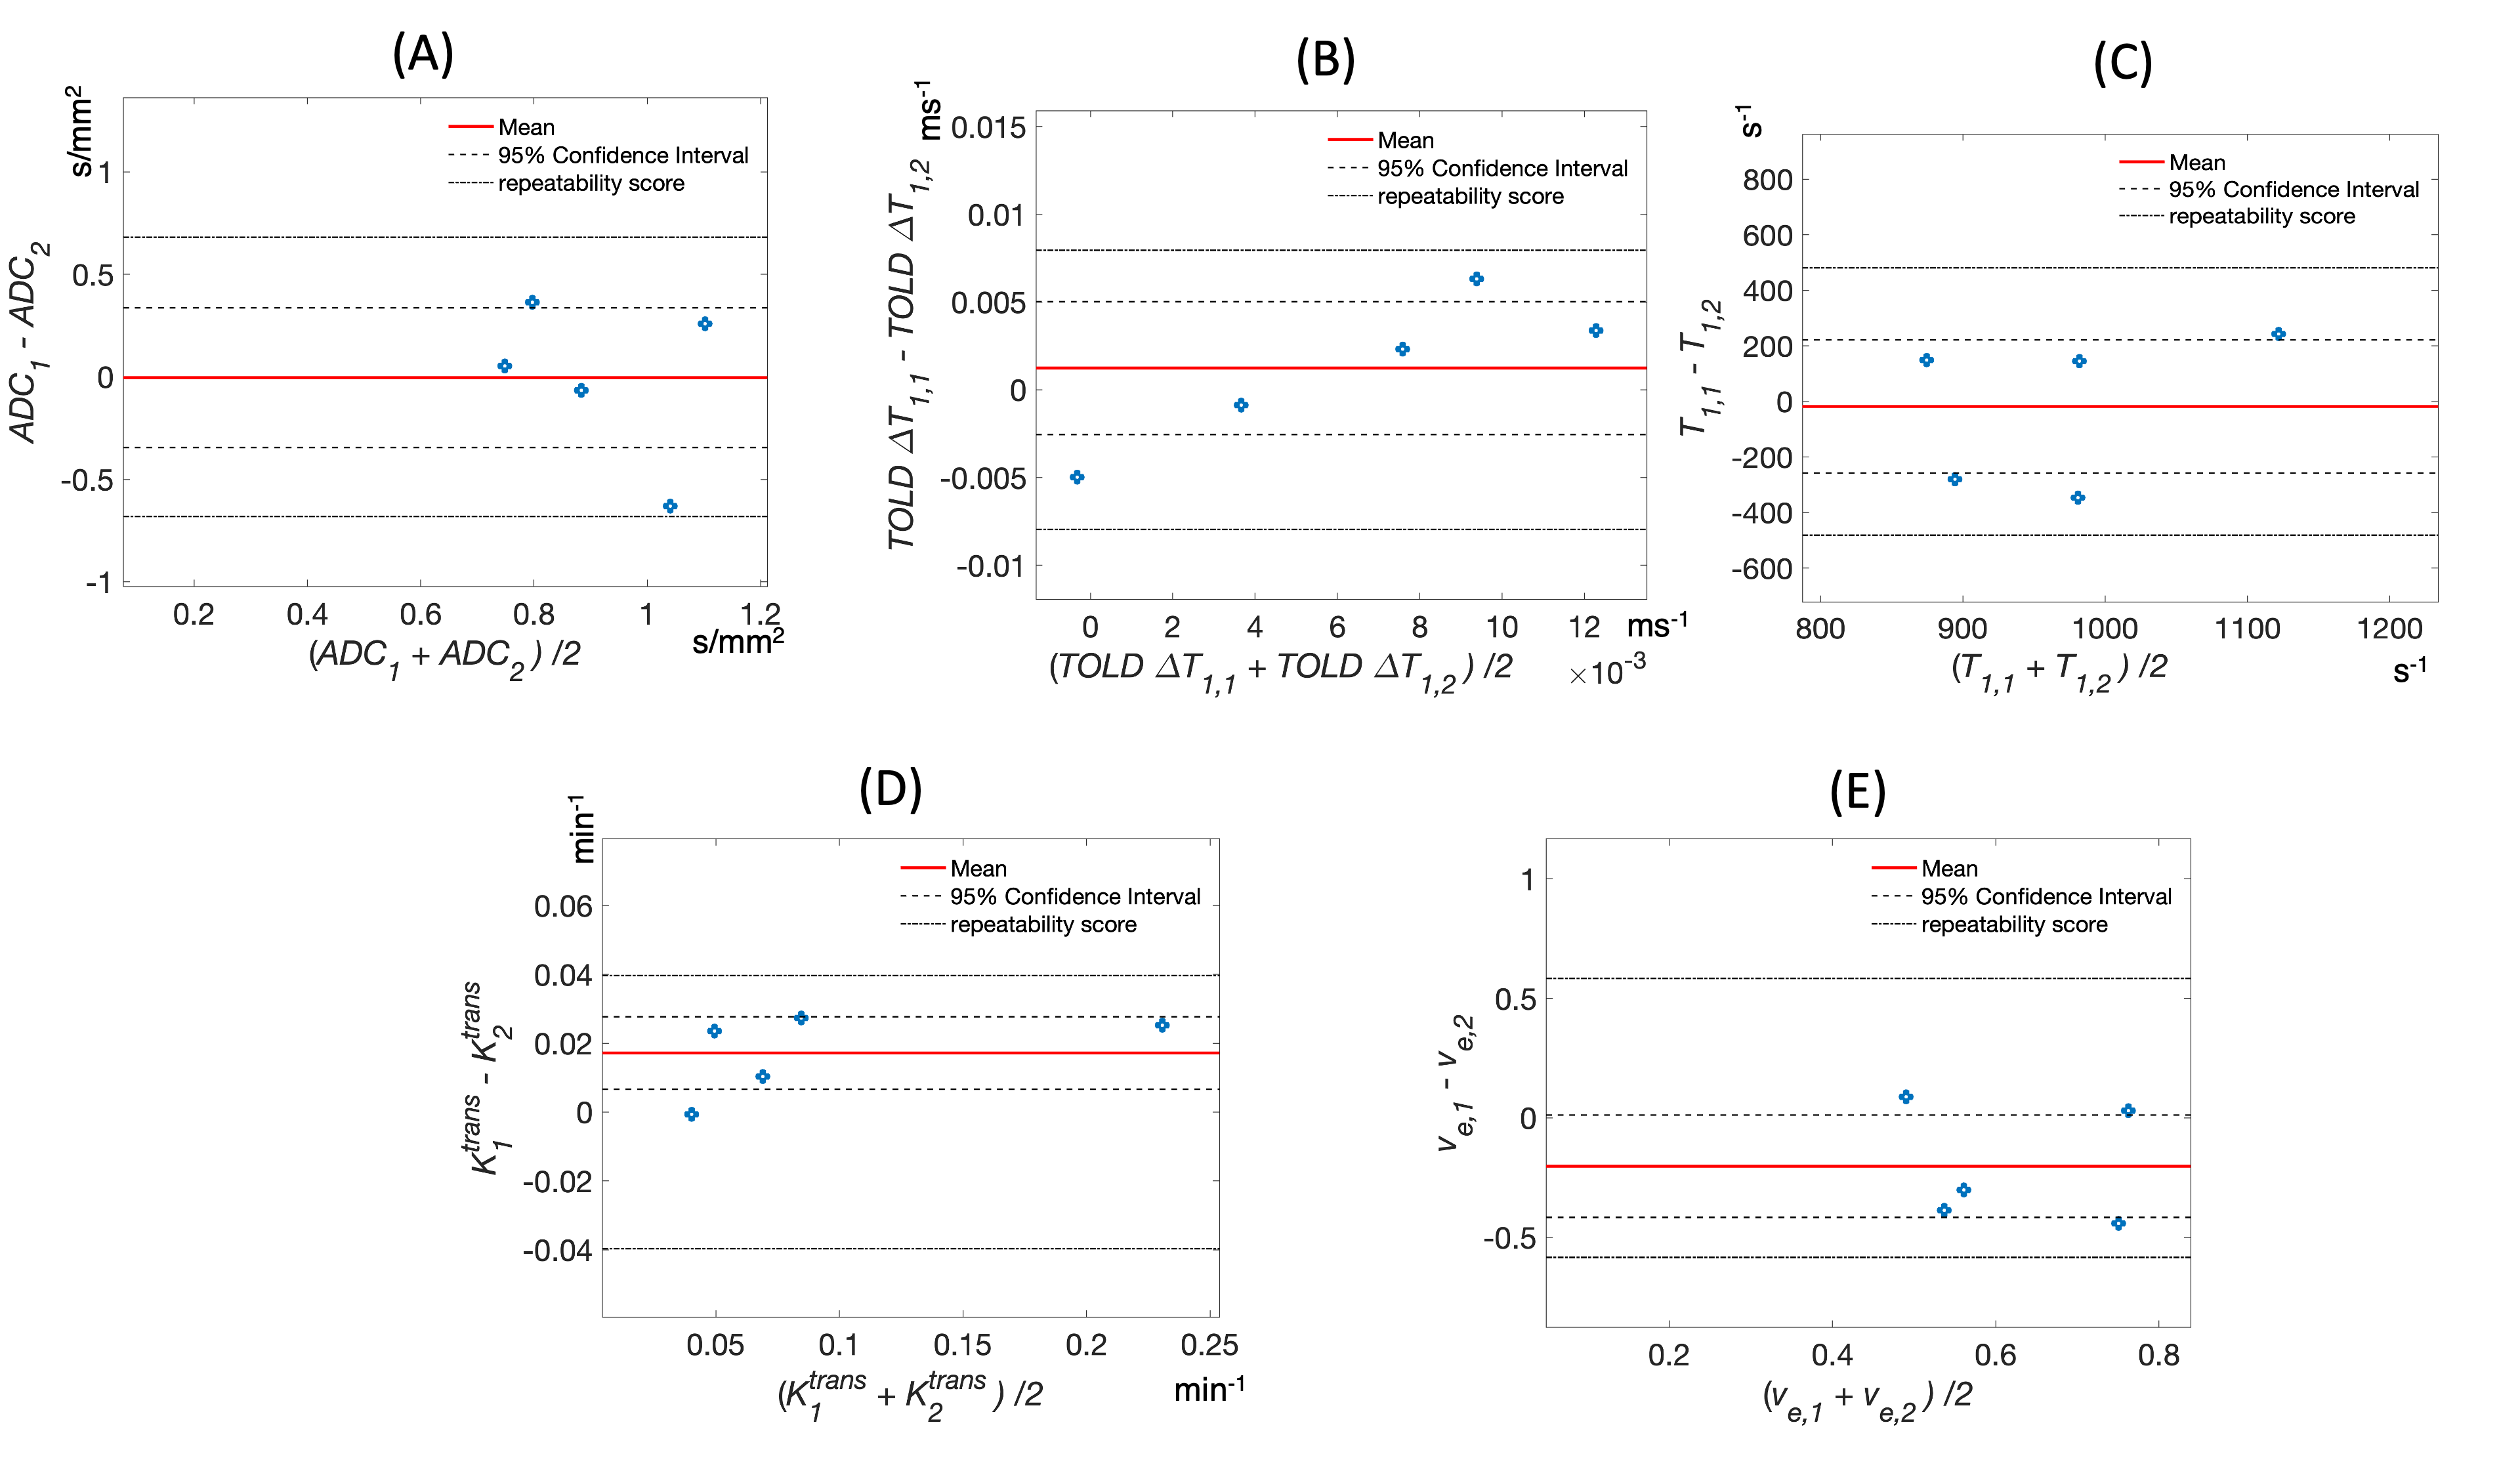
Figure 2. Bland Altman plots for all the parameters: (A) ADC, (B) TOLD-derived ΔT1, (C) T1 value from the T1 map, (D) Ktrans, and (E) ve. The mean difference is highlighted by a red line. The 95% confidence intervals are outlined by dashed black lines. The repeatability coefficient is indicated by the dash-dotted black line. All the collected parameters fell within the range of the repeatability coefficients indicating all values are within the range of the expected measurement variability.

Figure 3. Average parameter values (standard deviations) within clusters on test scan data (Figure 3A) and retest scan data (Figure 3B) as well as the cluster distribution (%) for all animals.
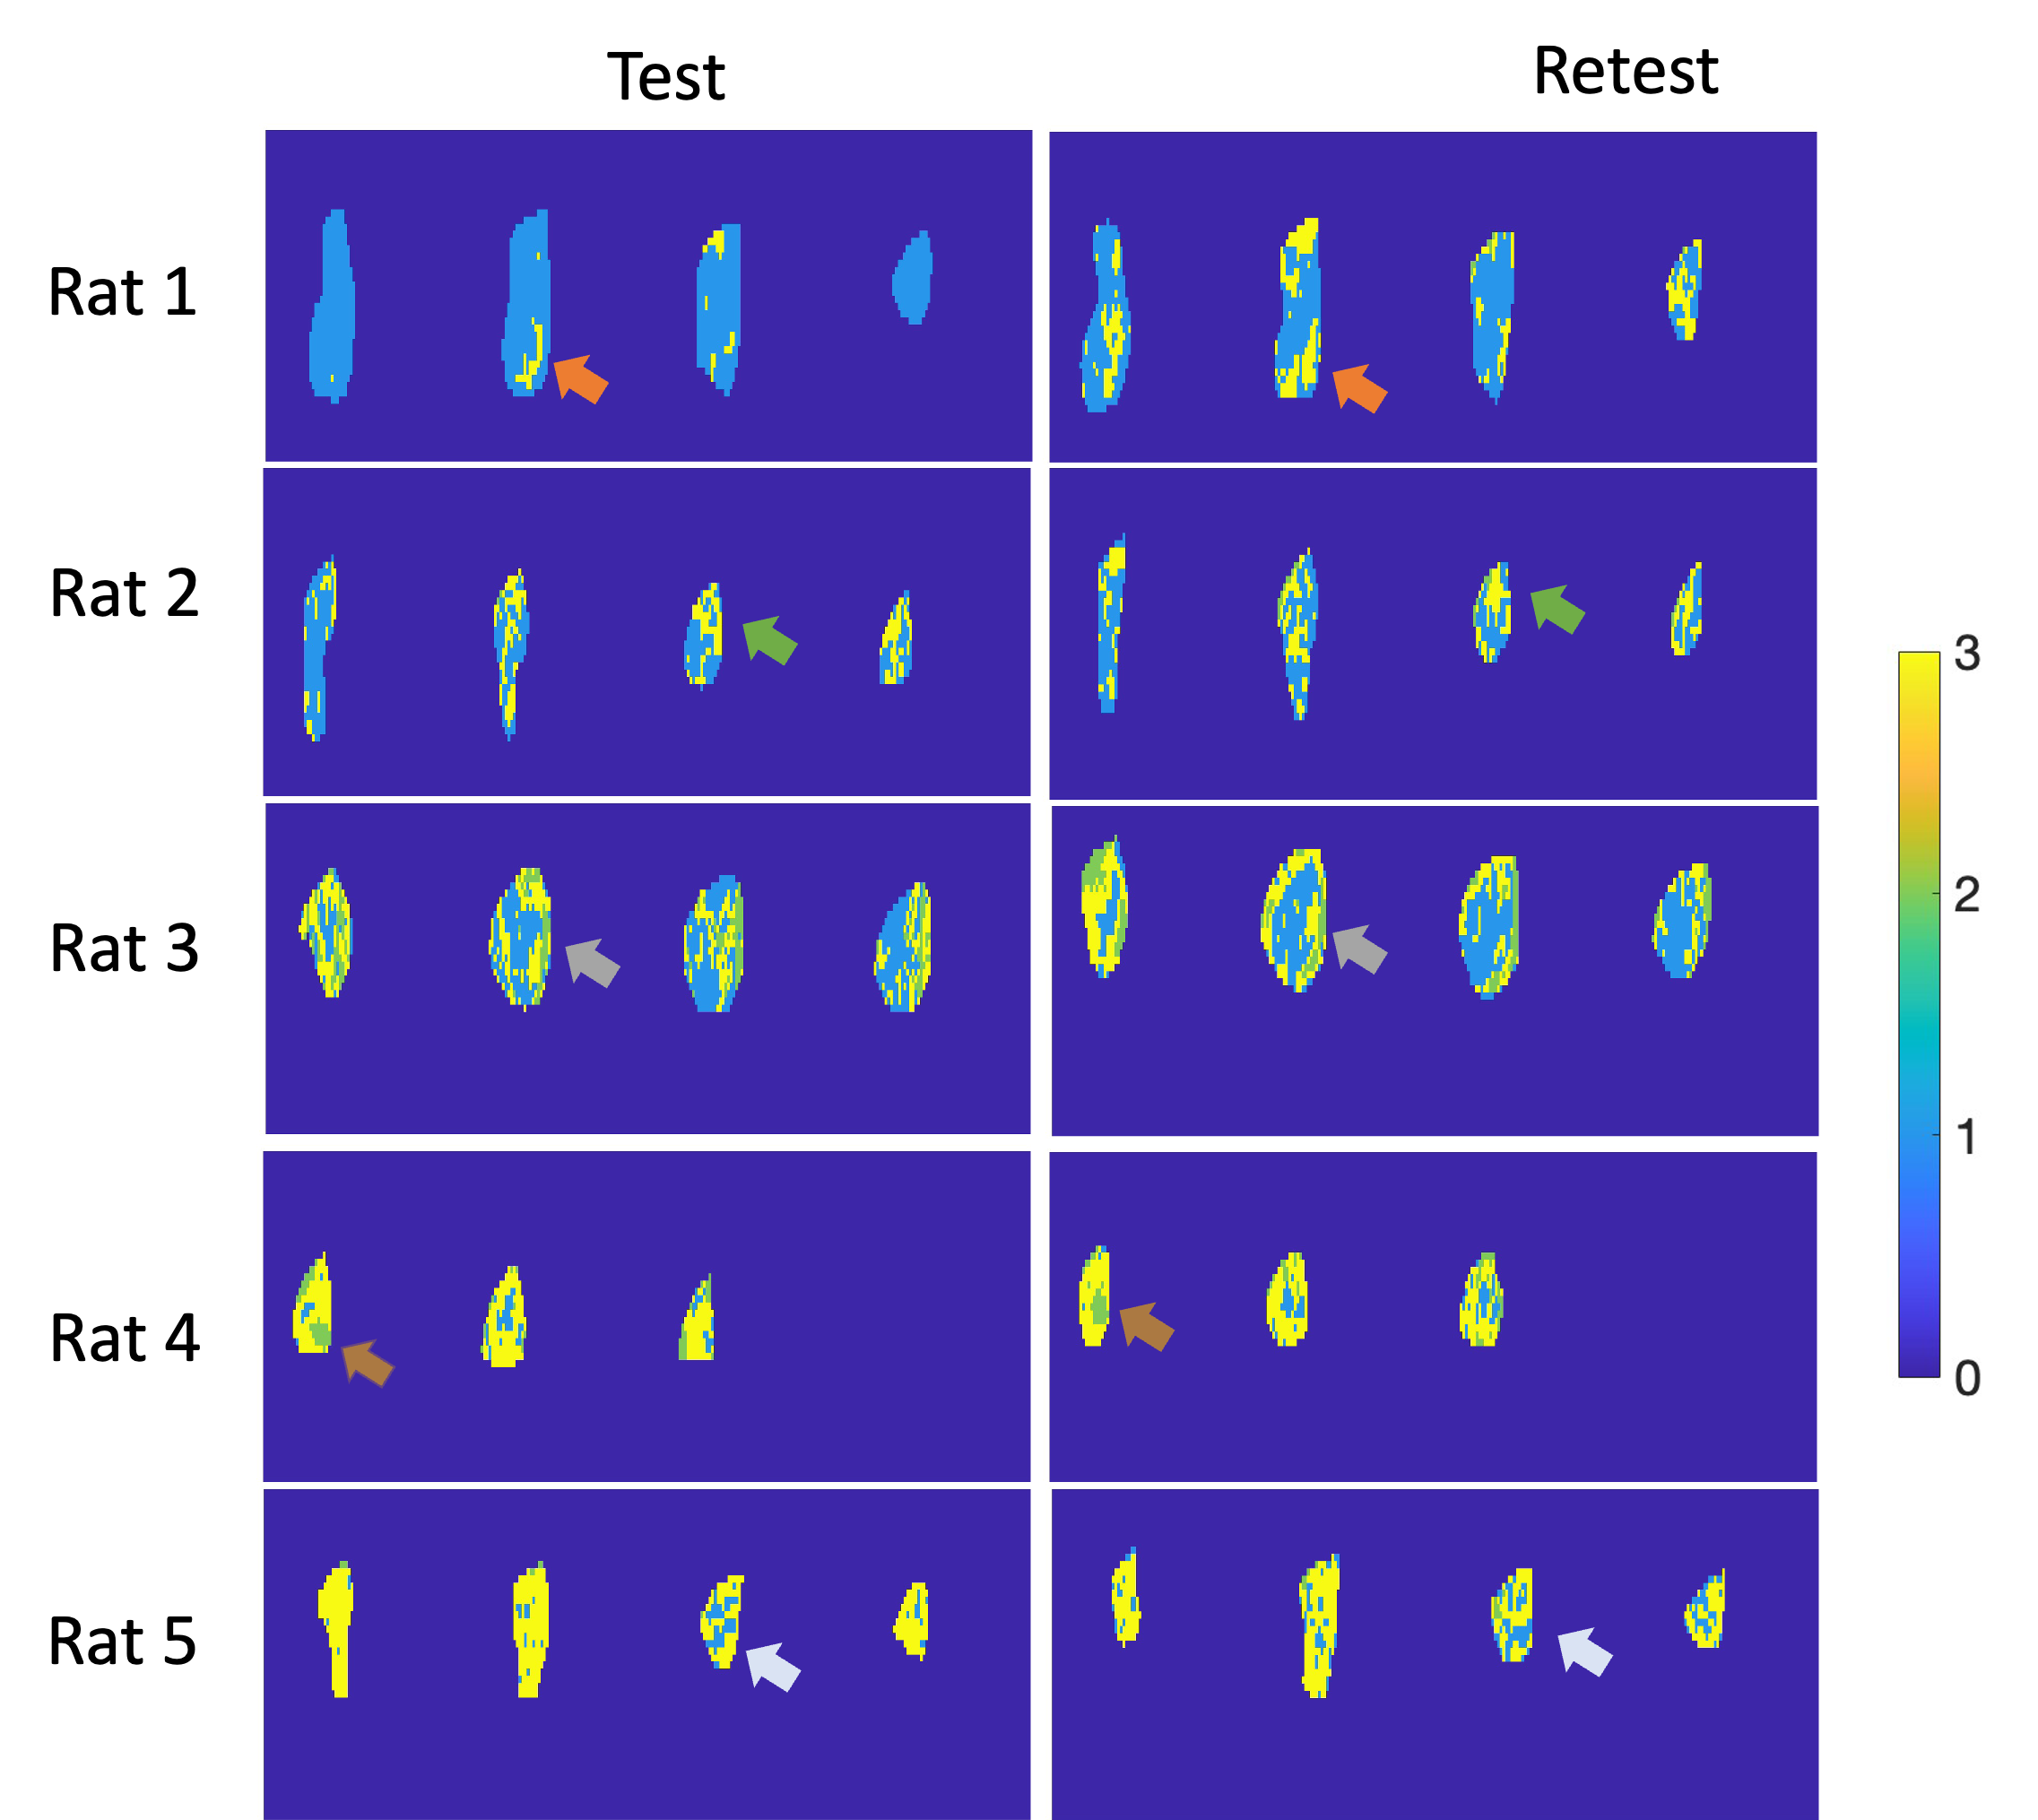
Figure 4. K-means clustering applied the MRI parameters (i.e., ADC, TOLD-derived ΔT1, T1, Ktrans, and ve). The left column is from the test scan data, while the right column is from the retest scan data. Three distinct habitats are constructed from the multiparametric dataset. Observe how the spatial locations of the clusters are similar between the test and retest scans as visualized by the arrows on the panels. The distribution of the clusters is also expressed in similar amounts between test scans and retest scans.