4528
Tumor-induced metabolic reprogramming and CD8+ T-cell exhaustion of the spleen1Division of Cancer Imaging Research, The Russell H. Morgan Department of Radiology and Radiological Science, Baltimore, MD, United States, 2Sidney Kimmel Comprehensive Cancer Center, Baltimore, MD, United States, 3Bloomberg-Kimmel Institute of Immunotherapy, Baltimore, MD, United States, 4Department of Radiation Oncology and Molecular Radiation Sciences, Baltimore, MD, United States
Synopsis
Keywords: Probes & Targets, Tumor, Spleen
Motivation: Metastasis is the leading cause of cancer-related mortality worldwide. We must pave new avenues for cancer treatment by interrogating the pro-tumorigenic properties of the tumor macroenvironment.
Goal(s): We seek to investigate how tumorigenesis metabolically impacts the spleen microenvironment and how it contributes to immune evasion.
Approach: Proton magnetic resonance spectroscopy was used to identify aqueous spleen metabolites during tumorigenesis. Flow cytometric analyses were conducted to immunophenotype splenic CD8+ T cells and to quantify MDSC and T-cell frequencies.
Results: Tumorigenesis induced common, distinct metabolite changes in mouse spleens. Flow cytometric analyses revealed splenic CD8-T-cell exhaustion and reduced cytotoxic T-cell effector function.
Impact: Tumors drive metabolic spleen alterations that may contribute to reduced CD8+ T cells and their exhaustion even before reaching the tumor, contributing to immune suppression and poor prognosis. This may provide metabolism-targeted strategies to improve immune surveillance and immunotherapy.
Introduction
The immune system is a potent force that can be exploited to eliminate cancer cells, yet most cancers escape immune surveillance. The spleen is a major reservoir of T cells [1]. Our purpose here was to investigate the impact of tumor growth on spleen metabolism and the associated changes in immune cells and immune cell exhaustion. During tumor progression, the spleen undergoes aberrant myelopoiesis to establish a reservoir of hematopoietic and stromal cells that drive tumor immune evasion, cancer progression and metastasis [2-3]. We used high-resolution 1H magnetic resonance spectroscopy (MRS) to evaluate how tumorigenesis impacts spleen metabolism in syngeneic mouse models. Next, using flow cytometric analysis, we investigated changes in splenic myeloid derived suppressor cells (MDSCs) and both splenic CD4+ and CD8+ T-cell percentages compared to non-tumor-bearing mice. Subsequently, we used immunophenotyping to identify T-cell exhaustion in splenic CD8+ T cells from 4T1-tumor bearing mice. Interrogating metabolic patterns in organs that support tumorigenesis may uncover pathways towards metabolic intervention as cancer treatments.Methods
Female BALB/c and C57BL/6 mice were respectively inoculated orthotopically with 4T1 (mammary carcinoma) and E0771 (mammary carcinoma) cells. Panc02 (pancreatic adenocarcinoma) cells were inoculated subcutaneously on the flank of male C57BL/6 mice. Uninoculated mice of each strain were designated as non-tumor-bearing controls (BALB/c-Ctrl or C57BL/6-Ctrl). Once tumor xenografts developed to target volume, Ctrl and tumor-bearing mice were euthanized. Upon euthanization, the spleens were freeze clamped and cryopulverized in liquid nitrogen. Dual-phase extraction of spleens was conducted using methanol, chloroform and water. 1H MRS of aqueous extracts from spleen samples was performed with a Bruker Avance III 750 MHz (17.6T) MR spectrometer to identify water-soluble metabolites. Data acquisition was performed using a 5 mm inverse triple-resonance (TXI) probe. Topspin 3.5 software was used for data processing, analysis and quantification. In flow cytometry experiments, tumor-bearing mice of each model were euthanized at target volume along with non-tumor-bearing Ctrl to determine live splenic MDSC and (CD4+ and CD8+) T cell frequencies. We conducted flow cytometry using the FACS Calibur and Cytek Aurora cytometers to identify positive events of multi-stained spleen samples. Additionally, splenic CD8+ T cells from 4T1-tumor bearing mice were immunophenotyped for various markers of T-cell exhaustion using the Attune NxT Flow cytometer.Results
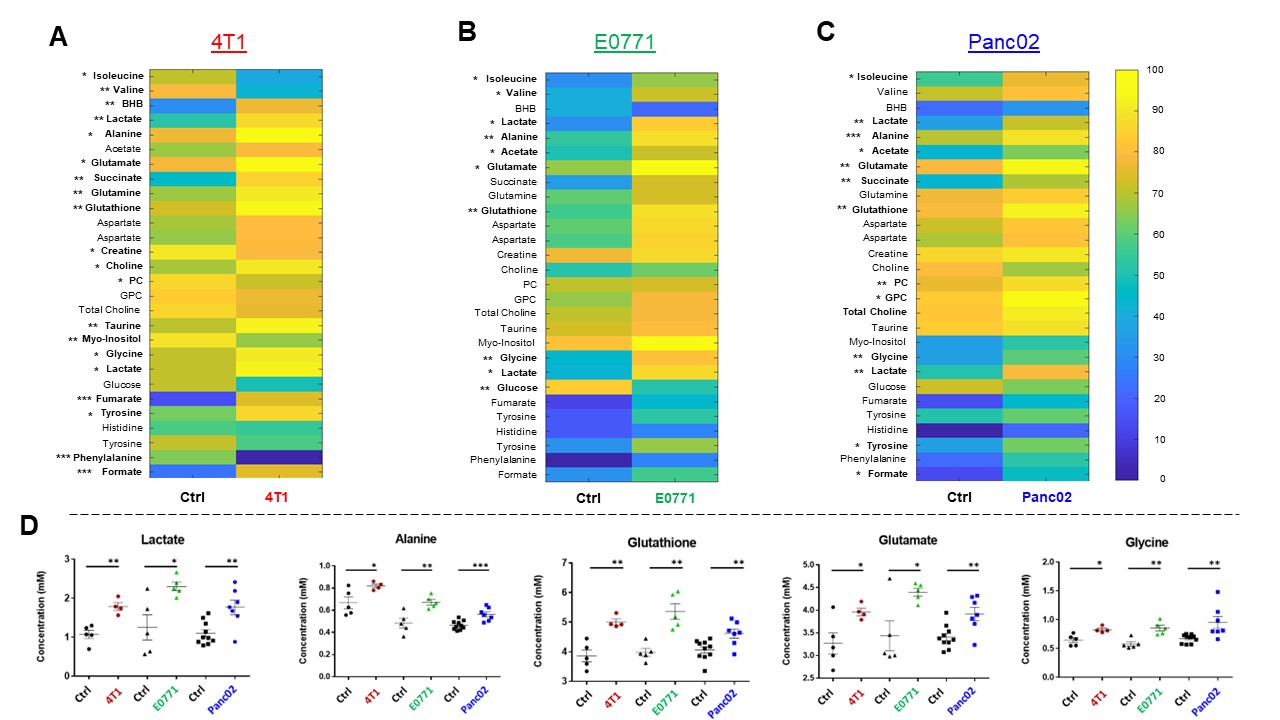
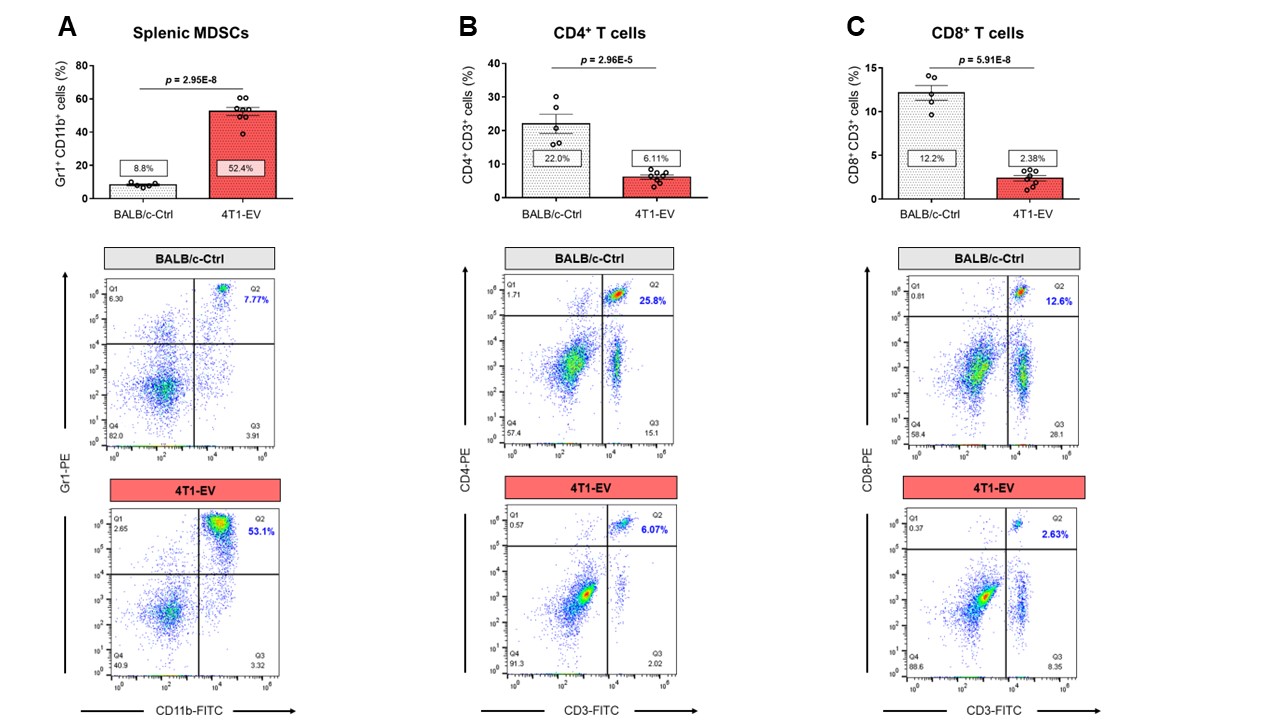
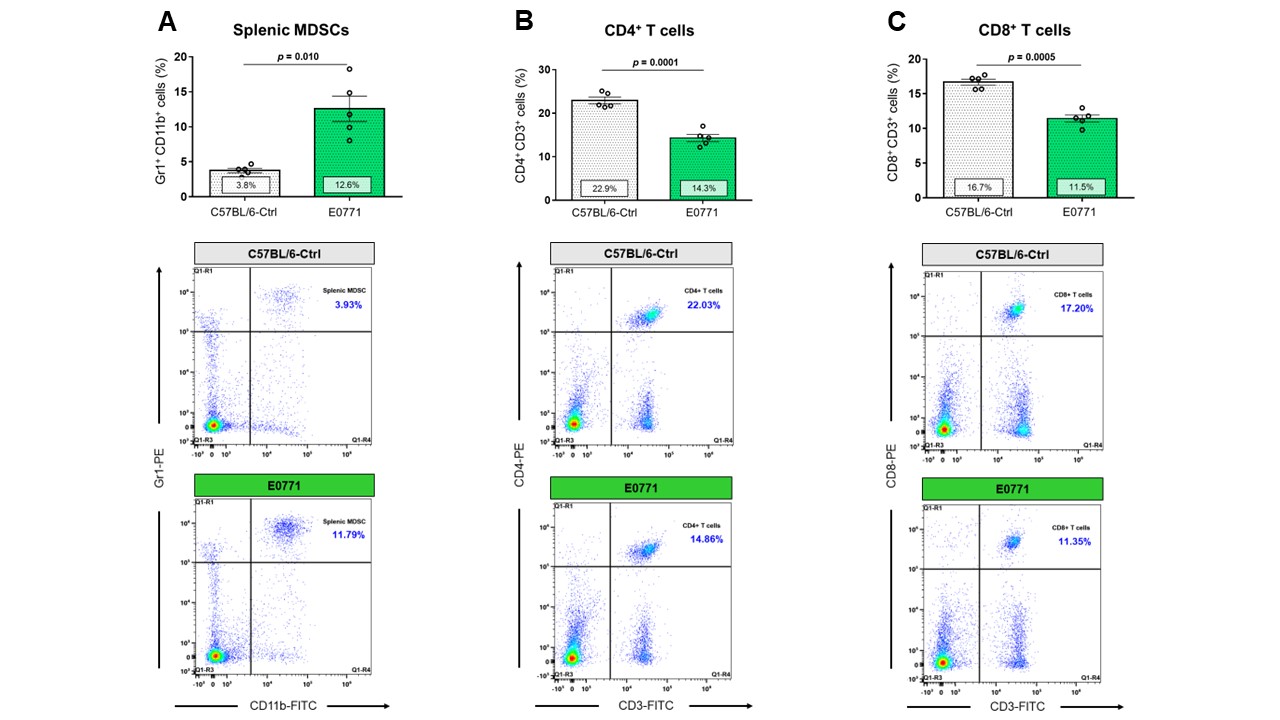
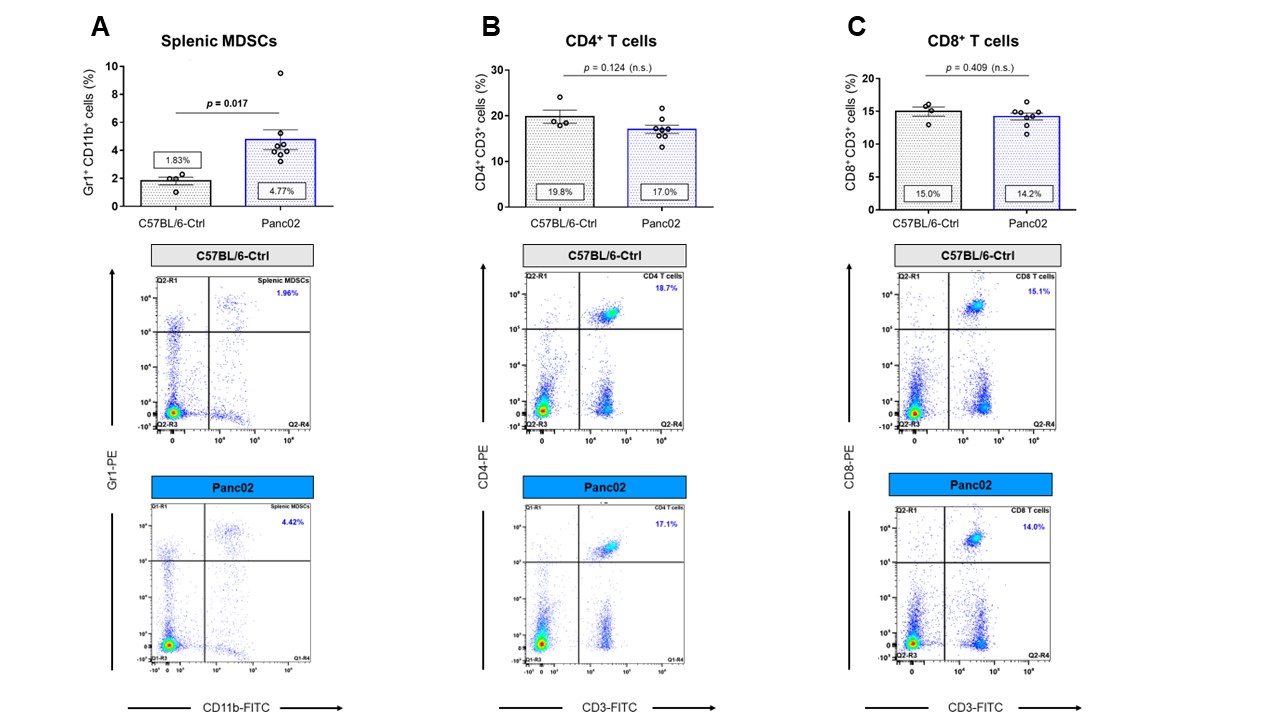
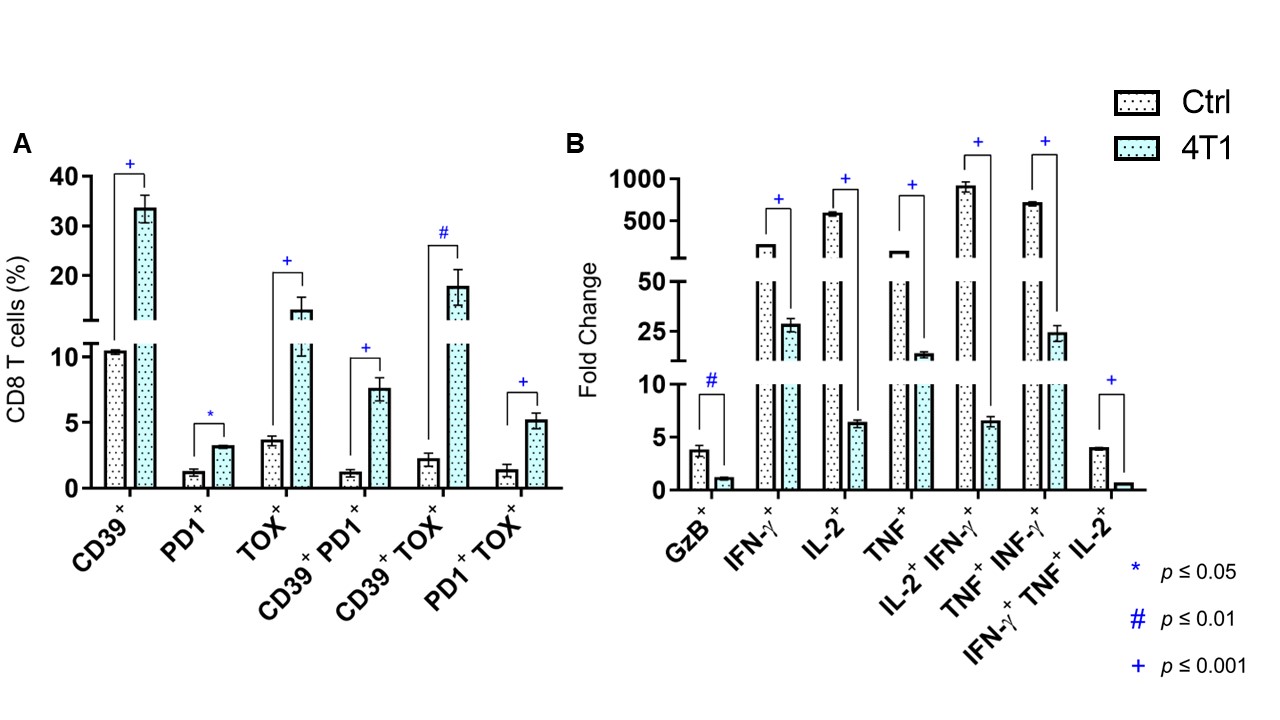
Data summarized in Figure 1 show the various spleen metabolites altered in non-tumor-bearing (Ctrl) mice compared to (A) 4T1 (n=4), (B) E0771 (n=5) and (C) Panc02-tumor-bearing mice (n=7) with (D) common metabolite changes observed among these mouse strains. Metabolite concentrations were calculated using the internal reference sodium trimethylsilyl propionate (TSP), and all metabolite concentrations were normalized to spleen sample weight. Values represent ± SEM. Summarized flow data in Figure 2 illustrate a significant increase in (A) splenic MDSC frequency and a reduction in (B) CD4+ and (C) CD8+ T-cell frequencies in 4T1-EV-tumor-bearing mice (n=8) compared to BALB/c-Ctrl (n=5). Figure 3 illustrates a significant increase in (A) splenic MDSC frequency with a reduction in (B) CD4+ and (C) CD8+ splenic T-cell frequencies in E0771-tumor-bearing mice (n=5) compared to C57BL/6-Ctrl (n=5). Flow cytometric data in Figure 4 show the changes in (A) splenic MDSCs, (B) splenic CD4+ and (C) CD8+ T cells from Panc02-tumor-bearing mice (n=8) compared to C57BL/6-Ctrl (n=4). Two-tailed Student’s t test. *p ≤ 0.05, **p ≤ 0.01, ***p ≤ 0.001 compared to tumor-bearing mice. Figure 5 illustrates (A) marked increase in T-cell exhaustion surface marker expression and intracellular TOX expression of CD8+ splenic T cells isolated from 4T1-tumor-bearing mice. Figure 5 (B) demonstrates a significant reduction in the fold change of percent cytokine-positive splenic CD8+ T cells from 4T1-tumor-bearing mice (n=4) after stimulation (with Brefeldin A, ionomycin and PMA) compared to Ctrl (n=3).Discussion
Orthotopic 4T1 and E0771 tumors induced significant splenomegaly (data not shown), which may have contributed to the marked change in splenic MDSC and T cell frequencies we observed. Distinct spleen metabolite changes were observed in each tumor group compared to the Ctrl mice of corresponding strain. Increases in lactate, alanine, glutamate, glutathione and glycine were common across all groups of tumor-bearing mice compared to Ctrl. A significant decrease in splenic CD8+ T cells was observed among two of the three tumor groups with a significant increase in immunosuppressive splenic MDSCs among all groups. Splenic CD8+ T cells from 4T1-tumor-bearing mice demonstrated an exhausted phenotype with elevated expression of markers that indicate chronic antigen exposure. These splenic metabolic changes and the CD8-T-cell exhaustion phenotype may contribute to immune suppression and to poor prognosis. Our findings can be used to develop spleen-based metabolic strategies coupled with frontline treatments to improve immune surveillance of cancers.Acknowledgements
Supported by NIH R35CA209960.References
- Bronte V et al., Immunity. 2013;39(5).
- Caswell D. BMC Med. 20173.
- Steenbrugge J et al., Cancer Research. 2021;81(1)
Figures