4524
Using ResNet to utilize 4-class T2-FLAIR slice classification based on the cholinergic pathways hyperintensities scale for pathological aging1Department of Computer Science and Engineering, Yuan Ze University, Taoyuan City, Taiwan, 2Department of Neurology, Cardinal Tien Hospital, New Taipei City, Taiwan, 3Department of Neurology, Far Eastern Memorial Hospital, New Taipei City, Taiwan, 4Graduate Institute of Medicine, Yuan Ze University, Taoyuan City, Taiwan, 5Department of Medical Research, Far Eastern Memorial Hospital, New Taipei City, Taiwan, 6Department of Psychiatry, Far Eastern Memorial Hospital, New Taipei City, Taiwan, 7Institute of Public Health, National Yang Ming Chiao Tung University, Taipei, Taiwan
Synopsis
Keywords: Analysis/Processing, Machine Learning/Artificial Intelligence, T2-FLAIR, white matter hyperintensity, dementia, cholinergic pathway
Motivation: Cholinergic Pathways Hyperintensities Scale (CHIPS) is a visual rating scale to evaluate the burden of cholinergic white matter hyperintensities in T2-FLAIR image, indicating the severity of dementia. However, it is still time-consuming to screen slices throughout the whole brain to choose 4 specific slices for rating.
Goal(s): To develop a deep-learning-based model to automatically select 4 slices specific to CHIPS.
Approach: We used ADNI T2-FLAIR dataset (N=150) to train a 4-class slice classification model (BSCA) utilized by ResNet, and a local dataset (N=30) to test its performance.
Results: Our model achieved the accuracy of 99.82% and F1-score of 99.83%.
Impact: BSCA can be an automatic screening tool to efficiently provide 4 specific T2-FLAIR slices covering the white matter landmarks along the cholinergic pathways for clinicians to help evaluate whether patients have the high risk to develop clinical dementia.
Introduction
T2-weighted fluid-attenuated-inversion-recovery (T2-FLAIR) magnetic resonance Imaging (MRI) is clinically used to detect and visualize white matter hyperintensities (WMH) as brain lesions and utilized in routine clinical practice. Normally, clinicians will review T2-FLAIR axial slices throughout the whole brain, and then visually rate the Fazekas scale score [1] to provide an overall impression of WHM burden. However, the Fazekas scale lacks the specificity to evaluate the severity of functional declines in dementia, and limits it clinical utility. The recent study done by our team adopted another visual rating scale as known as the Cholinergic Pathways Hyperintensities Scale (CHIPS)[2], which is specific to the severity of WMH burden in the cholinergic pathway associated with the Clinical Dementia Rating scale Sum of Boxes (CDR-SB), reflecting clinical dementia severity in APOE e4 carriers [3]. It implies that CHIPS might have higher diagnostic value than Fazekas scale. CHIPS evaluation is based on only four slices, separately covering (1) low external capsule, (2) higher external capsule and anterior cingulate gyrus, (3) corona radiata and posterior cingulate gyrus, and (4) centrum semiovale, facilitating diagnostic efficiency and specificity. However, it still requires experienced clinicians to visually recognize and classify these four slices. Therefore, the present study aimed to develop an automatic slice selection model to assist in classifying the aforementioned four axial slices in T2-FLAIR images to provide a quicker clinical screening for APOE e4 carriers with clinical dementia.Methods and Materials
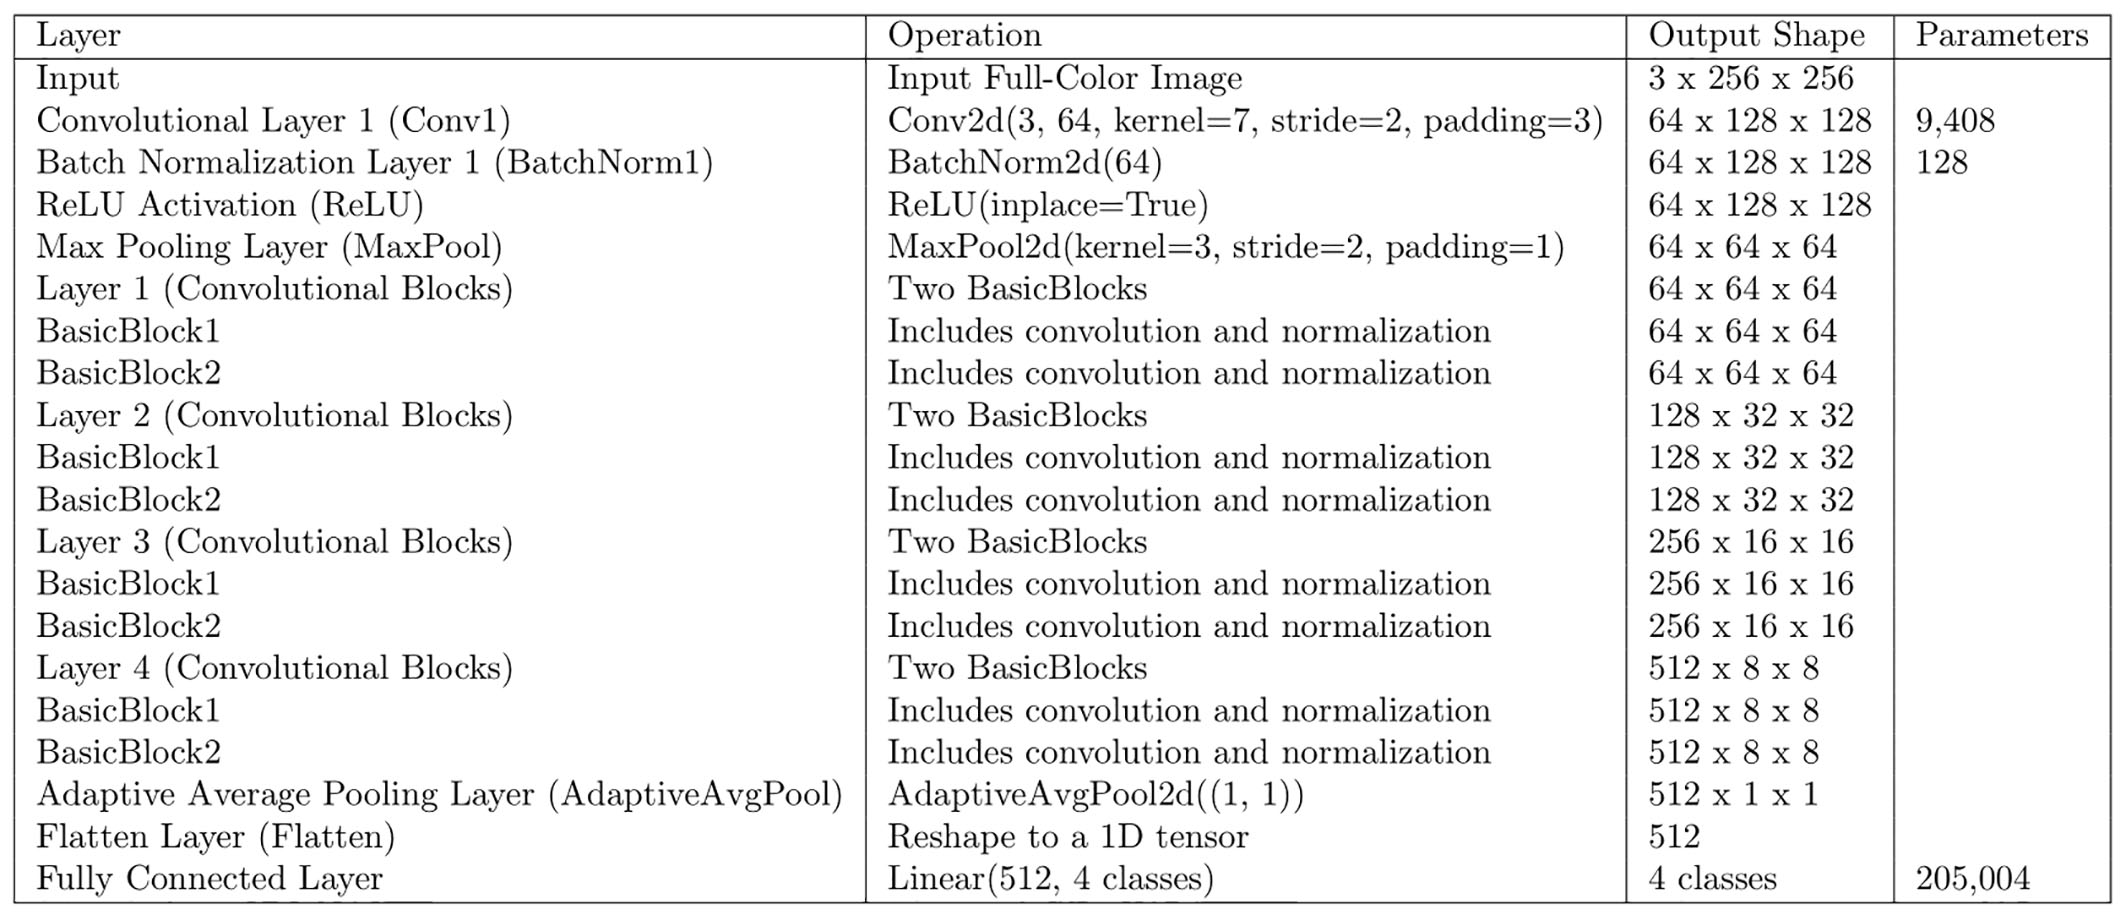
Here we introduced a Brain Slice Classification Algorithm (BSCA) which was built up based on a convolutional neural network, specifically utilized by the residual network (ResNet)[4]. This approach enables a deep-learning scheme to automatically choose specific brain MRI slices without additional image annotations. Figure 1 illustrates the whole BSCA architecture. Multi-center T2-FLAIR datasets were obtained from two sources: Alzheimer’s Disease Neuroimaging Initiative (ADNI) (with the following acquisition parameters using 3T MRI scanners across vendors: TR/TE/TI=9000-11000/90-154/2250-2500 ms, pixel spacing=0.8594 mm, slice thickness=5 mm) [5] and Taiwan Precision Medicine Initiative in Cognition (TPMIC, with the following acquisition parameters using two 3T MRI scanners [Skyra, Siemens, Erlangen, Germany]: TR/TE/TI=8000/85/2370 ms, pixel spacing=0.6875 mm, slice thickness=6.5 mm) contributed by two local hospitals. T2-FLAIR data (N=150) of ADNI dataset [3] comprising of patients with early/late stages mild cognitive impairment (MCI) and Alzherimer’s dementia (AD) were used as a training dataset, whereas those of TPMIC dataset of MCI and AD (N=30) were used as a testing dataset. BSCA was trained in eight-fold cross-validation based on the slice-level data splitting (4504 slices in total) to classify 4 different slices specific to CHIPS evaluation. The performance of BSCA was assessed using the metrices of accuracy, loss, precision, recall, and F1-score. We adopted Adam as an optimizer to minimize the loss function based on cross-entropy. Note that the specific 4 slices in the training data were labeled by a well-trained graduate student (W.C. Tsai) trained by an experienced neurologist (M.C. Yu).Results
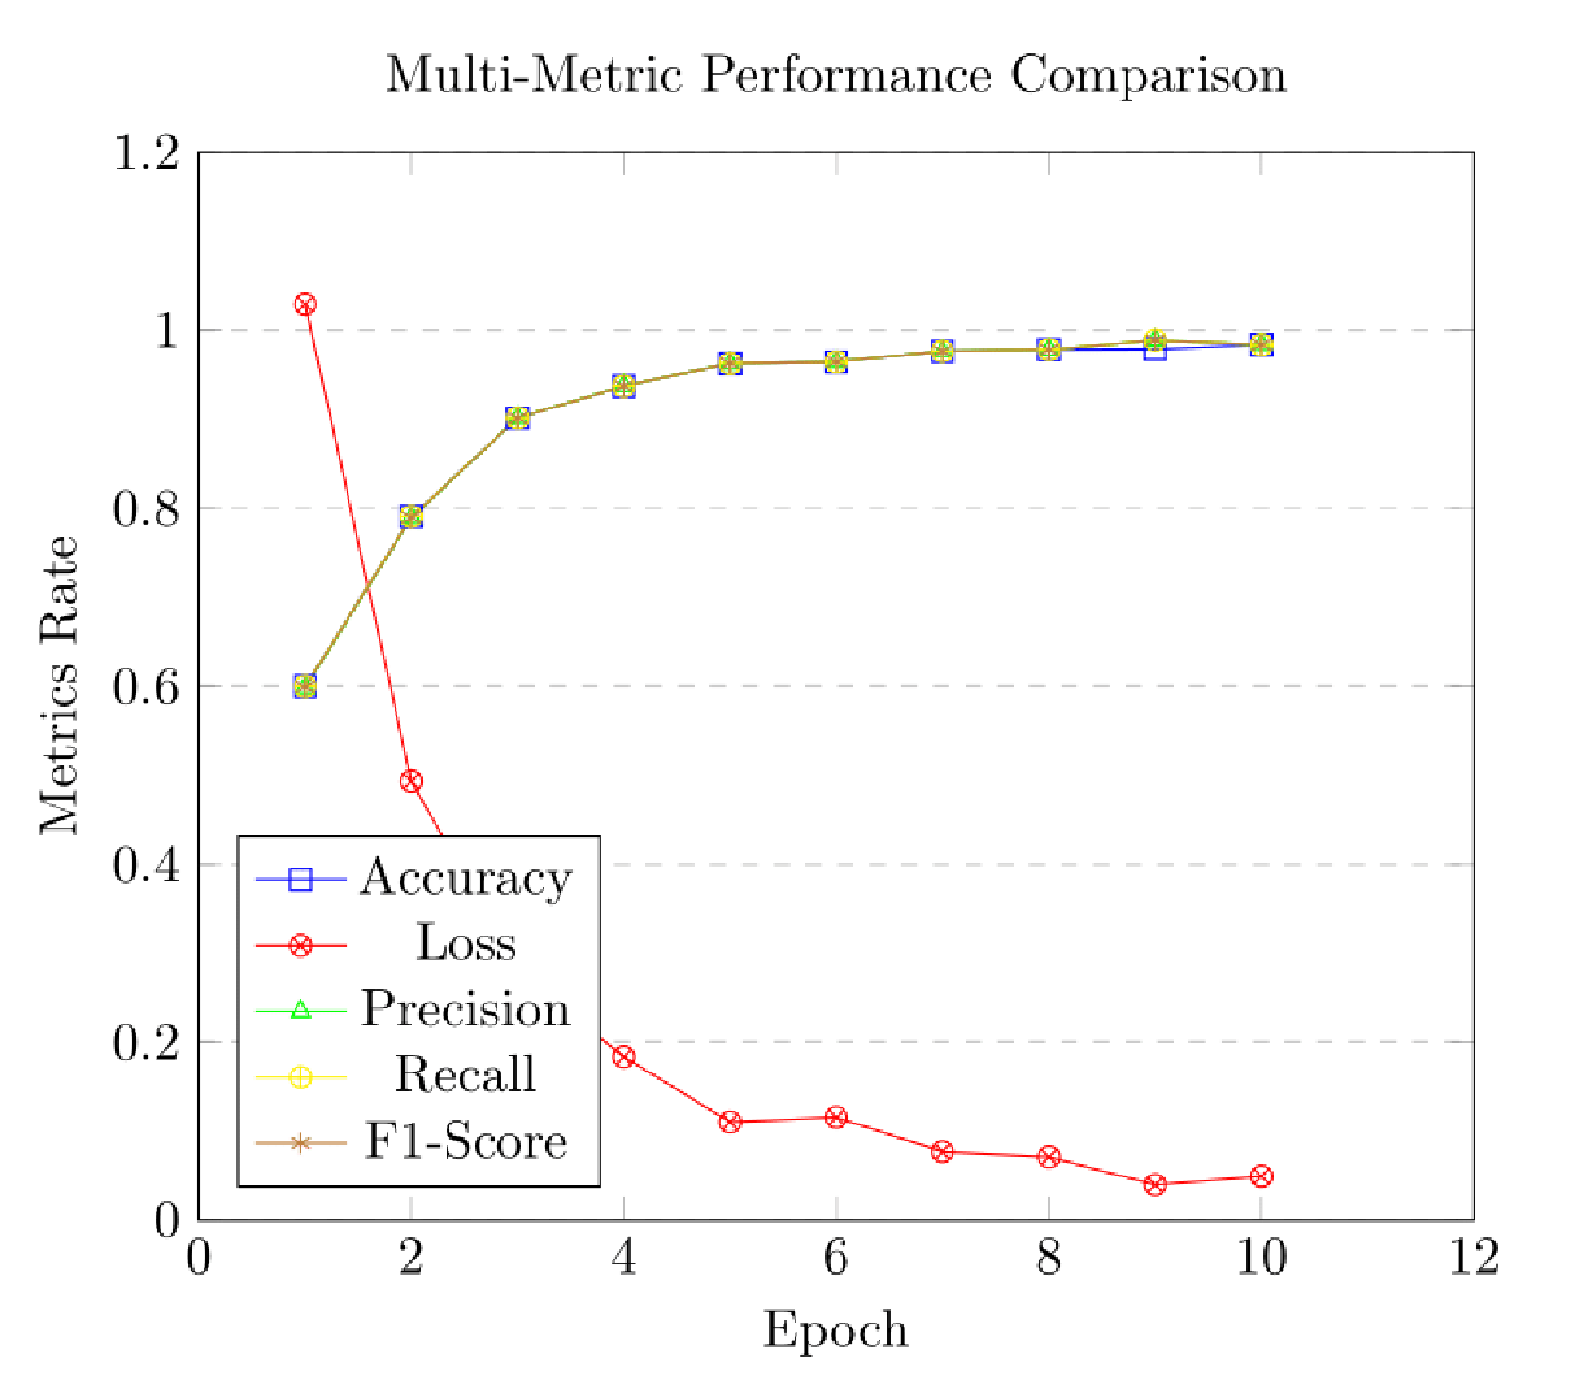
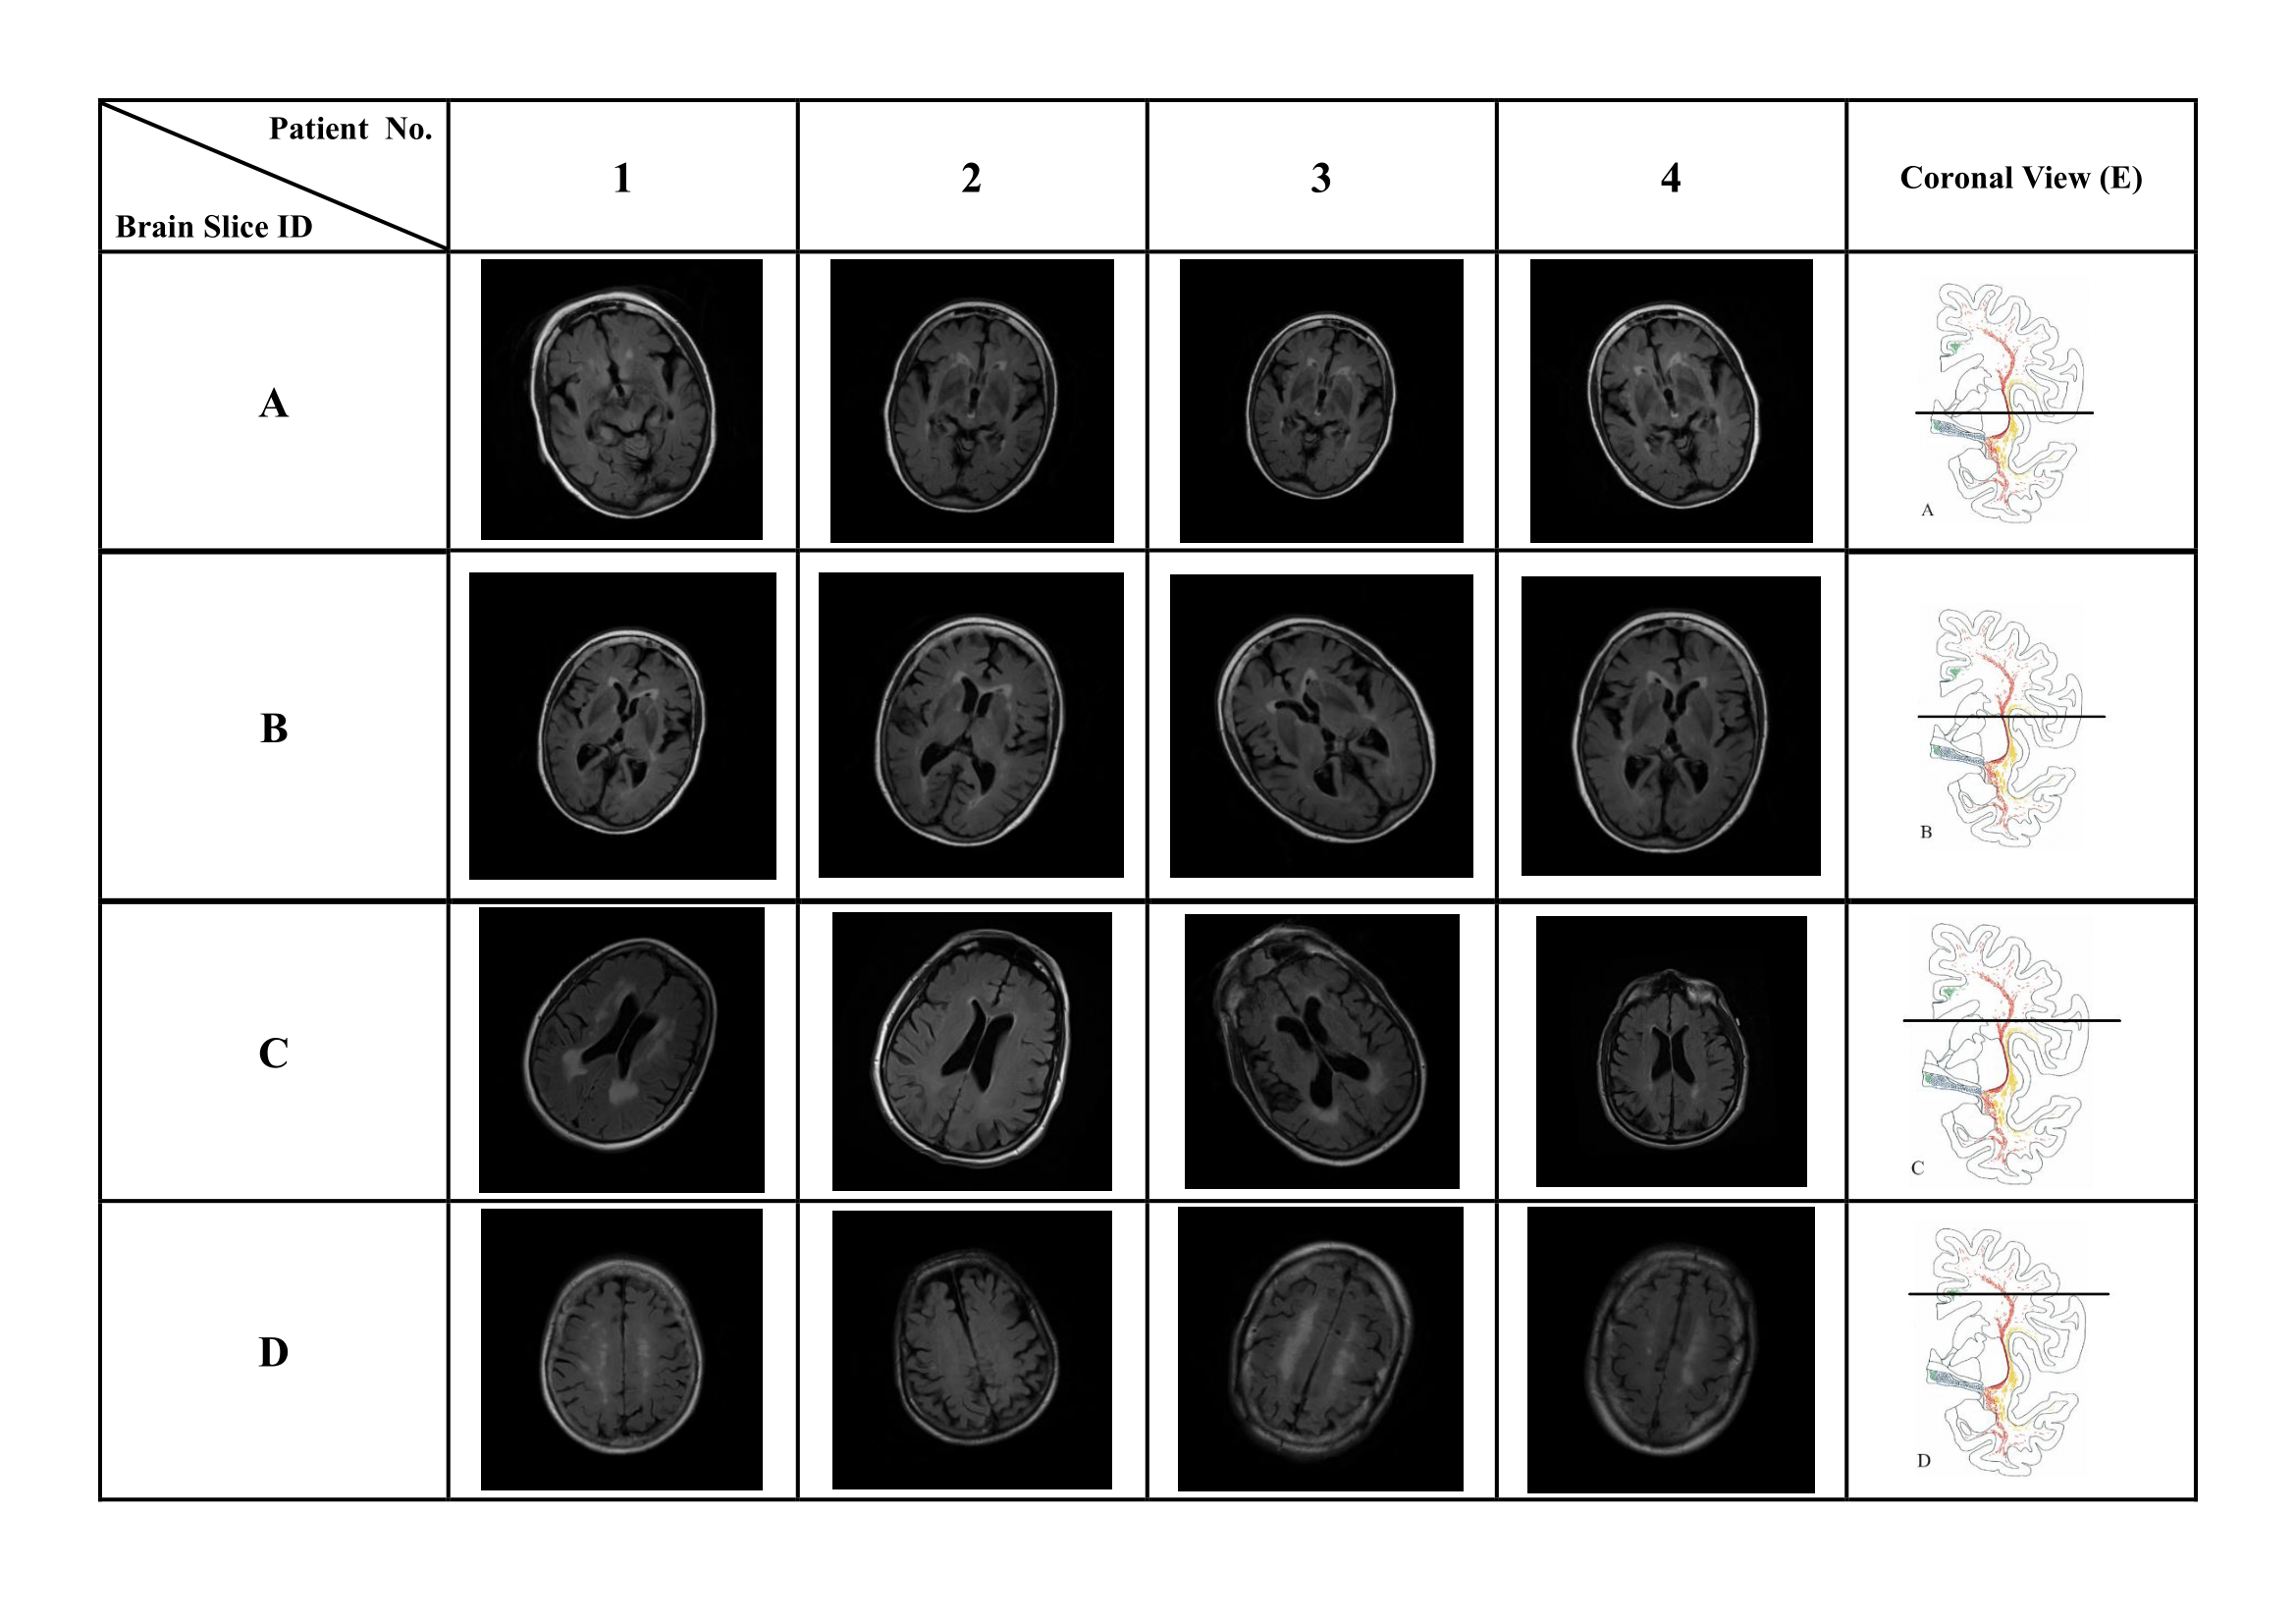
After training BSCA with learning rate=0.05, batch size=8, and 10 epochs, BSCA reached the best performance of 4-class slice classification, with the accuracy of 99.82%, precision of 99.81%, recall of 99.86%, and F1-score of 99.83% (Figure 2). Figure 3 demonstrates the output of BSCA, and it successfully selected 4 different classes of T2-FLAIR slices corresponding to 4 CHIPS anatomical slices from the 4 patients randomly chosen from TPMIC dataset.Discussion and conclusion
We demonstrated that BSCA utilized by ResNet [4] can be an automatic screening tool to efficiently provide 4 specific T2-FLAIR slices covering the white matter landmarks along the cholinergic pathways [2, 6] for clinicians to evaluate whether patients have the high risk to develop clinical dementia [3]. To add clinically diagnostic value to BSCA, future work will apply it as a module to a WMH segmentation tool that can automatically identify the white matter lesions and compute the CHIPS scores to rate the severity of WMH burden and assist in evaluating the disease severity of clinical dementia.Acknowledgements
Funding for this project was obtained from the National Science and Technology Concil of Taiwan (NSTC-110-2321-B418-001) and Cardinal Tien Hospital (CTH-110-2-1-014).References
- Fazekas, F., et al., MR signal abnormalities at 1.5 T in Alzheimer's dementia and normal aging. AJR Am J Roentgenol, 1987. 149(2): p. 351-6.
- Bocti, C., et al., A new visual rating scale to assess strategic white matter hyperintensities within cholinergic pathways in dementia. Stroke, 2005. 36(10): p. 2126-31.
- Yu, M.C., et al., White matter hyperintensities in cholinergic pathways are associated with dementia severity in e4 carriers but not in non-carriers. Front Neurol, 2023. 14: p. 1100322.
- He, K., et al. Deep residual learning for image recognition. in Proceedings of the IEEE conference on computer vision and pattern recognition. 2016.
- Petersen, R.C., et al., Alzheimer's Disease Neuroimaging Initiative (ADNI): clinical characterization. Neurology, 2010. 74(3): p. 201-9.
- Selden, N.R., et al., Trajectories of cholinergic pathways within the cerebral hemispheres of the human brain. Brain, 1998. 121 ( Pt 12): p. 2249-57.
Figures