4519
Random forest classifiers show myelin alterations in Long-COVID1NMR Research Unit, Queen Square MS Centre, Department of Neuroinflammation, UCL Queen Square Institute of Neurology, Faculty of Brain Sciences, University College London, London, United Kingdom, 2Department of Brain & Behavioural Sciences, University of Pavia, Pavia, Italy, 3Department of Brain Repair and Rehabilitation, UCL Queen Square Institute of Neurology, Faculty of Brain Sciences, University College London, London, United Kingdom, 4Department of Medical Physics and Biomedical Engineering, Centre for Medical Image Computing (CMIC), University College London, London, United Kingdom, 5E-Health Center, Universitat Oberta de Catalunya, Barcelona, Spain, 6Radiomics Group, Vall d’Hebron Institute of Oncology, Vall d’Hebron Barcelona Hospital Campus, Barcelona, Spain, 7Neurology-Neuroimmunology Department Multiple Sclerosis Centre of Catalonia (Cemcat), Vall d’Hebron Barcelona Hospital Campus, Barcelona, Spain, 8Centre for Obesity Research, Department of Medicine, University College London, London, United Kingdom, 9National Institute of Health Research, Biomedical Research Centre at UCLH and UCL, University College London, London, United Kingdom, 10Department of Clinical and Experimental Epilepsy, UCL Queen Square Institute of Neurology, Faculty of Brain Sciences, University College London, London, United Kingdom, 11Digital Neuroscience Center, IRCCS Mondino Foundation, Pavia, Italy
Synopsis
Keywords: Analysis/Processing, COVID-19, Long-COVID, Multimodal, MRI, myelin.
Motivation: Some people exposed to SARS-CoV-2 experience persistent symptoms months after recovering from acute infection. These symptoms, grouped under the umbrella of “long-COVID”, include neurological and autonomic dysfunctions for which there is not yet a clear explanation.
Goal(s): To identify biophysically meaningful features characterising long-COVID pathophysiology in the brain.
Approach: A novel multimodal MRI protocol was developed to measure iron accumulation, myelin content, inflammation, microstructure alterations, atrophy, and cerebral blood flow changes. Machine learning was employed to discriminate long-COVID from controls and people who fully recovered.
Results: Alterations in bound-pool fraction (myelin content) emerge in long-COVID.
Impact: This study encourages investigating the neurological aspect of long-COVID and its interplay with conditions affecting myelin as it shows that long-COVID may cause myelin alterations or be more likely to occur in people with compromised myelin content in the brain.
Introduction
SARS-CoV-2 has been associated with neurological diseases, particularly vascular disorders and altered mental status1,2, and a link between neurological symptoms and the virus induced cytokine storm has been shown3. People who experienced relatively mild COVID-19 also report persistent symptoms e.g., fatigue, brain fog, anosmia, and autonomic dysfunction such as orthostatic hypotension and breathing pattern disorder4. These persistent symptoms in otherwise healthy subjects are associated with what has now been defined as “long-COVID syndrome”. The evolving landscape of COVID-19 neurological manifestations requires detailed population-level studies to understand the extent of COVID-19 effects on the brain. Here we report results from a multi-modal quantitative MRI assessment revealing brain alterations in people who have a history of (long) COVID but were not hospitalised.Methods
Cohort123 subjects were scanned between June 2020 and August 2023, of which:
- 25 healthy controls who had not contracted COVID at the time of the scan (HC, 12M, 38±12y);
- 41 who had COVID and fully recovered prior to the scan (COVID, 9M, 38±11y);
- 57 subjects with long-COVID symptoms (Long-COVID, 18M, 47±13y).
A Philips Ingenia CX 3T scanner was used with a 32-channel head coil. The 1h15” MRI protocol included:
- 3DFLAIR (1×1×1 mm3; TE/TR=266 ms/4.8s, TI=1.65s, FA=40°; 3’26”) for lesion segmentation/filling5.
- 3DT1 (1×1×1 mm3; TE/TR=3.1/6.9 ms, FA=8°; 1’55”) for tissue segmentation, performed using Geodesic Information Flows6;
- pCASL (3×3×3 mm3; TE/TR=12.1/4266 ms, FA=90°, 360 scans; 8’) to measure cerebral blood flow;
- DWI (2×2×2 mm3; TE/TR=96/6287 ms, FA=90°, b-values={0, 1000, 2000, 2800}, directions={4, 20, 20, 36}; 9’41”); b0 with reverse phase encoding was also acquired. DTI and NODDI7 were performed on the DWI.
- IR (2×2×2 mm3; TE/TR=59 ms/15 s, TI/dTI=[50-1910]/120 ms, 12 TIs, FA=90°; 4’28”) for T1 mapping8.
- qMT (2×2×2 mm3; TE/TR=96/6287 ms, FA=90°, MT-offset={96(x2), 13.7(x5), 3(x5)} MHz, MT-FAs={100(x2), 890(x5), 593(x5)}°; 4’57”) for bound-pool fraction (BPF) and quantitative T2 of the bound component mapping8.
- B1-DAM (2×2×2 mm3; TE/TR=59 ms/15 s, FA=120/60°; 1’) and B1-AFI (4×4×4 mm3; TE=2.2 ms, TR=30/180 ms, FA=60°; 1’57”) for B1 mapping via dual angle method9 and actual flip angle method10;
- SPGR-multiTE (1×1×1 mm3; TE/dTE=[2.3-25.4]/3.3 ms, 8 TEs, TR=29 ms, FA=24°; 4’6”) and SPGR (1×1×1 mm3; TE/TR=2.3/29 ms, FA=4°; 4’6”), for T2* and proton density mapping10, and quantitative susceptibility mapping.
Dataset
N=61 biophysical features were extracted from the provided quantitative MRI maps, which include biomarkers for iron accumulation, myelin content, inflammation, microstructural alterations, atrophy, and cerebral blood flow changes. The dataset underwent age and gender correction via second order regression. Features significantly covarying with age and/or gender (p<0.05/N – Bonferroni correction) were corrected using the coefficients calculated over the HC group. Each feature was standardised to mean=0 and standard deviation=1.
Machine learning analysis
A customisable random forest framework was implemented using the sklearn package11 for Python 3.7. The framework has been made publicly available12. The model was defined using 1000 trees, 10-fold stratified cross validation with 100 repetitions. Values more than two standard deviations away from the mean were excluded and missing values were imputed group-wise via k-nearest neighbours. Random undersampling was used to offset imbalanced classes during training.
Results
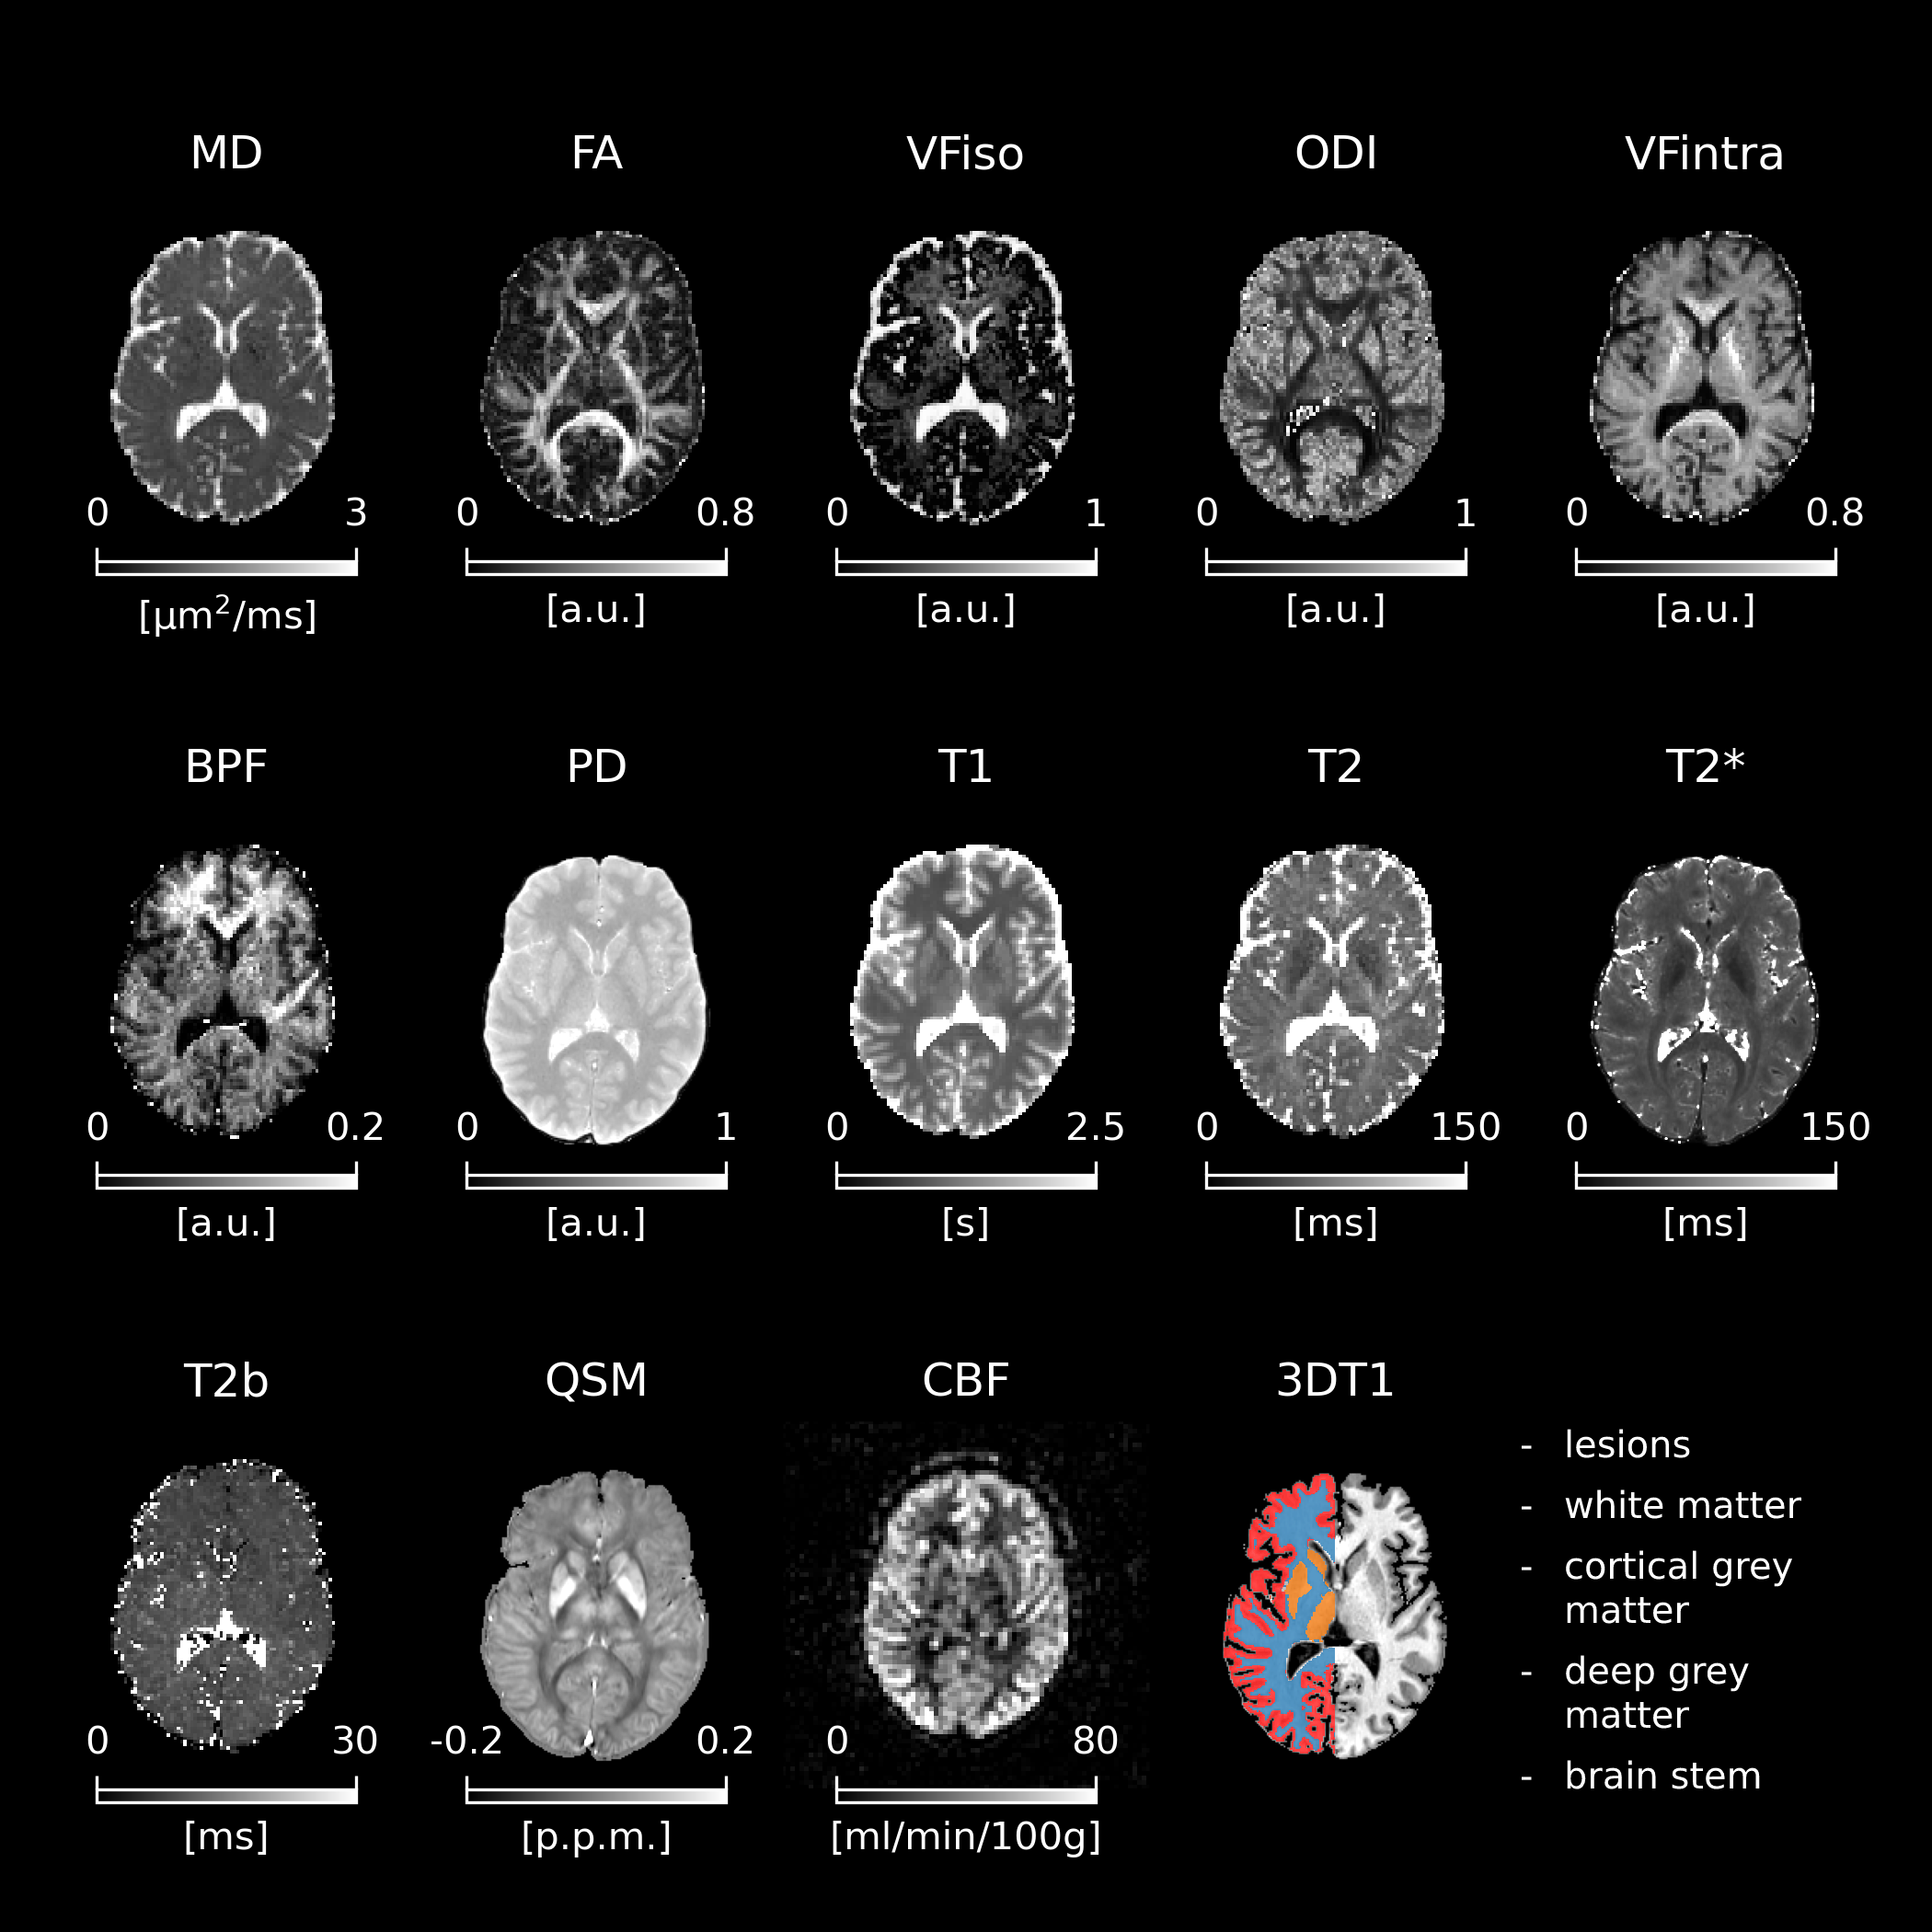
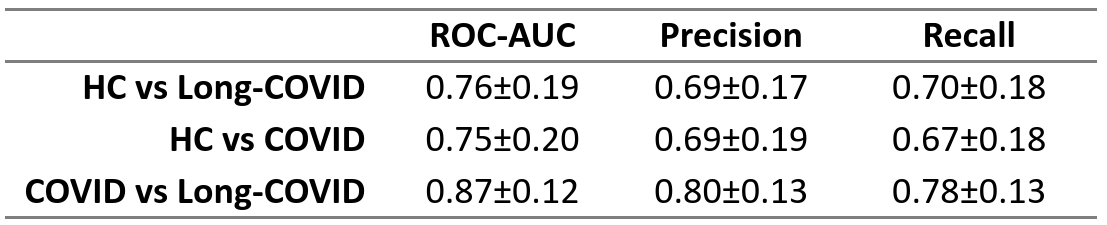
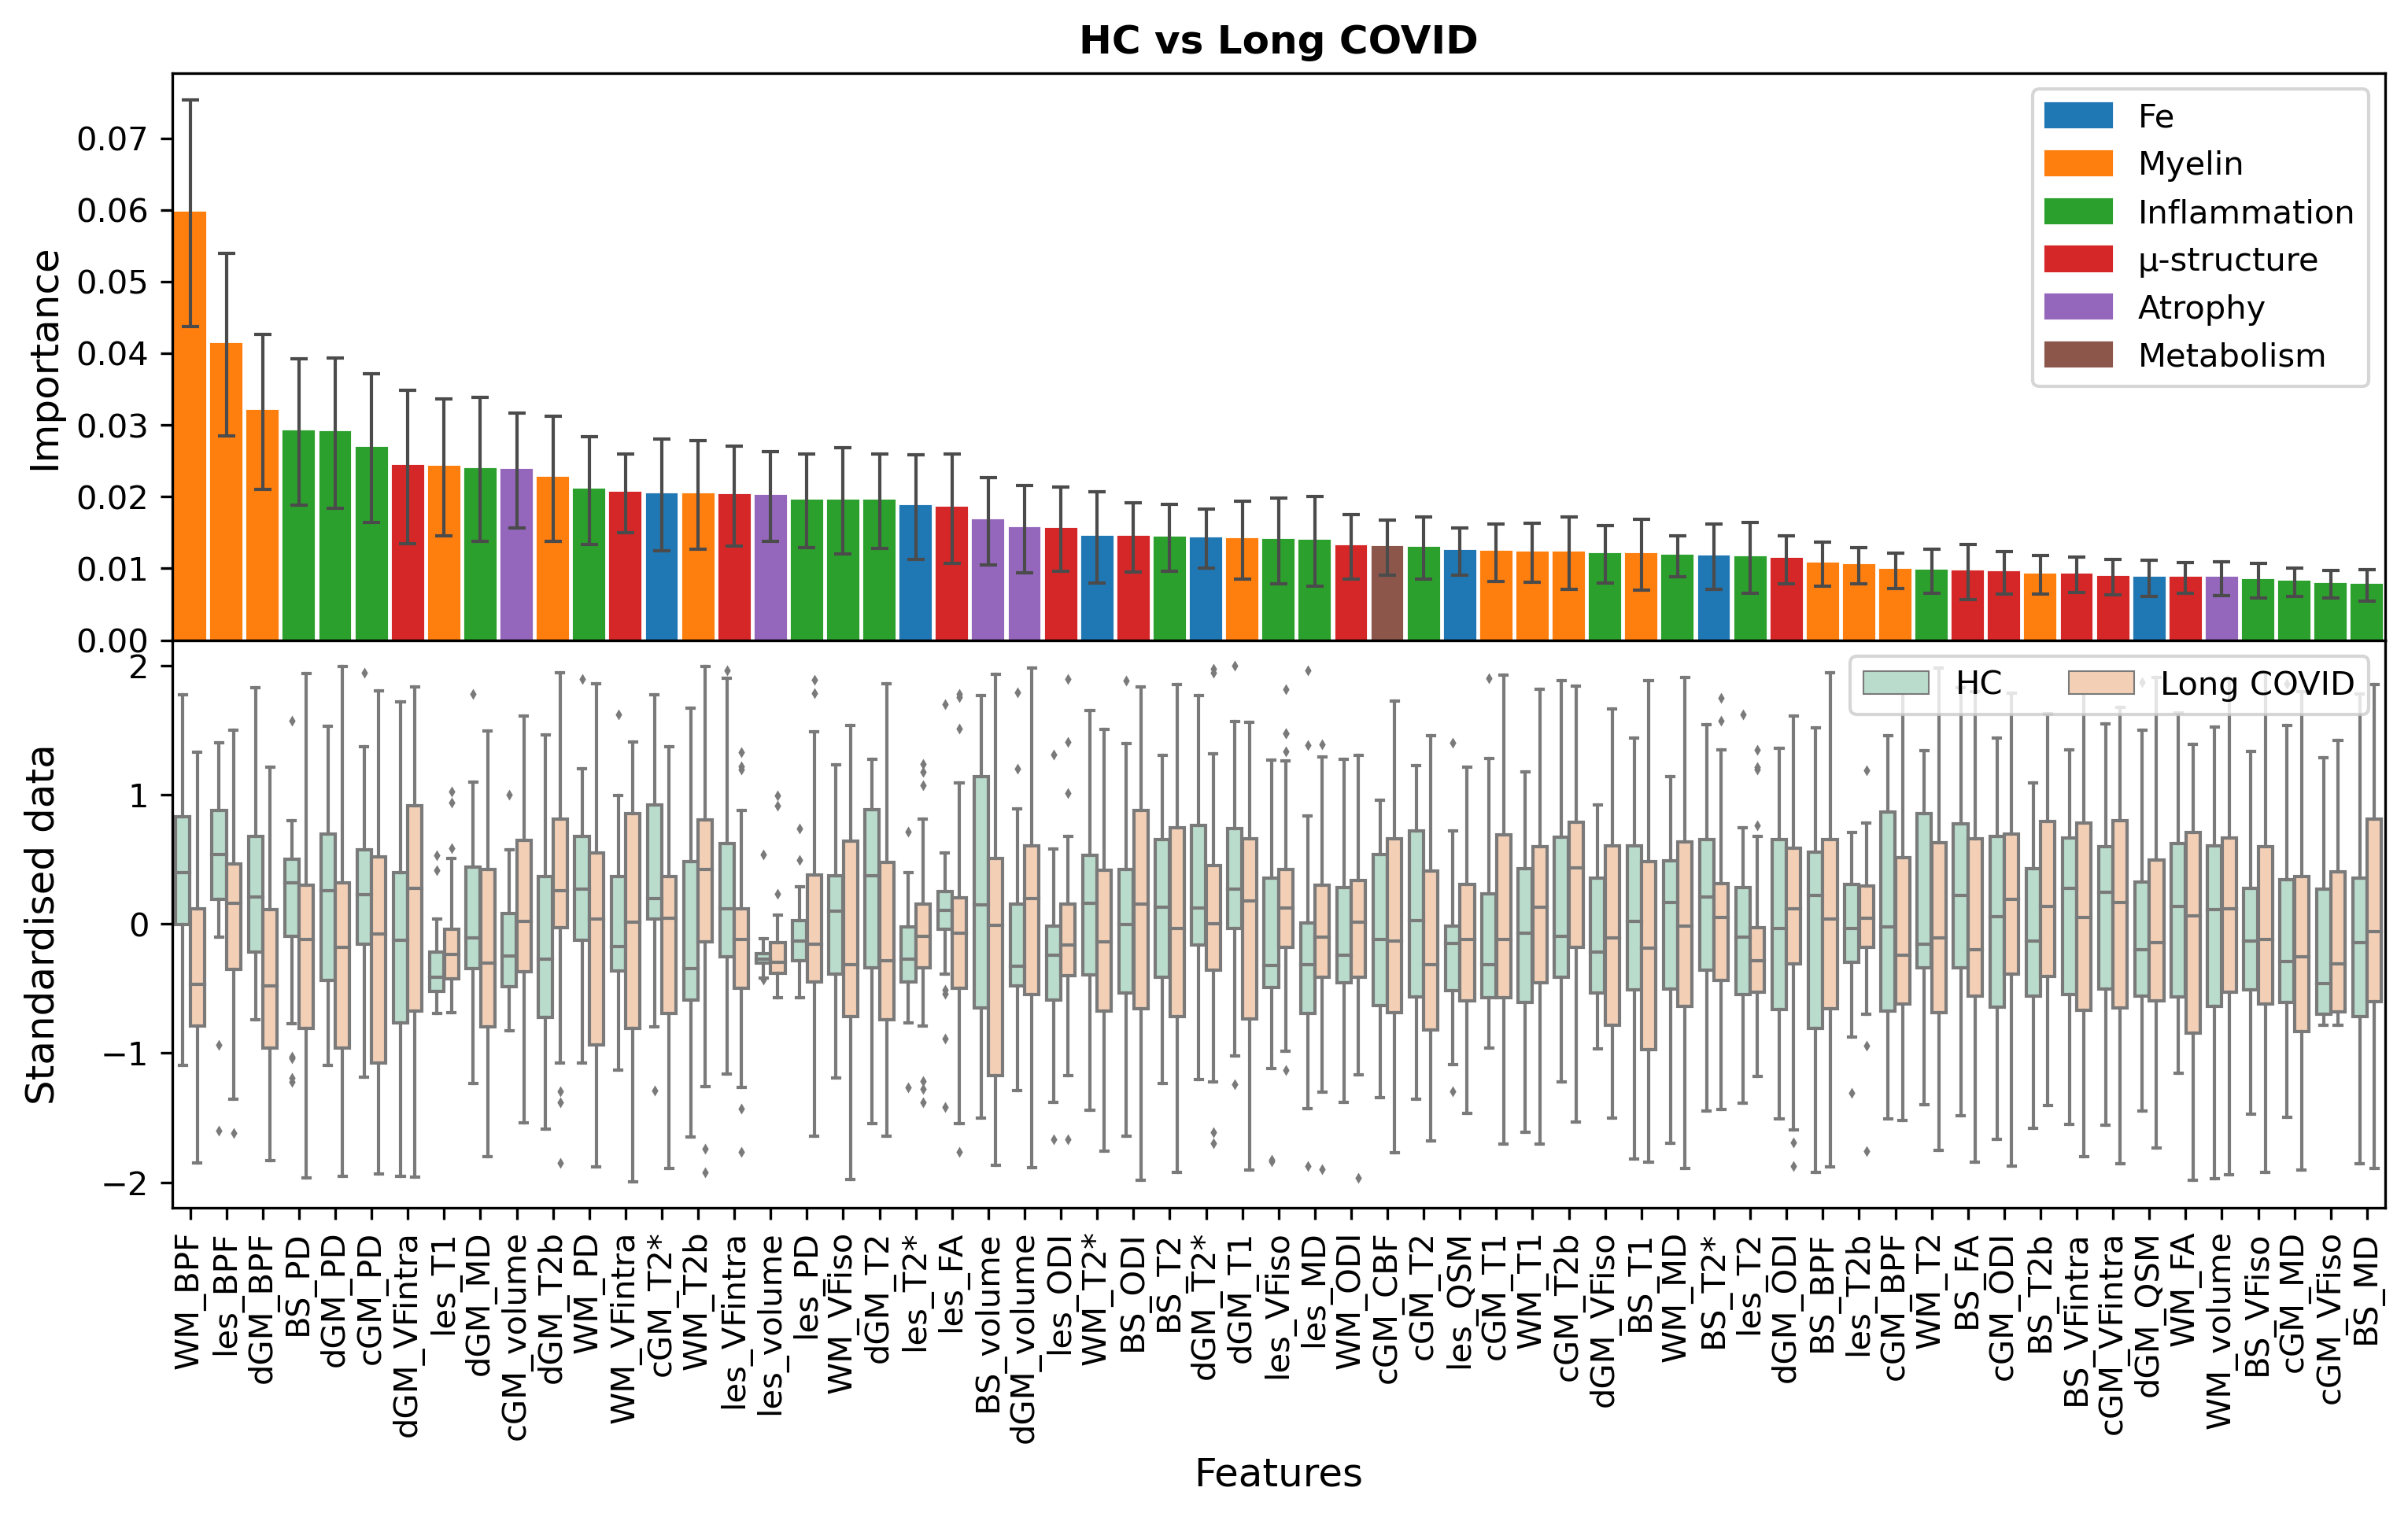
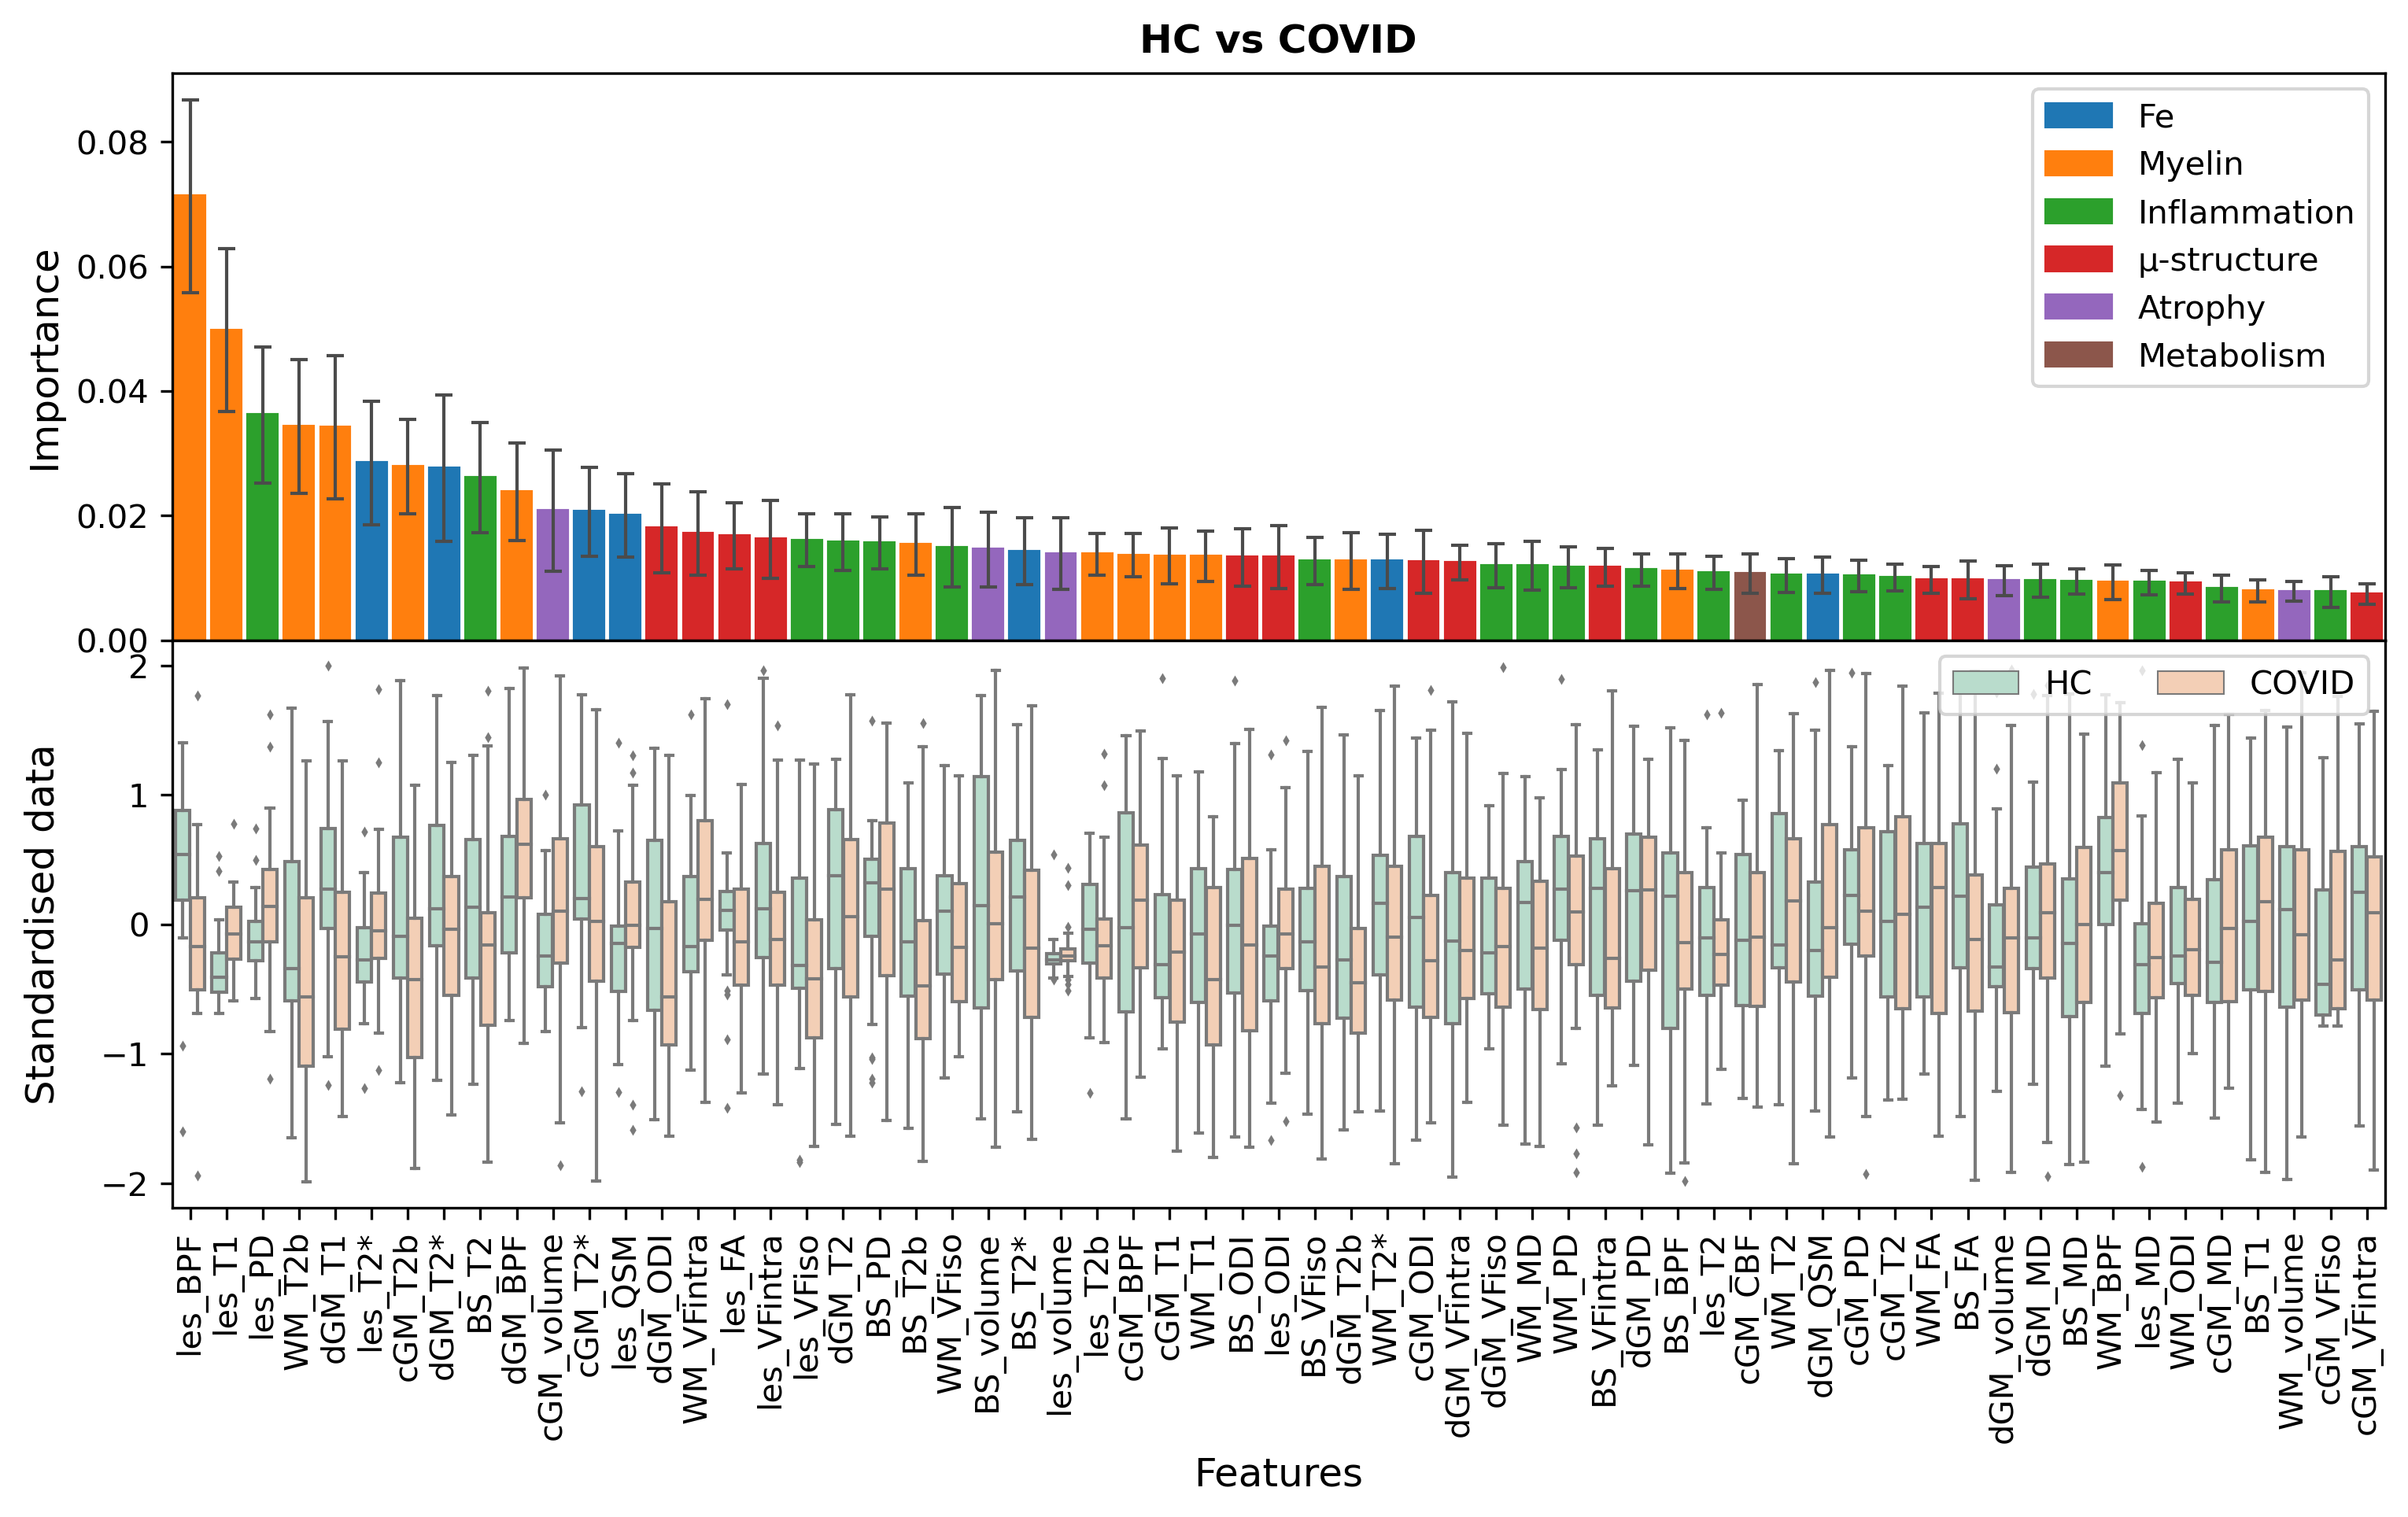
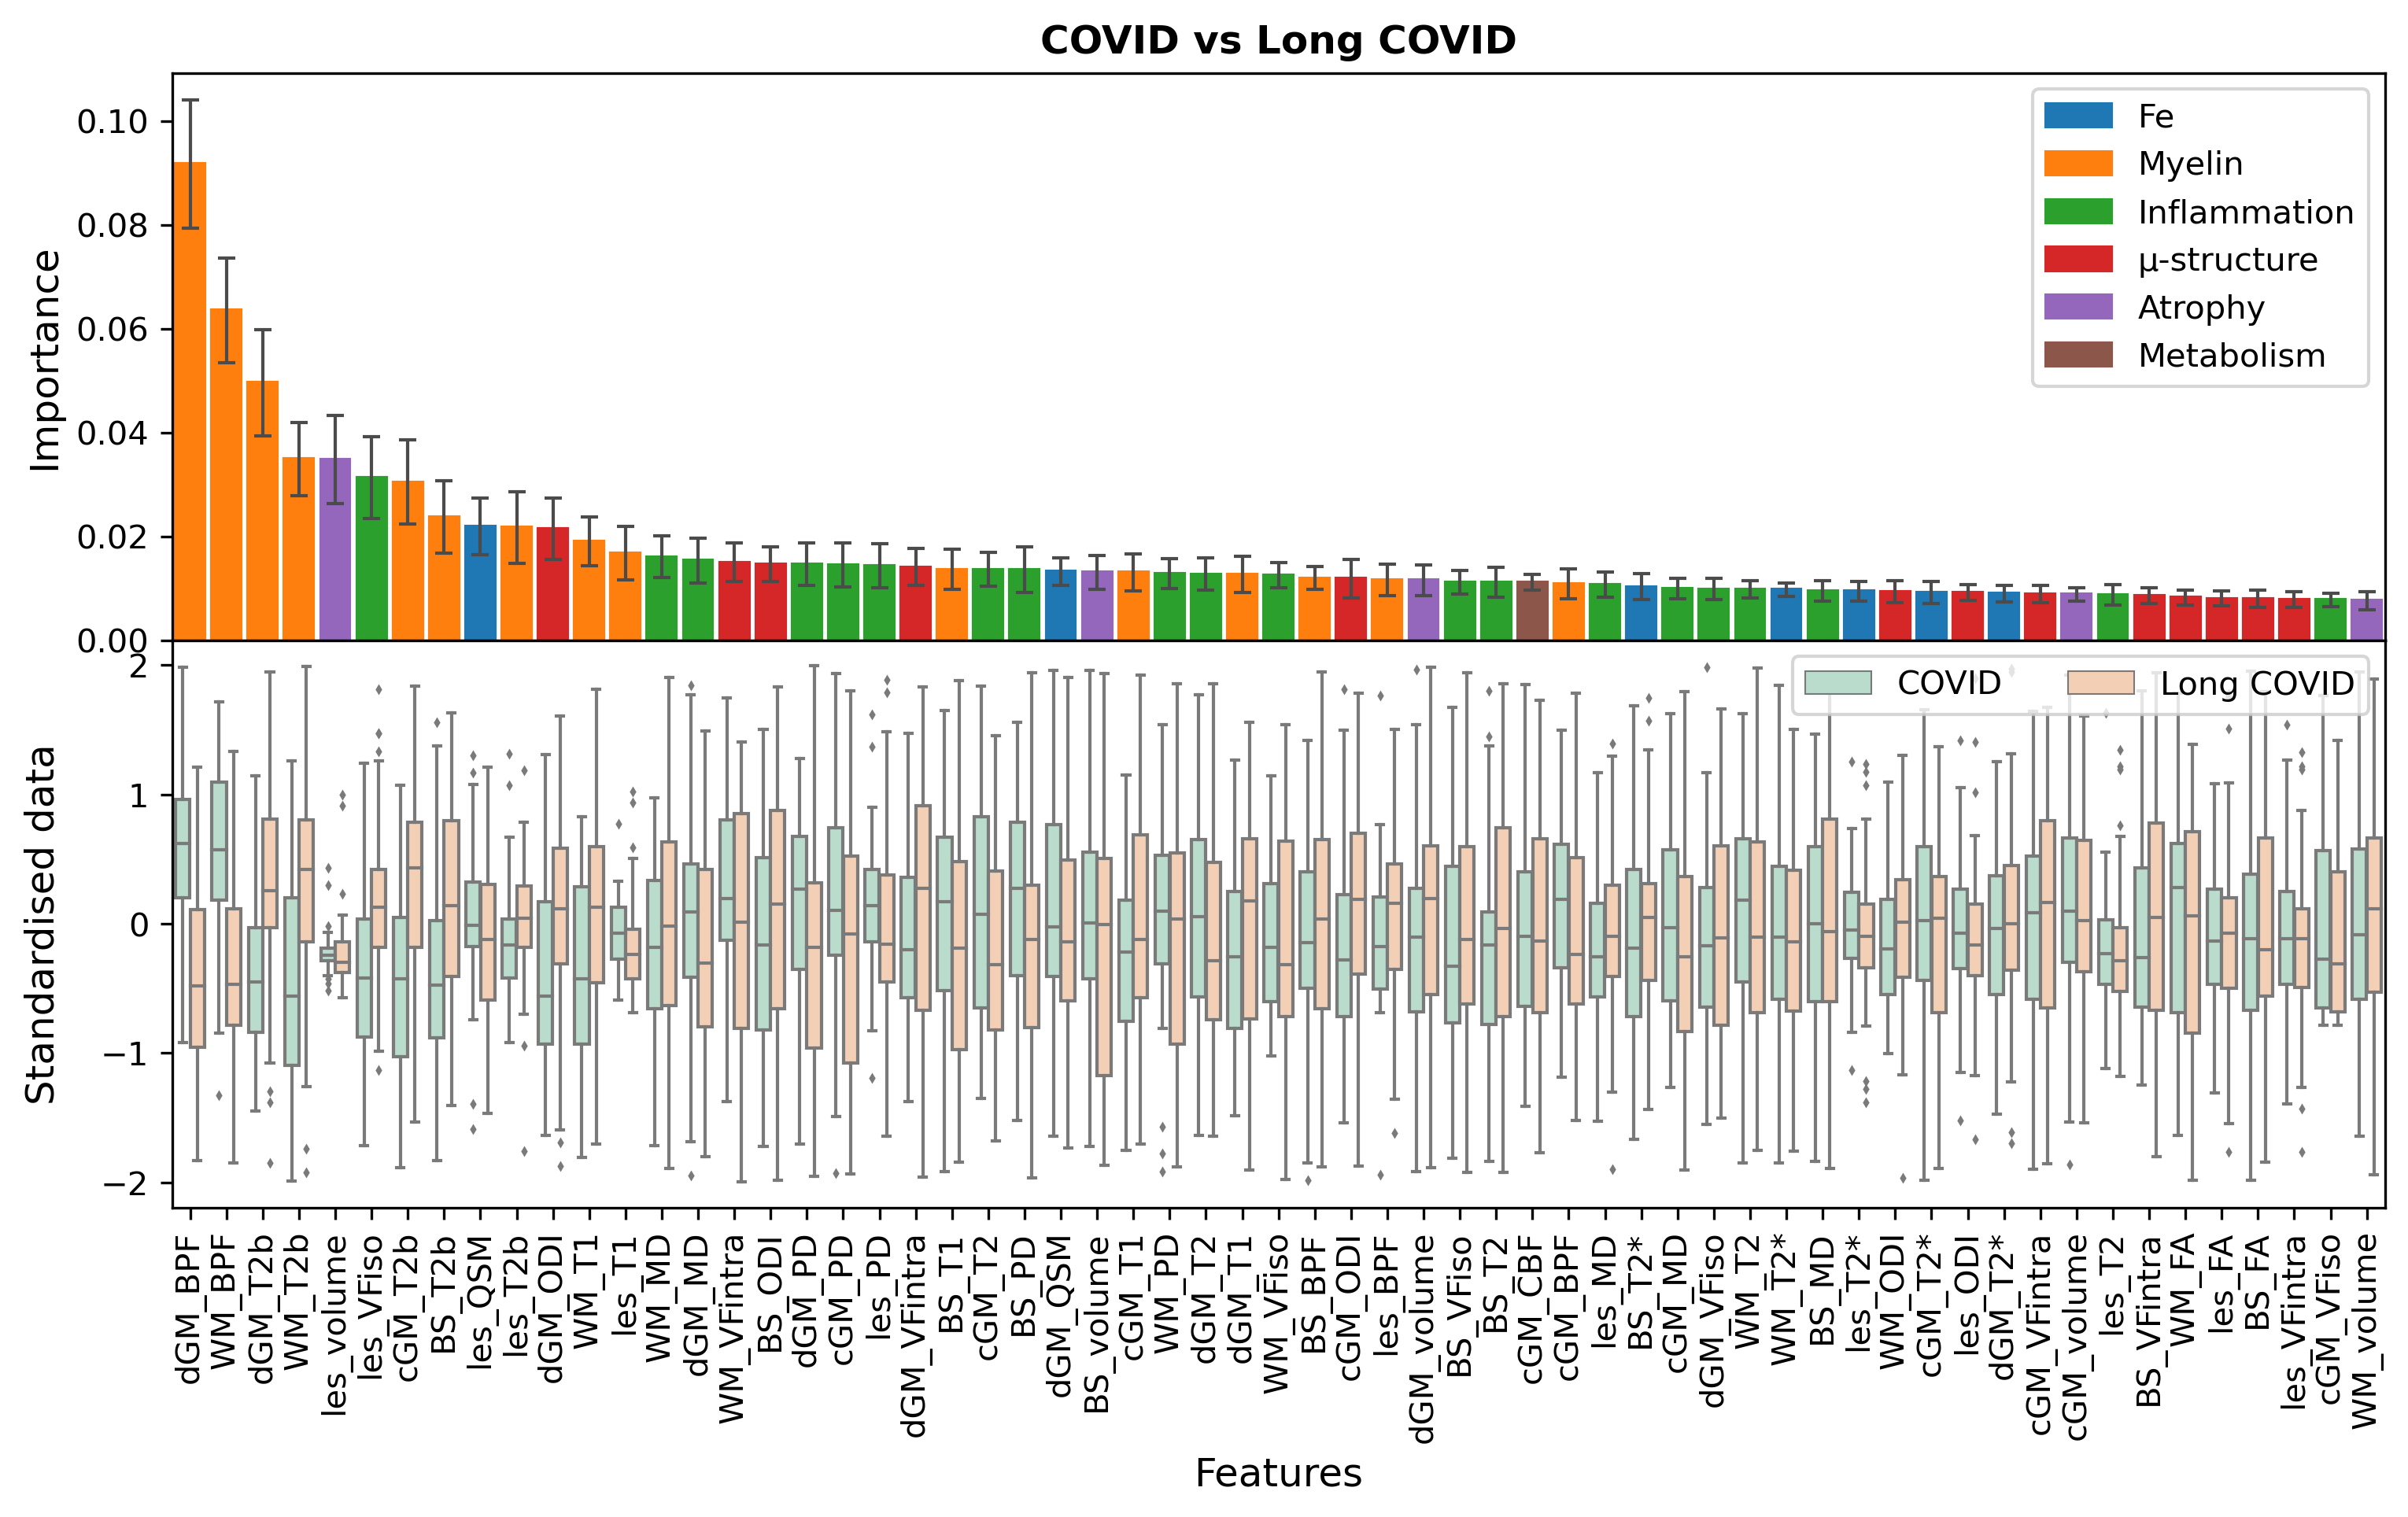
An overview of the quantitative maps obtained from the proposed protocol is shown in Figure 1. Classification scores for all tasks are reported in Table 1. Feature rankings are reported in Figures 2-4. Good classification performances were observed for all tasks, however the high uncertainty in the scores indicates large heterogeneity within the dataset. Myelin alterations emerged as important features for all tasks, particularly reduced BPF in Long-COVID against both HC and COVID groups.Discussion
In this work, a rich and novel multi-modal MRI protocol for the characterisation of long-COVID has been proposed. Good classification performances and recurring BPF alterations indicate possible long-term myelin changes associated with Long-COVID. Whether these alterations were caused by Long-COVID or are associated with a higher risk of developing Long-COVID requires further study. Random forest lends itself to the analysis of this dataset due to the range and variety of potential biophysically meaningful features reported. Correlations between features could however diminish the classification power of a machine learning analysis based on random forest alone13. Additional models and correlation analyses will be implemented in the future.Acknowledgements
This study was funded by the Horizon2020 (Research and Innovation Action Grants Human Brain Project 945539 (SGA3)), the Biomedical Research Centre (BRC), and Rosetrees Trust. EG receives funding from TDC Technology Dedicated to Care. FPr received a Guarantors of Brain fellowship 2017–2020 and is supported by the National Institute for Health Research (NIHR), the Biomedical Research Centre initiative at University College London Hospitals (UCLH). FG receives the support of a fellowship from "la Caixa" Foundation (ID 100010434). The fellowship code is “LCF/BQ/PR22/11920010”.RS receives funding from the BRC (BRC1130/HEI/RS/11041). FPa receive funding from H2020 Research and Innovation Action Grants Human Brain Project (#785907, SGA2 and #945539, SGA3). H2020 Research and Innovation Action Grants Human Brain Project 785907 and 945539 (SGA2 and SGA3) fund ED'A. Moreover, the project was supported by the MNL Project “Local Neuronal Microcircuits” of the Centro Fermi (Rome, Italy) to ED'A. This work was also supported by #NEXTGENERATIONEU (NGEU) and funded by the Ministry of University and Research (MUR), National Recovery and Resilience Plan (NRRP), project MNESYS (PE0000006) - A Multiscale integrated approach to the study of the nervous system in health and disease (DN. 1553 11.10.2022).CGWK receives funding from Horizon2020 (Research and Innovation Action Grants Human Brain Project 945539 (SGA3)), BRC (#BRC704/CAP/CGW), MRC (#MR/S026088/1), Ataxia UK, Rosetrees Trust (#PGL22/100041 and #PGL21/10079). CGWK is a shareholder in Queen Square Analytics Ltd. JM receives funding from BRC.References
- Baig, A.M., 2022. Counting the neurological cost of COVID-19. Nature Reviews Neurology, 18(1), pp.5-6.
- Ahmed, J.O., Ahmed, S.A., Hassan, M.N., Kakamad, F.H., Salih, R.Q., Abdulla, B.A., Fattah, F.H.R., Mohammed, S.H., Ali, R.K. and Salih, A.M., 2022. Post COVID-19 neurological complications; a meta-analysis. Annals of Medicine and Surgery, p.103440.
- Espíndola, O.M., Gomes, Y.C., Brandão, C.O., Torres, R.C., Siqueira, M., Soares, C.N., Lima, M.A.S., Leite, A.C.C., Venturotti, C.O., Carvalho, A.J.C. and Torezani, G., 2021. Inflammatory cytokine patterns associated with neurological diseases in coronavirus disease 2019. Annals of Neurology, 89(5), pp.1041-1045.
- Davis, H.E., McCorkell, L., Vogel, J.M. and Topol, E.J., 2023. Long COVID: major findings, mechanisms and recommendations. Nature Reviews Microbiology, 21(3), pp.133-146.
- Prados, F., Cardoso, M.J., Kanber, B., Ciccarelli, O., Kapoor, R., Wheeler-Kingshott, C.A.G. and Ourselin, S., 2016. A multi-time-point modality-agnostic patch-based method for lesion filling in multiple sclerosis. Neuroimage, 139, pp.376-384.
- Cardoso, M.J., Modat, M., Wolz, R., Melbourne, A., Cash, D., Rueckert, D. and Ourselin, S., 2015. Geodesic information flows: spatially-variant graphs and their application to segmentation and fusion. IEEE transactions on medical imaging, 34(9), pp.1976-1988.
- Zhang, H., Schneider, T., Wheeler-Kingshott, C.A. and Alexander, D.C., 2012. NODDI: practical in vivo neurite orientation dispersion and density imaging of the human brain. Neuroimage, 61(4), pp.1000-1016.
- Battiston, M., Schneider, T., Grussu, F., Yiannakas, M.C., Prados, F., De Angelis, F., Gandini Wheeler‐Kingshott, C.A. and Samson, R.S., 2019. Fast bound pool fraction mapping via steady‐state magnetization transfer saturation using single‐shot EPI. Magnetic Resonance in Medicine, 82(3), pp.1025-1040.
- Boudreau, M., Tardif, C.L., Stikov, N., Sled, J.G., Lee, W. and Pike, G.B., 2017. B1 mapping for bias‐correction in quantitative T1 imaging of the brain at 3T using standard pulse sequences. Journal of magnetic resonance imaging, 46(6), pp.1673-1682.
- Grussu, F., Battiston, M., Veraart, J., Schneider, T., Cohen-Adad, J., Shepherd, T.M., Alexander, D.C., Fieremans, E., Novikov, D.S. and Wheeler-Kingshott, C.A.G., 2020. Multi-parametric quantitative in vivo spinal cord MRI with unified signal readout and image denoising. Neuroimage, 217, p.116884.
- Pedregosa, F., Varoquaux, G., Gramfort, A., Michel, V., Thirion, B., Grisel, O., Blondel, M., Prettenhofer, P., Weiss, R., Dubourg, V. and Vanderplas, J., 2011. Scikit-learn: Machine learning in Python. the Journal of machine Learning research, 12, pp.2825-2830.
- https://github.com/hex808080/MODEL-COV/blob/main/README.md
- Gregorutti, B., Michel, B. and Saint-Pierre, P., 2017. Correlation and variable importance in random forests. Statistics and Computing, 27, pp.659-678.
Figures