4513
Automated Quality Control for Arterial Spin Labelling (ASL) MRI Using a VAE-based Neural Network1Mental Health & Clinical Neurosciences, School of Medicine, University of Nottingham, Nottingham, United Kingdom, 2Sir Peter Mansfield Imaging Centre, School of Medicine, University of Nottingham, Nottingham, United Kingdom, 3The Irish Longitudinal Study on Ageing (TILDA), School of Medicine, Trinity College Dublin, Dublin, Ireland, 4Computer Vision Laboratory, School of Computer Science, University of Nottingham, Nottingham, United Kingdom, 5Discipline of Medical Gerontology, School of Medicine, Trinity College Dublin, Dublin, Ireland, 6Mercer’s Institute for Successful Ageing (MISA), St. James’s Hospital, Dublin, Ireland, 7Intelligent Modelling&Analysis Group, School of Computer Science, University of Nottingham, Nottingham, United Kingdom
Synopsis
Keywords: Diagnosis/Prediction, Perfusion, Quality Control
Motivation: Quality Control (QC) of ASL data is primarily a manual and subjective process that is time-intensive and can yield inconsistent results due to rater variability, while existing tools provide limited diagnostic metrics mostly focused on specific error source.
Goal(s): To develop a QC detector to automatically detect outliers for ASL data.
Approach: VAE-GAN model was applied to extract the latent representation of ASL data by which the decision boundary can be determined.
Results: The AUROC of our QC detector on test dataset is 0.82 with accuracy=0.81.
Impact: Our QC detector could help radiologists and researchers working on ASL MRI to automatically identify outliers. Consequently, appropriate operations can be used to correct or exclude outliers to avoid biases in the outcomes and ensure accurate interpretations.
ASL is a non-invasive magnetic resonance imaging (MRI) technique designed for non-invasively quantifying tissue perfusion, by magnetically labelling arterial blood water protons to obtain an endogenous blood flow tracer1. ASL especially suffers from some specific artifacts2 including labelling efficiency loss, delayed arrival, low contrast, motion and distortion. Currently, QC is undertaken mostly by visual inspection3 which is quite time-consuming and challenging, especially in large datasets of ASL data. Moreover, manual visual QC can vary based on many factors, such as the individual sensitivity and expertise, resulting in significant differences between raters. Existing tools detecting outliers by a number of diagnostic metrics, such as FSL EDDY4 for motion and current induced distortions, might not be effective in detecting outliers that present with a range of artifacts. Deep learning models, especially convolutional neural networks (CNN), which mimic the way humans extract visual features, have the potential to be extremely effective in training automated QC detectors. In this work, we developed an automated QC tool to detect outliers for labelled ASL data. The applied model5 combines a variational autoencoder (VAE) with a generative adversarial network (GAN). VAE can map data to a lower-dimensional latent space using the principles of Bayesian inference. The latent data representation is then applied to measure its similarity (Mahalanobis distance) to the distribution of normal data. Instead of using a typical element-wise reconstruction metric in classic VAE, GAN discriminator utilizes a feature-wise metric to extract a rich similarity metric for ASL data. Our assumption is that the similarity of an outlier should have a larger distance to the distribution of normal ASL data. Consequently, an optimal threshold was established to distinguish between normal data and outliers, serving as the decision boundary for outlier detection.
Methods
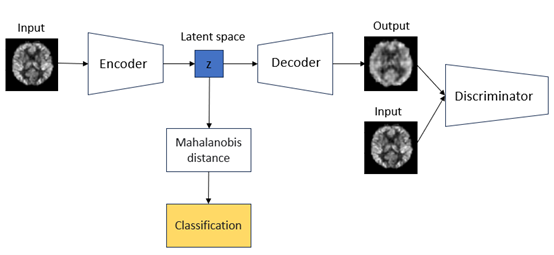
Fig. 1. shows the workflow of the QC detector. The encoder (3 conventional layers and a linear layer) maps input ASL images into a lower-dimension latent space. The decoder and the GAN generator are collapsed into one (a linear layer and 3 de-conventional layers) by letting them share parameters and training them jointly. Therefore, the typical element-wise reconstruction metric is replaced by a feature-wise metric expressed in the discriminator (3 conventional layers and 2 linear layers) for training. The loss functions of the network can be found in work5. In training phase, we only input normal images to the model to learn the normal data representation in latent space (z in fig. 1.). In prediction phase, we calculate the Mahalanobis distance between the latent representation for test data and the distribution of normal ones. In the end, the threshold was determined by the best classification of normal data and outliers.
Experiments
The dataset consists of 476 ASL MRI images from The Irish Longitudinal Study on Ageing (TILDA)6. Experts categorized the dataset into 449 normal images and 27 outliers, with the outliers further identified by artefact type: 20 with poor labelling efficiency, 6 with delayed arrival, 7 with motion issues, 1 with low contrast, and 1 with poor signal, noting that a single subject could be labelled with multiple artefacts. The ASL images underwent preprocessing, and alignment to the MNI152 standard space, and were then resampled to a 64x64x64 resolution, with 2D images extracted from the central slice. The dataset was randomly divided into a training set with 400 normal images and a test set comprising 49 normal images along with 27 outliers. Adam optimizers were used for encoder, decoder and discriminator with learning rates 0.00025, 0.001 and 0.0005 respectively. The model underwent training for 1000 epochs with a latent space size of 1024.
Results
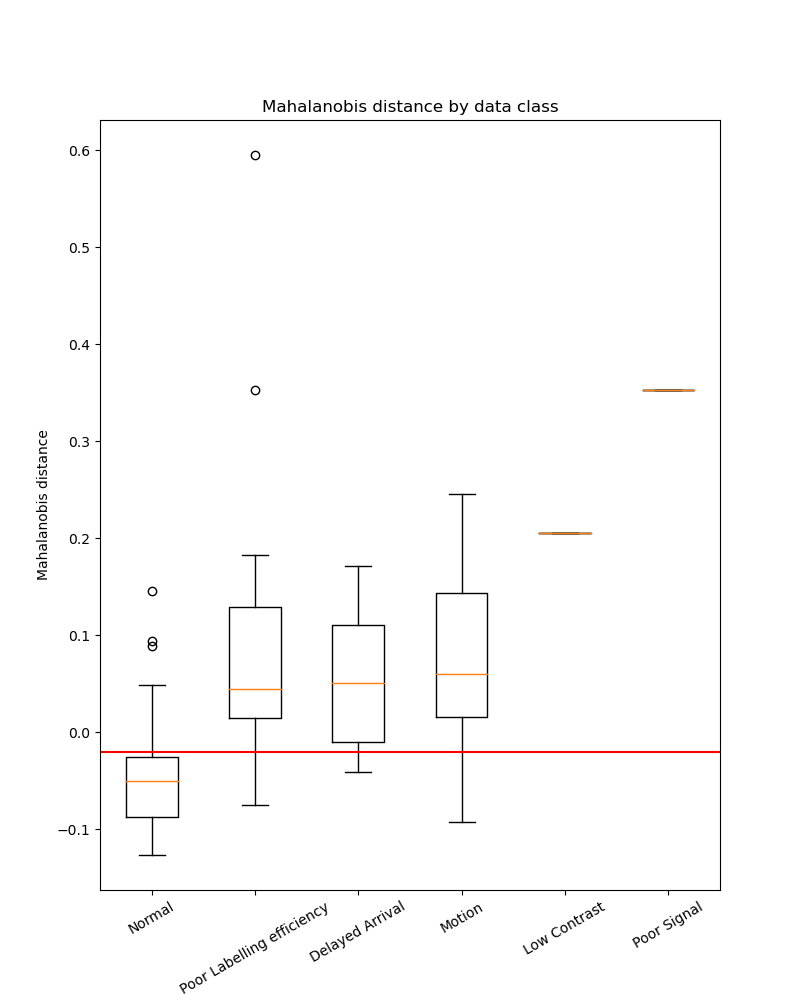
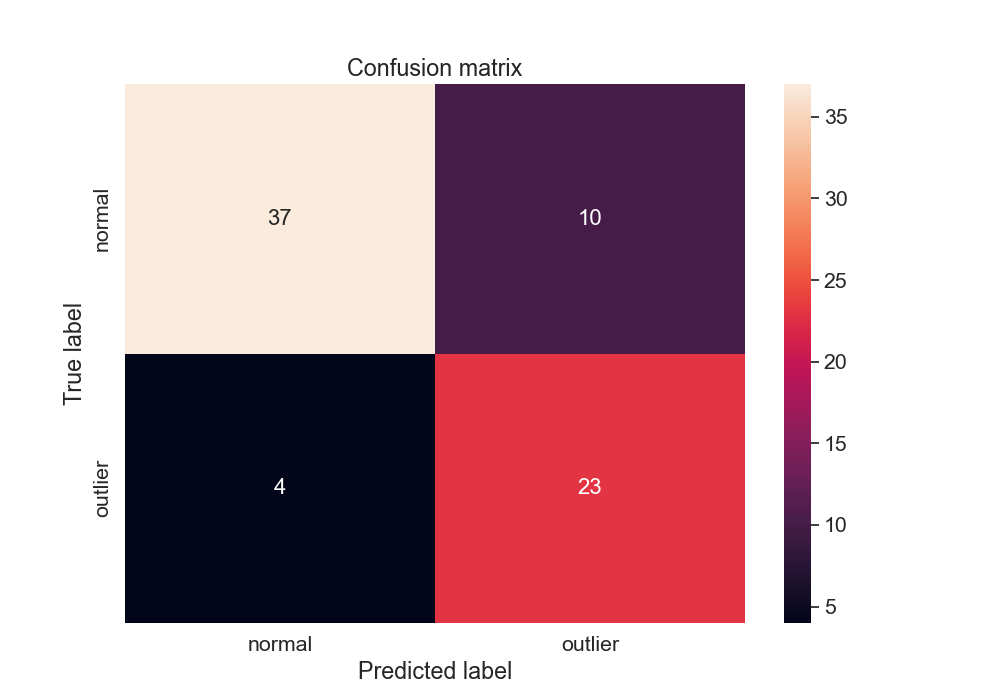
Figure 2. shows the mahalanobis distances of test dataset by class. Figure 3. Shows the corresponding confusion matrix of classification. The AUROC for classification is 0.82 with accuracy=0.81.
Discussion and Conclusions
Our tool demonstrates good performance in detecting outliers with different artefacts. However, this study is not without its constraints. The quantity and diversity of outliers are currently limited. Besides, the detection was conducted within the confines of MNI standard space, potentially overlooking certain intrinsic characteristics of ASL data. While manually labelled normal ASL data were utilized in the training phase, when more outlier cases are available, the threshold can be better defined based on a small normal/outlier dataset. In future, we anticipate that our tool will advance to classify outliers into distinct sub-classes by leveraging the learned latent data representation.
Acknowledgements
The Irish Longitudinal Study on Ageing (TILDA) is funded by The Irish Government, The Atlantic Philanthropies and Irish Life PLC. MC acknowledges funding from The Engineering and Physical Sciences Research Council, UK [ EP/P012361/1 ].References
1. Chappell, Michael. Introduction to Perfusion Quantification Using Arterial Spin Labelling. United Kingdom: Oxford University Press, 2018. Web.
2. Jaganmohan D, Pan S, Kesavadas C, Thomas B. A pictorial review of brain arterial spin labelling artefacts and their potential remedies in clinical studies. Neuroradiol J. 2021 Jun;34(3):154-168. doi: 10.1177/1971400920977031  Add to Citavi project by DOI. Epub 2020 Dec 7. PMID: 33283653 ; PMCID: PMC8165894.
3. Fallatah SM, Pizzini FB, Gomez-Anson B, Magerkurth J, De Vita E, Bisdas S, Jäger HR, Mutsaerts HJMM, Golay X. A visual quality control scale for clinical arterial spin labeling images. Eur Radiol Exp. 2018 Dec 19;2(1):45. doi: 10.1186/s41747-018-0073-2 Add to Citavi project by DOI. PMID: 30569375 Add to Citavi project by Pubmed ID; PMCID: PMC6300452.
4. Jesper L. R. Andersson and Stamatios N. Sotiropoulos. An integrated approach to correction for off-resonance effects and subject movement in diffusion MR imaging. NeuroImage, 125:1063-1078, 2016.
5. A. B. L. Larsen, S. K. Sønderby, H. Larochelle, and O. Winther. 2015. Autoencoding beyond pixels using a learned similarity metric. arXiv preprint arXiv:1512.09300.
6. Leidhin, C.N., McMorrow, J., Carey, D., Newman, L., Williamson, W., Fagan, A.J., Chappell, M.A., Kenny, R.A., Meaney, J.F., & Knight, S.P. (2021). Age-related normative changes in cerebral perfusion: Data from The Irish Longitudinal Study on Ageing (TILDA). NeuroImage, 229.
Figures