4496
Curation of Training Data for Supervised Deep Learning Reconstruction of Speech Real-Time MRI1Electrical and Computer Engineering, University of Southern California, Los Angeles, CA, United States, 2Linguistics, University of Southern California, Los Angeles, CA, United States
Synopsis
Keywords: AI/ML Image Reconstruction, Data Processing, Dynamic Imaging
Motivation: Supervised deep learning (DL) reconstruction requires large training sets and computationally demanding training. Real-time MRI offers large temporal redundancy which yields high reconstruction performance from training on a subset of frames.
Goal(s): To develop a method for curating small DL training datasets that capture the variance of the entire training set and provide performance non-inferior to the entire training set, with reduced training time.
Approach: We use clustering for each training speech task followed by selecting a fraction of each cluster to train U-Nets for reconstruction.
Results: We achieve improved image quality metrics with comparable image quality metrics with 10x improved training time.
Impact: By using curated training data based on identification and clustering of vocal tract postures, we demonstrate supervised DL-reconstruction of speech RT-MRI with 10-fold training time reduction and comparable NRMSE, PSNR, and SSIM. This may be generalized to other dynamic reconstructions.
Introduction
Training of supervised deep-learning (DL) is computationally expensive and requires millions of input-output pairs. Larger and more diverse training data generally leads to better performance and reduces the likelihood of overfitting. Imaging tasks in computer vision tasks have extremely large datasets with high variation and better generalizability and have led to breakthroughs. MRI datasets, however, are many orders of magnitude smaller1,2. Dynamic MRI has a large temporal dimension, with many frames having comparable content. For example, frames from mid-diastole for cardiac imaging or a neutral resting posture for speech imaging. This calls to question the value of training on all frames (> 10,000) from reference data. This work explores intelligent curation of the training set, with the goal of substantially reducing training time.Methods
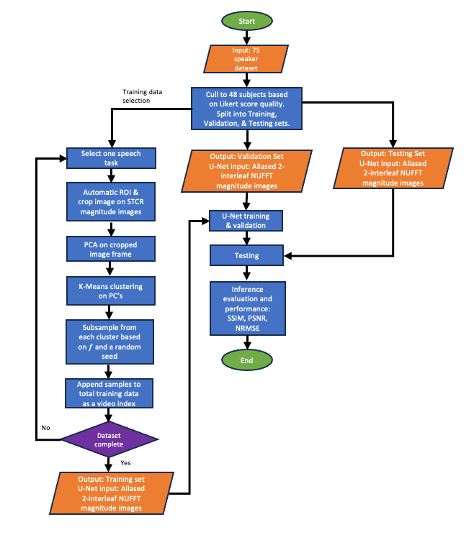
We use the multispeaker RT-MRI open dataset3 and the reference reconstruction: spatio-temporal constrained reconstruction (STCR)4. Speech tasks of stimuli 5-103 were used, due to their resemblance of natural human speech. The first ~4 seconds (400 frames) of each video was removed to eliminate artifacts from the transient approach to steady state. Figure 1 shows the flowchart of the training data selection process. 75 subjects were reduced to 48 subjects using Likert scores of 4 and 5 in aliasing and SNR. Training, validation, and testing were split by 34/7/7 subjects. For video SNR, a rating of 4 and 5 corresponds to very good and excellent, respectively. For aliasing artifacts, a score of 4 and 5 corresponds to mild and none, respectively.Pose Space Analysis
The frames from each video are vectorized and stacked into a matrix of size $$$N_{pixel} \times N_{time}$$$. Principal component analysis (PCA) is performed on the matrix and reduced to 10 components. This was chosen empirically after applying singular value decomposition (SVD) to over 10 subjects and 10 tasks and plotting sorted singular values and choosing a value slightly higher than the “elbow.” K-Means is then applied to the PCA-reduced matrix using 100 clusters. 100 clusters were chosen to appropriately capture inter-cluster variability per speech task. A fraction $$$f=10\%$$$ was selected at random from each cluster, totaling $$$fN_{time}$$$, where $$$N_{time}$$$ is the total frames.
DL Reconstruction
Figure 2 shows U-Net5 DL architecture with aliased input images. The U-Net was trained with an MSE-Loss function and Adam optimizer with an initial learning rate of 0.001. It was trained for 20 epochs using a learning rate scheduler that reduces the rate by 0.1 every 3 epochs or until no further improvement in validation scores.
Performance Analysis
To account for randomness in the sample selection, six training instances were performed, and an average and standard deviation was calculated for each metric. Testing was performed on full-length speech tasks to compare with the non-subsampling trained U-Net. Reported image quality metric values were structural similarity (SSIM), normalized-root-mean-square-error (NRMSE), and peak-signal-to-noise-ratio (PSNR).
Results
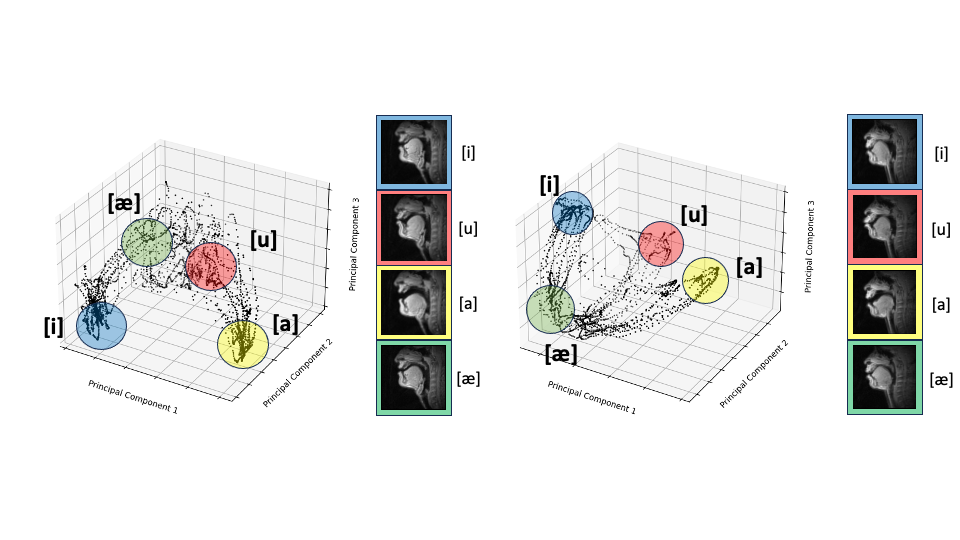
Figure 3 shows the linguistic meaning of the principal components, which can be shown to resemble a vowel quadrilaterial6 and their corresponding vocal configurations. Annotations were provided with the guidance of a professional linguist.Figure 4 shows a representative comparison of the DL input (with substantial aliasing), various U-Net trained reconstructions, and the reference STCR reconstruction, from the test set.
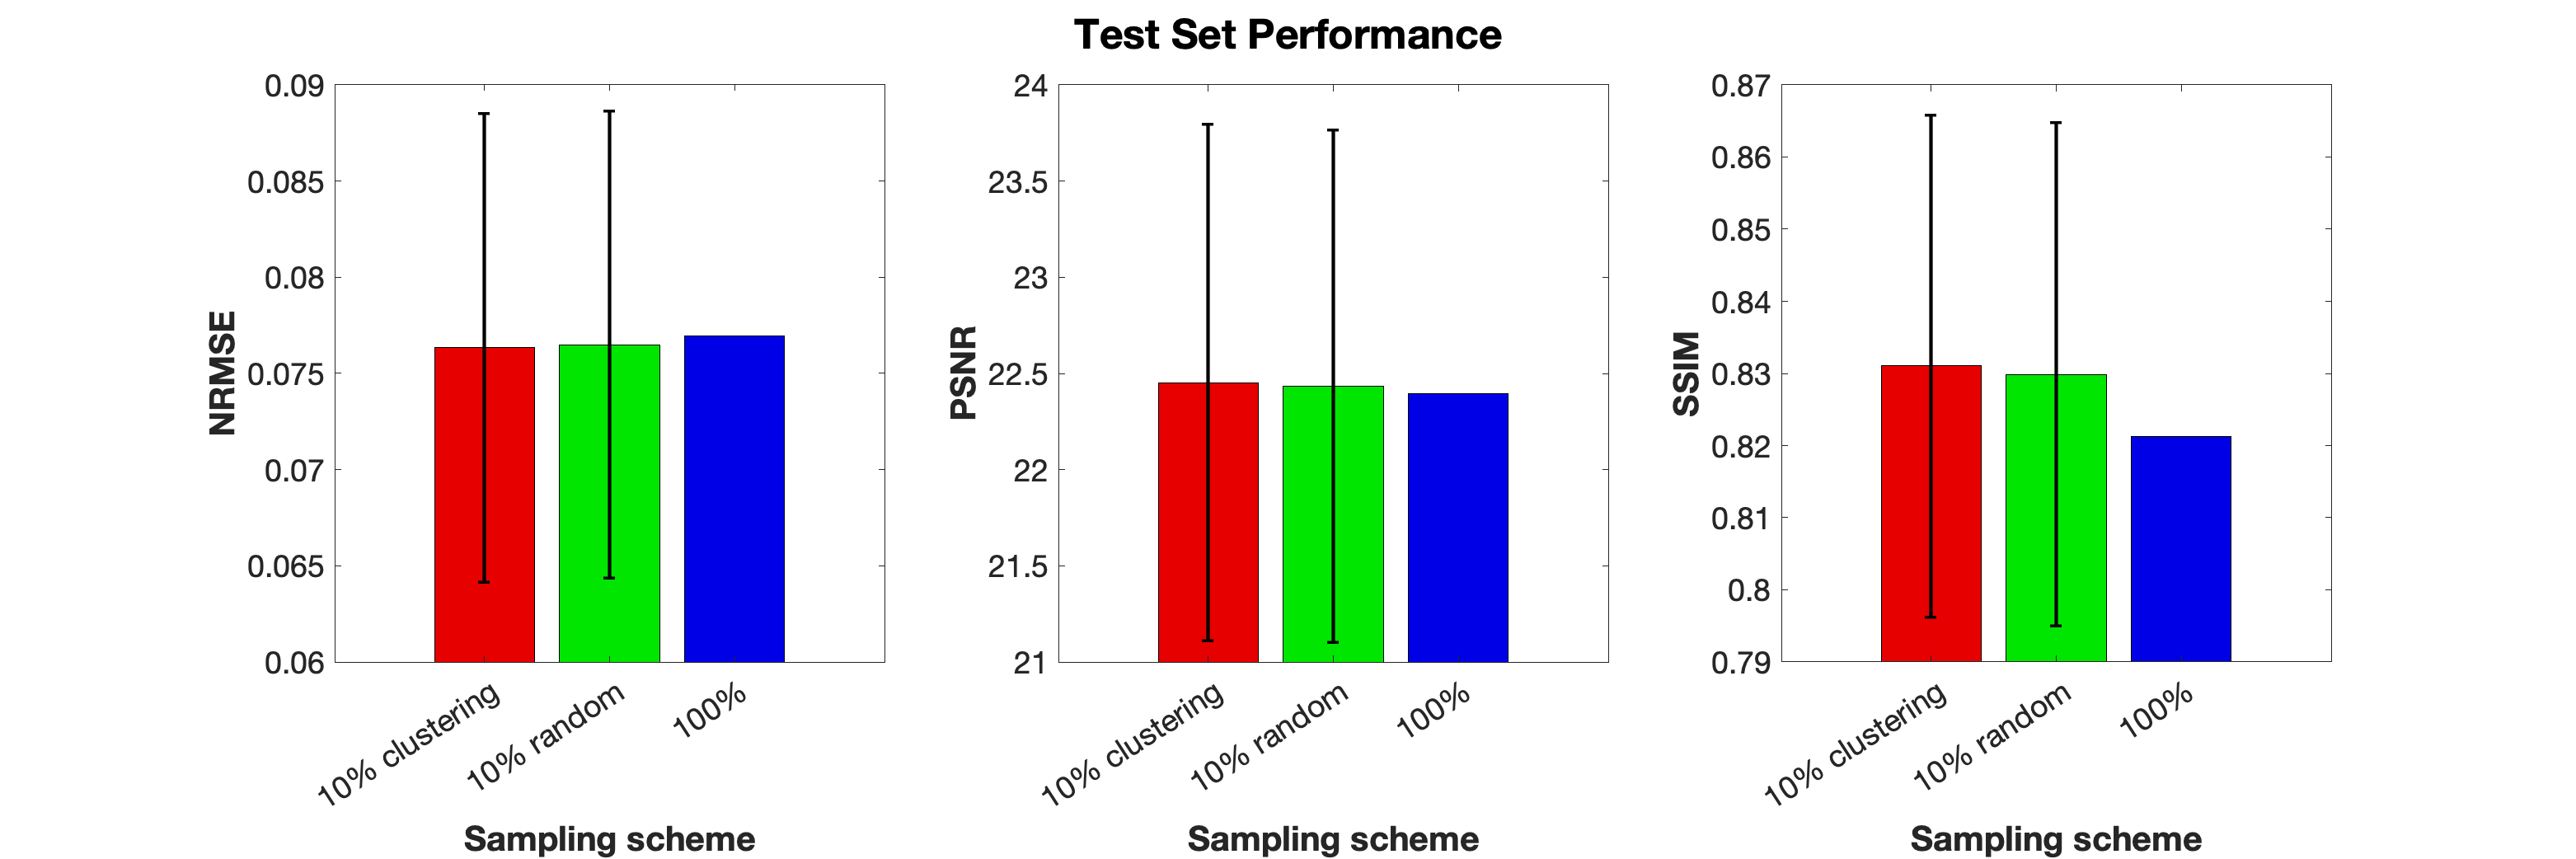
Figure 5 shows the test-set comparisons between 10% clustering sampled, 10% randomly sampled, and 100% sampled data trained U-Net. There was no substantial visual difference among the U-Net reconstructions. Subsampling (clustering and random) training required approximately 4 hours each. 100% sampled data training required 37 hours of training.
Discussion
Clustering is not perfect for dynamic speech MRI due to the nonperiodic motions and aspects of speech. If a task has high, unstructured movement in speech, intra-cluster-variability is much higher compared to highly scripted speech (i.e., reading from a passage vs. repeated vowel-consonant-vowel sounds3).We observed no statistically significant difference between U-Net trained with the curated dataset (10% clustering) versus the full dataset, but training time decreased by nearly a factor of 10.
Clustering may work well for periodic motions, which can be advantageous for dynamic cardiac MRI. We hypothesize that images can be subsampled with respect to an ECG signal to yield high variance training samples.
Conclusion
We have shown that by selecting a subset of the entire multispeaker training data, supervised DL-reconstruction can have comparable performance with substantial reduction in training time.Acknowledgements
We acknowledge grant support from the National Institutes of Health (U01-HL167613) and National Science Foundation (#1828736) and research support from Siemens Healthineers.References
- N. Kiryati and Y. Landau, “Dataset growth in medical Image Analysis research,” Journal of Imaging, vol. 7, no. 8, p. 155, Aug. 2021, doi: 10.3390/jimaging7080155.
- G. Varoquaux and V. Cheplygina, “Machine learning for medical imaging: methodological failures and recommendations for the future,” Npj Digital Medicine, vol. 5, no. 1, Apr. 2022, doi: 10.1038/s41746-022-00592-y.
- Lim, Y., Toutios, A., Bliesener, Y. et al. A multispeaker dataset of raw and reconstructed speech production real-time MRI video and 3D volumetric images. Sci Data 8, 187 (2021). https://doi.org/10.1038/s41597-021-00976-x
- G. Adluru, C. McGann, P. Speier, E. Kholmovski, A. M. Shaaban, and E. DiBella, “Acquisition and reconstruction of undersampled radial data for myocardial perfusion magnetic resonance imaging,” Journal of Magnetic Resonance Imaging, vol. 29, no. 2, pp. 466–473, Jan. 2009, doi: 10.1002/jmri.21585.
- O. Ronneberger, P. Fischer, and T. Brox, “U-NET: Convolutional Networks for Biomedical Image Segmentation,” in Lecture Notes in Computer Science, 2015, pp. 234–241. doi: 10.1007/978-3-319-24574-4_28.
- V. Berisha, S. Sandoval, R. L. Utianski, J. Liss, and A. Spanias, “Characterizing the distribution of the quadrilateral vowel space area,” Journal of the Acoustical Society of America, vol. 135, no. 1, pp. 421–427, Jan. 2014, doi: 10.1121/1.4829528.
- J. Heerfordt et al., “Similarity‐driven multi‐dimensional binning algorithm (SIMBA) for free‐running motion‐suppressed whole‐heart MRA,” Magnetic Resonance in Medicine, vol. 86, no. 1, pp. 213–229, Feb. 2021, doi: 10.1002/mrm.28713.
Figures