4483
Analytical solution of the Bloch-McConnell equations for steady-state CEST Z-spectra1Radiology, University of Illinois - Chicago, Chicago, IL, United States
Synopsis
Keywords: CEST / APT / NOE, CEST & MT, Exchange rate quantification
Motivation: Fitting CEST-MRI spectra using numerical methods is currently a time-consuming process, involving various approximations for initial parameters to expedite the process.
Goal(s): We aimed to derive the exact analytical expression for CEST Z-spectra of a two-pool exchange system.
Approach: We directly solved the Bloch-McConnell differential equations in matrix form for a two-pool exchange system to determine water magnetization under a steady-state saturation over the entire Z-spectrum.
Results: The analytical solution accurately reproduces spectra obtained through numerical methods. It allows fitting for physical parameters of the exchange system (like the exchange rate) as demonstrated by fitting simulated CEST spectra.
Impact: The analytical solution significantly reduces fitting time compared to the numerical methods used for fitting CEST Z-spectra. This solution has been demonstrated for the determination of physical parameters in the exchange system with fewer assumptions.
Background and Purpose
CEST spectra are commonly described using the Bloch-McConnell equations, and numerical solutions to these equations have been developed [1-3]. While numerical computations are valuable for simulations, they tend to be time-consuming and require extensive experience for Z-spectral fittings [4-6]. In response to the challenges of Z-spectral analysis, various approximations have been proposed [7-15]. The most prevalent approach involves asymmetry analysis of CEST spectra with respect to the water proton resonance. This method assumes that contaminating effects on the CEST signal are symmetric, making it inadequate for addressing contaminations caused by intrinsic asymmetric effects like semi-solid magnetization transfer (MT). Another commonly used quantification method is the multicomponent CEST Z-spectral fitting, which models the Z-spectrum as a sum of Lorentzian functions corresponding to the exchanging components [16-18].In this study, we have derived an analytical solution for the Bloch-McConnell equations pertaining to steady-state Z-spectra. With this precise mathematical expression for Z-spectra in two-pool exchange systems, we will demonstrate direct Z-spectral fitting and compare it with numerical solutions.
Theoretical considerations and Methods
The analytical solution for the Bloch–McConnell equations in a steady-state two-pool exchange system is obtained by directly solving the set of differential equations in matrix form for the inverse matrices' components. We derive this analytical solution for steady-state CEST Z-spectra by directly solving for the steady-state magnetization of water (pool a), denoted as $$$ \frac{M_{z,ss}^a}{M_0^a}=\frac{M_z^a (t_{sat}=∞)}{M_0^a} $$$ as a function of the saturation offset, denoted as $$$ω≡X$$$.Results
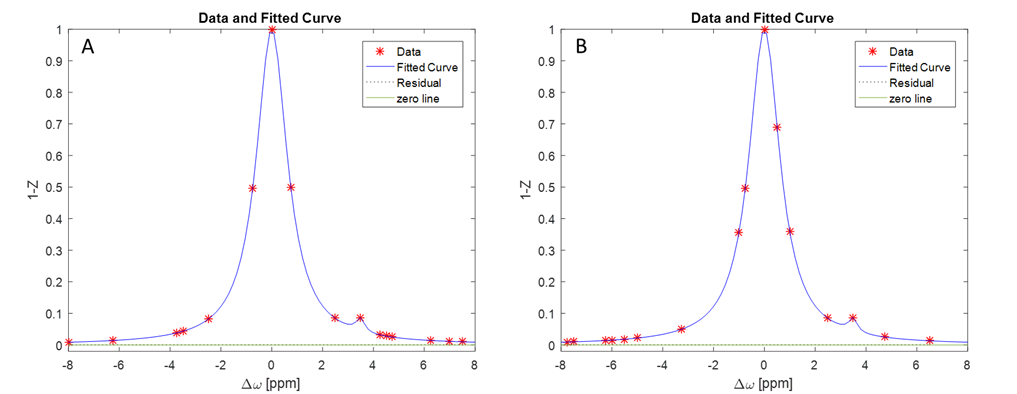
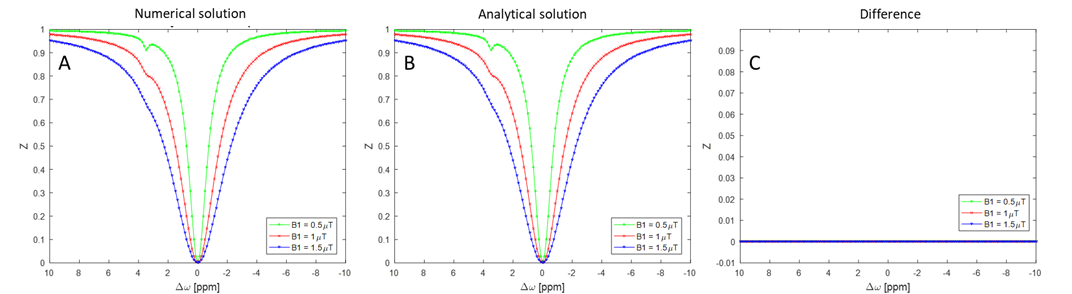
The analytic form of the steady-state Z-spectrum in a two-pool exchange system is obtained as the equation: $$ 1-Z(X)=\frac{ω_1^2 (AX^2-Bω_b X+C)} {DX^2 (X-ω_b )^2+(E+Fω_1^2 ) X^2-(Gω_1^2+H) ω_b X+I} $$ Here, ω1 is the intensity of the saturation pulse, ωb is the Larmor frequency of the exchangeable protons (all terms involving ω are in units of rad/s), and the capital letters denote constants that encompass various contributions from the physical parameters of the pools, including exchange rates, proton concentrations, saturation parameters, and relaxation rates. This analytical solution incorporates both exchange and saturation parameters.We compared and validated the analytic solution for steady-state Z-spectra with the numerical solutions derived from the Bloch–McConnell equations under prolonged saturation. The analytical solution accurately reproduces the spectra obtained through numerical methods for the steady-state magnetization of two exchanging pool systems (Fig. 1-2). Through direct fitting of the simulated CEST spectra with this analytical solution, we demonstrated the determination of the physical parameters of the exchange system (Fig. 3). Furthermore, the analytical solution allows the fitting of sparsely sampled Z-spectra to reconstruct complete spectra.
Additionally, we confirmed that the exact solution of a Z-spectrum can be approximated by the summation of multi-pool components in the form of Lorentzian functions. We also derived and discussed the analytical solution for three-pool Z-spectra in a similar manner.
Discussion and conclusion
Previously, there was no straightforward analytical solution available for the Bloch-McConnell equations to accurately describe and fit entire Z-spectra. Instead, fitting methods based on numerical solutions were commonly used. These methods involve calculating pool magnetization under CEST conditions using ordinary differential equations [2, 19, 20]. However, these numerical methods had a major drawback in terms of processing time. On a typical desktop computer, fitting a single Z-spectrum could take up to an hour [5, 6]. The primary reason for this extended duration is the computational cost associated with repeatedly computing matrix inversions for every saturation frequency offset during each iteration of the Z-spectrum fitting algorithm. In contrast, the analytic fitting method presented in this paper involves computing the matrix inversion only once to obtain the analytical solution for the Z-spectrum. With this analytical solution, the fitting algorithm requires rapid iterations using straightforward arithmetic computations. As a result, in contrast to numerical solution-based fitting, which can take up to an hour [5, 6], the analytical solution significantly reduces the fitting time to seconds.In summary, our derived analytic solution for steady-state Z-spectra can accurately and rapidly fit Z-spectrum data. The exact solution of a Z-spectrum can be approximated as the sum of multi-pool components in the form of Lorentzian functions, supporting the Lorentzian line shape for CEST peaks in Z-spectra. This analytical solution provides a valuable tool for Z-spectral analysis and the direct assessment of physical parameters, including the exchange rate and the exchangeable proton concentration. It also facilitates the reconstruction of the full CEST spectrum from limited data points, potentially reducing acquisition time.
Acknowledgements
This work is supported by the NIH grants R01DK135772 and R01CA283548.References
[1] P. Z. Sun, "Simplified and scalable numerical solution for describing multi-pool chemical exchange saturation transfer (CEST) MRI contrast," Journal of magnetic resonance, vol. 205, no. 2, pp. 235-241, 2010. [2] D. E. Woessner, S. Zhang, M. E. Merritt, and A. D. Sherry, "Numerical solution of the Bloch equations provides insights into the optimum design of PARACEST agents for MRI," Magnetic Resonance in Medicine: An Official Journal of the International Society for Magnetic Resonance in Medicine, vol. 53, no. 4, pp. 790-799, 2005. [3] J. Zhou, D. A. Wilson, P. Z. Sun, J. A. Klaus, and P. C. Van Zijl, "Quantitative description of proton exchange processes between water and endogenous and exogenous agents for WEX, CEST, and APT experiments," Magnetic Resonance in Medicine: An Official Journal of the International Society for Magnetic Resonance in Medicine, vol. 51, no. 5, pp. 945-952, 2004. [4] M. A. Chappell et al., "Quantitative Bayesian model‐based analysis of amide proton transfer MRI," Magnetic resonance in medicine, vol. 70, no. 2, pp. 556-567, 2013. [5] T. Li, A. Kotrotsou, S. Zhang, K. Jones, and M. Pagel, "Improving the Bloch Fitting Method for the Analysis of acidoCEST MRI." [6] O. E. Mougin, R. Coxon, A. Pitiot, and P. A. Gowland, "Magnetization transfer phenomenon in the human brain at 7 T," Neuroimage, vol. 49, no. 1, pp. 272-281, 2010. [7] D. Abergel and A. G. Palmer, "Approximate solutions of the bloch–mcconnell equations for two‐site chemical exchange," ChemPhysChem, vol. 5, no. 6, pp. 787-793, 2004. [8] D. Woessner, "Nuclear transfer effects in nuclear magnetic resonance pulse experiments," The Journal of Chemical Physics, vol. 35, no. 1, pp. 41-48, 1961. [9] J. Leigh Jr, "Relaxation times in systems with chemical exchange: Some exact solutions," Journal of Magnetic Resonance (1969), vol. 4, no. 3, pp. 308-311, 1971. [10] O. Trott, D. Abergel, and A. G. Palmer Iii, "An average-magnetization analysis of R 1ρ relaxation outside of the fast exchange limit," Molecular Physics, vol. 101, no. 6, pp. 753-763, 2003. [11] D. Davis, M. Perlman, and R. London, "Direct measurements of the dissociation-rate constant for inhibitor-enzyme complexes via the T1ρ and T2 (CPMG) methods," Journal of Magnetic Resonance, Series B, vol. 104, no. 3, pp. 266-275, 1994. [12] J. Carver and R. Richards, "A general two-site solution for the chemical exchange produced dependence of T2 upon the Carr-Purcell pulse separation," Journal of Magnetic Resonance (1969), vol. 6, no. 1, pp. 89-105, 1972. [13] J. Jen, "Chemical exchange and NMR T2 relaxation—the multisite case," Journal of Magnetic Resonance (1969), vol. 30, no. 1, pp. 111-128, 1978. [14] K. Murase and N. Tanki, "Numerical solutions to the time-dependent Bloch equations revisited," Magnetic resonance imaging, vol. 29, no. 1, pp. 126-131, 2011. [15] M. Zaiss and P. Bachert, "Chemical exchange saturation transfer (CEST) and MR Z-spectroscopy in vivo: a review of theoretical approaches and methods," Physics in Medicine & Biology, vol. 58, no. 22, p. R221, 2013. [16] M. Zaiss, B. Schmitt, and P. Bachert, "Quantitative separation of CEST effect from magnetization transfer and spillover effects by Lorentzian-line-fit analysis of z-spectra," Journal of Magnetic Resonance, vol. 211, no. 2, pp. 149-155, Aug 2011, doi: 10.1016/j.jmr.2011.05.001. [17] M. S. Zaiss, B.; Stieltjes, B.; Bachert, P, "Enhancement of MT and CEST contrast via Heuristic fitting of Z-spectra," in Proceedings of the 20th Annual Meeting ISMRM;, Melbourne, Australia, 2012, p. 5136. [18] K. Cai et al., "CEST signal at 2ppm (CEST@2ppm) from Z-spectral fitting correlates with creatine distribution in brain tumor," NMR Biomed, vol. 28, no. 1, pp. 1-8, Jan 2015, doi: 10.1002/nbm.3216. [19] H. H. Cornnell, Optimization of contrast agents for high magnetic fields. University of Florida, 2009. [20] A. X. Li, R. H. Hudson, J. W. Barrett, C. K. Jones, S. H. Pasternak, and R. Bartha, "Four‐pool modeling of proton exchange processes in biological systems in the presence of MRI–paramagnetic chemical exchange saturation transfer (PARACEST) agents," Magnetic Resonance in Medicine: An Official Journal of the International Society for Magnetic Resonance in Medicine, vol. 60, no. 5, pp. 1197-1206, 2008.Figures
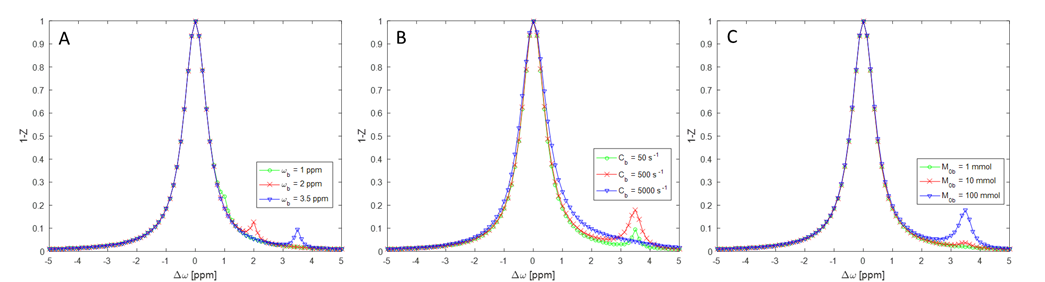
CEST Z-spectra calculated using the analytical solution for a two-pool exchanging system with T1a=2 s, T2a=0.1 s, T1b=1 s, T2b=0.1 s, M0a=110 mol, and B1=1μT saturation power. The saturation pulse frequency offsets were set to span from -5 to 5 ppm (@9.4T) in 0.125 ppm increments.
A) The effect of changing the
exchangeable protons offset, set to 1, 2 & 3.5 ppm. [Cb=50
s-1 & 1/fb=1100]
B) The effect of changing the
exchange rate values, set to Cb=50,
500 & 5000 s-1. [ωb=3.5
ppm & 1/fb=1100]
C) The effect of changing proton concentration values, set to M0b=
1, 10, 100 mmol. [ωb=3.5 ppm & Cb=500 s-1]
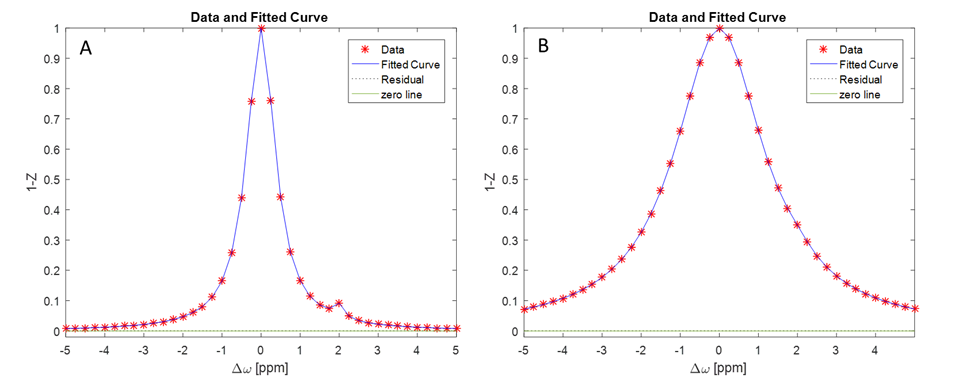
Cb: 30 / 29.9 / 30.1 s-1; 1/f: 1125 / 1105 / 1118; T1a: 2 / 1.9665 / 1.9825 s; T2a: 0.115 / 0.1130 / 0.1139 s; T1b: 1 / 1.0012 / 0.996694 s; T2b: 0.033 / 0.033 / 0.0328 s; ωb: 2 / 2 / 2 ppm; ω1: 42.6 / 42.6 / 42.6 Hz.