4482
A scanner-inline software for performing permuted random forest for CEST frequency importance analysis1Center for Biomedical Imaging Research, Department of Biomedical Engineering, Tsinghua University, Beijing, China
Synopsis
Keywords: CEST / APT / NOE, CEST & MT
Motivation: CEST quantitation typically relies on model-based fitting and always performs off-scanner. Besides, model-based fitting requires collection a number of saturation frequencies, hindering the clinical applications.
Goal(s): To facilitate CEST applications by implementing a scanner-inline software through model-free analysis.
Approach: We implemented CEST frequency importance analysis on Philips pride platform, which could rank the acquired frequencies according their contribution to lesion classification, using a permuted random forest algorithm.
Results: Without specific requirement for sampled frequencies, this software allows researchers to extract frequency importance feature, either between lesion voxels and control ones, or between two different time points or different subjects.
Impact: Compared with the conventional analysis based on fitting line-shape of the spectra, this PRF method does not have specific requirement for sampled frequencies on spectra, but fully explore all acquired ones, which is user-friendly and facilitate CEST applications.
1. Introduction
CEST is a promising and powerful tool that allows sensitively detection of metabolic changes caused by diseases such as cancer and ischemia1. Current clinical CEST protocols, termed as Amide proton transfer(APT), could only derive one contrast map (APTw) using asymmetric analysis. More dedicate analysis could be achieved by fitting the lineshape of Z-spectra, but require densely-sampled saturation offsets. Previously we introduced a model-free analysis method, featuring fully-usage of acquired saturation frequency by treating the acquired CEST series from each voxel as a sample, and then ranking the frequency importance according to a permute random forest (PRF) algorithm2. This method proved useful in predict H3K27 gene expression in glioma patients3. Therefore, there is a need for an inline software on scanner, which could be used friendly right after the scans and may facilitate the CEST applications.2. Methods
2.1 Permuted random forest (PRF) on CESTPermuted random forest is a machine learning-based method, which trains and predicts samples using multiple trees. In PRF-CEST, we label lesion group as “1” and control group as “0” by drawing ROIs manually or loading a ROI file, then the sampled Z-spectra data is used for permuted random forest analysis.
2.2 Design and Implementation of the Software
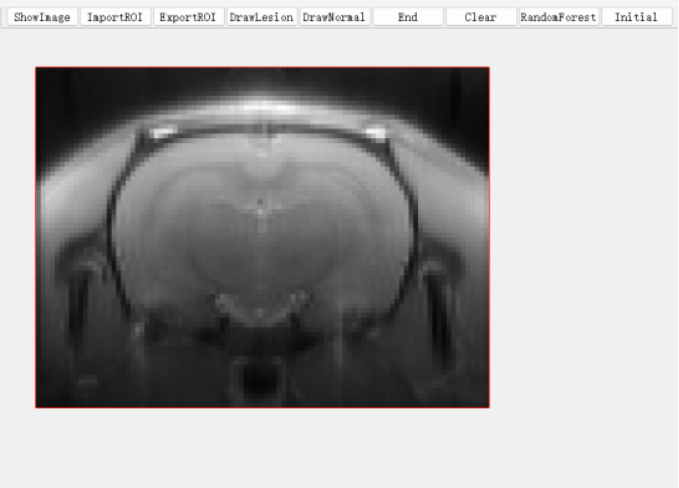
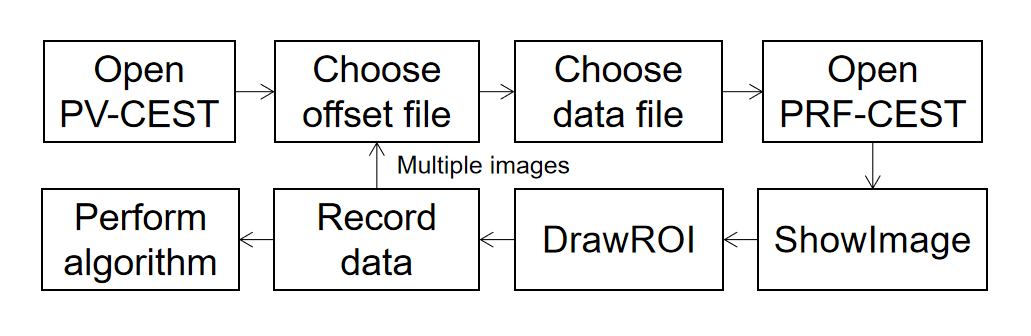
This software is compiled using Python 3.9 with PyQt5 and runs in PRIDE 2.0 on Philips scanner, embedded in the construction we developed for post-processing and visualization of CEST (PV-CEST)4. A page was designed to display medical images and draw ROIs. The main page of PRF-CEST and the workflow is shown in Fig.1&2. As seen in Fig.2, the workflow includes image viewing, ROI drawing, and Data analysis. Researchers can load and observe images on this page, draw ROIs on lesion group and control group respectively, and perform permuted random forest on data. Notably, PRF-CEST can be compared and analyzed either on a single image or multiple images. After the analysis is completed, the frequency feature importance ranking chart is displayed and saved.
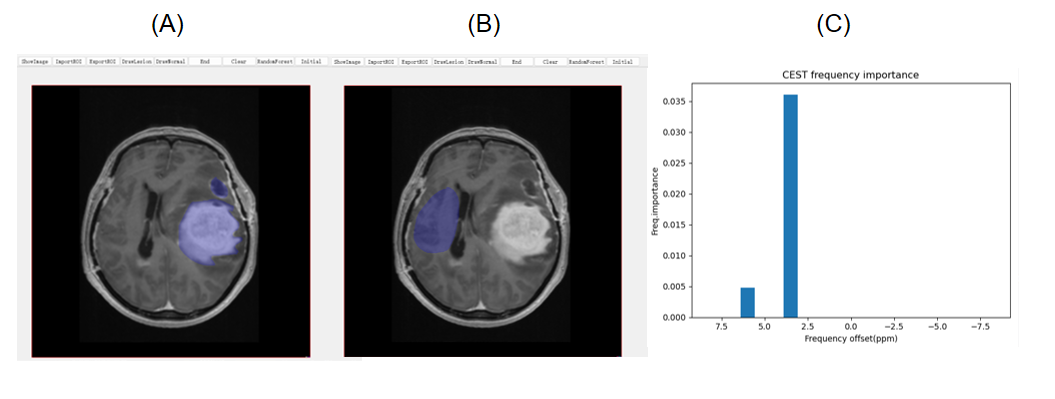
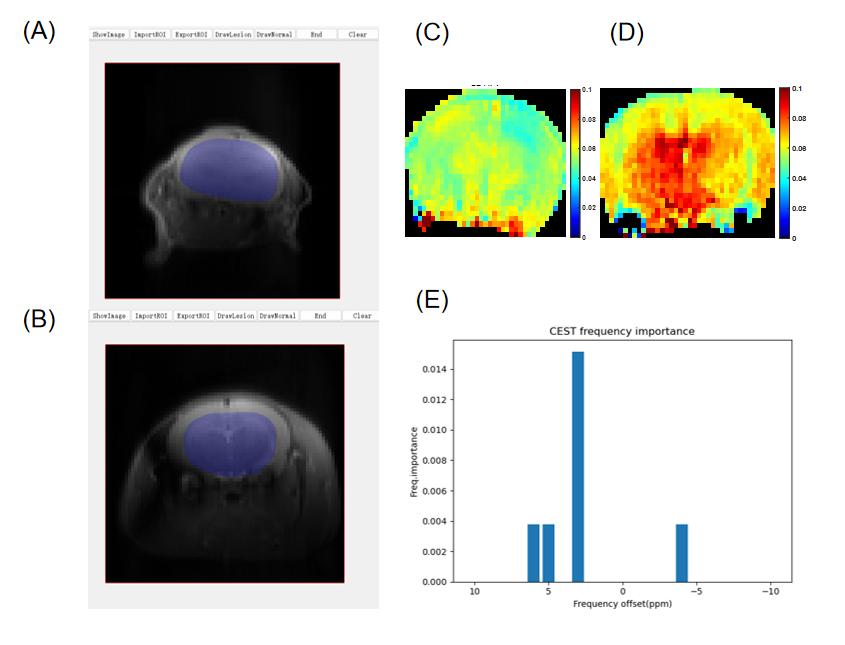
Fig. 3&4 displays the verification of this software. Fig. 3 shows the case of comparison on a single image, that is between disease areas and normal areas in the same brain layer of recurrent glioblastoma patient, with maximum contribution at 3.5ppm. Fig. 4 shows the case of comparison on multiple images, a newborn rat’s brain layer at 1th week and at 5th week, with maximum contribution at 3.5ppm. This is consistent with the result of LDamide maps, which indicates PRF could become a powerful clinical tool.
2.3 Workflow
2.3.1 Image viewing
After entering the software homepage, select the frequency file and open the CEST data file, then enter the PRF-CEST interface to display the image and load the data.
2.3.2 ROI drawing
Draw the ROI of the lesion area/normal area manually on the image. When the left mouse button is pressed, the drawing of ROI automatically tracks the movement of the mouse. After releasing the left mouse button, the start and end points of ROI are automatically connected, and points inside the ROI are selected for recording. In the process, users are allowed to use right mouse button to clear the drawn ROI, import/export ROI or clear all the data recorded. The Z-spectrum data of the ROI area after drawing is recorded.
2.3.3 Data analysis
Perform PRF analysis on the data and an image would be displayed after performing the permuted random forest algorithm excluding frequency offset between -0.5ppm and 0.5ppm. Users are able to choose the frequency offset needed to display and perform comparative analysis on single or multiple images by loading various images.
3. Discussion
We have developed an inline model-free software tool that can directly use permuted random forest to analyze CEST frequency importance and validated the functionality of the software using rat brain data. Experimenters could draw ROIs to choose areas as needed and perform comparative analysis either on single images or on multiple images from various subjects by using raw data without fitting, which improves the efficiency of data analysis. The way of manually drawing ROI improves the flexibility and operability of data. In the future, we can further cooperate with hospitals and other institutions to play a role in practical fields.4. Conclusion
PRF-CEST provides a method of drawing ROI manually to perform permuted random forest analysis for frequency importance, which accelerates analysis efficiency, facilitates researchers to make judgments, and has potential applications.Acknowledgements
This work is partially supported by National Key R&D Program of China 2022YFC3602500,2022YFC3602503 and National Natural Science Foundation of China (NSFC) (Nos. 82071914).References
1. Zhou J, et al. Review and consensus recommendations on clinical APT-weighted imaging approaches at 3T: Application to brain tumors. Magn Reson Med. 2022 Aug;88(2):546-574.
2. Chen Y, Dang X, Zhao B, Chen Z, Zhao Y, Zhao F, Zheng Z, He X, Peng J, Song X. Frequency importance analysis for chemical exchange saturation transfer magnetic resonance imaging using permuted random forest. NMR Biomed 2022;e4744.
3. Chen Y, Zhao B, Zheng Z, Song X. Assessing the predictability of the H3K27M status in diffuse glioma patients using frequency importance analysis on chemical exchange saturation transfer MRI. Magn Reson Imaging. 2023;103:54-60.
4. Liu C, Wang Y, Chen Z, Zhang Y, Song X. A Software Tool for Inline Post-processing and Visualization of Chemical Exchange Saturation Transfer (PV-CEST) on 3T Scanner. 2022 ISMRM Annual Proceeding .London, UK; #2783.
Figures