4481
Motion-induced B1+-changes in dynamic glucose enhanced (DGE) MRI and how to remedy them.1Department of Medical Radiation Physics, Lund University, Lund, Sweden, 2Department of Neuroimaging, King’s College London, London, United Kingdom, 3Lund University Bioimaging Centre, Lund University, Lund, Sweden, 4Department of Radiology, Johns Hopkins University School of Medicine, Baltimore, MD, United States, 5F.M. Kirby Research Center for Functional Brain Imaging, Kennedy Krieger Institute, Baltimore, MD, United States, 6Department of Medical Imaging and Physiology, Skåne University Hospital, Lund, Sweden, 7Department of Radiology, Lund University, Lund, Sweden, 8Department of Neurology, Johns Hopkins University School of Medicine, Baltimore, MD, United States
Synopsis
Keywords: CEST / APT / NOE, Brain, Motion Correction
Motivation: Motion-induced B1+-changes at the voxel level result in erroneous dynamic glucose enhanced (DGE) MRI effects.
Goal(s): To investigate effects of motion-induced B1+-changes on DGE MRI and to address removing them.
Approach: A volunteer changed head positions, and voxel-based B1+ was measured pre- and post-motion. Z-spectra with and without D-glucose infusion were simulated, with and without the measured B1+-changes.
Results: Slight motion-induced B1+-alterations lead to pseudo-CEST effects comparable to DGE effects. These can be removed by acquiring a full Z-spectrum and using the asymmetry of the glucoCEST signal relative to the water frequency to assess the DGE signal changes.
Impact: Motion-induced B1+-changes affect DGE signals, thus causing pseudo-CEST effects that complicate clinical interpretation. These effects can be overcome by acquiring a full Z-spectrum and exploiting the asymmetry of the glucoCEST signal changes relative to the water frequency.
Introduction
Dynamic glucose-enhanced (DGE) MRI is a promising chemical exchange saturation transfer (CEST) method, which involves intravenous administration of natural sugar, D-glucose, during dynamic glucoCEST imaging. The signal response curve contains information about D-glucose delivery, uptake, and metabolism. [1-8] However, it has been shown that motion can cause pseudo-CEST effects due to dynamic B0-changes and tissue mixing, complicating the path towards clinical translation. [9,10] Nevertheless, these challenges are well understood, and methods are emerging to mitigate pseudo-CEST effects using advanced retrospective or prospective motion correction or approaches insensitive to B0-changes as shown recently in direct saturation (DS)-DGE MRI. [11] To our knowledge, the effect of motion-induced dynamic changes in the B1+-field on the glucoCEST signal has not been investigated so far. In this study, we assess the changes in glucoCEST signal caused by motion-induced B1+-changes at the voxel-level at 3T and 7T using a combination of in vivo data and simulations. In addition, we suggest a simple solution to correct for these effects.Methods
This study was approved by the local ethics committee and written informed consent was obtained from the participant. One healthy volunteer was scanned at 3T with a body coil transmit and a 20-channel receive head coil (MAGNETOM Prisma, Siemens Healthineers, Forchheim, Germany). B1+-maps were acquired using a magnetization prepared turboFLASH sequence (TE=1.9 ms, TR=7370 ms, FA=80°, voxel size of 4.1×4.1×5.0 mm3). [13] The volunteer was instructed to keep still during acquisition and change head position between acquisitions. A series of 3 pitch (nodding) and 2 yaw (shaking) position changes was performed. The B1+-maps from the different acquisitions were smoothed and co-registered using a rigid transformation, and warped to the space of the first acquisition, similar to what was done in a similar study at 7T. [12] Skull stripping was performed and the change in B1+ ($$$ΔB1+$$$) in each voxel was estimated using the following equation:$$ΔB_{1}^{+}=\frac{{B_{1}^{+}},ref - B_{1}^{+},mov}{B_{1}^{+},ref}\cdot100$$
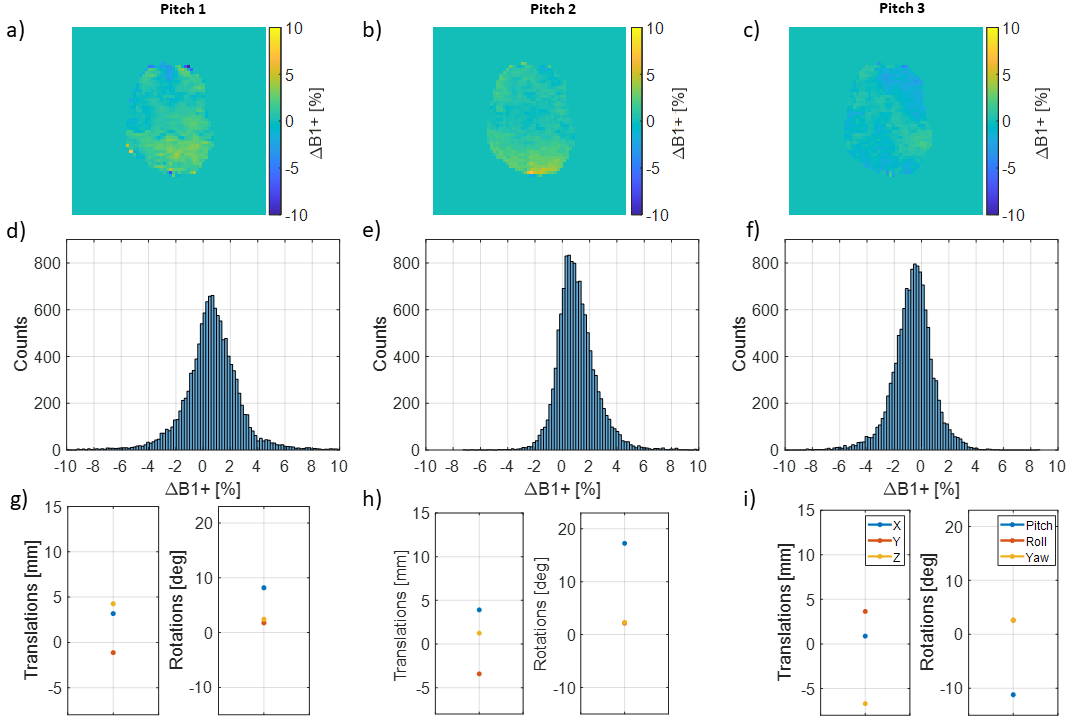
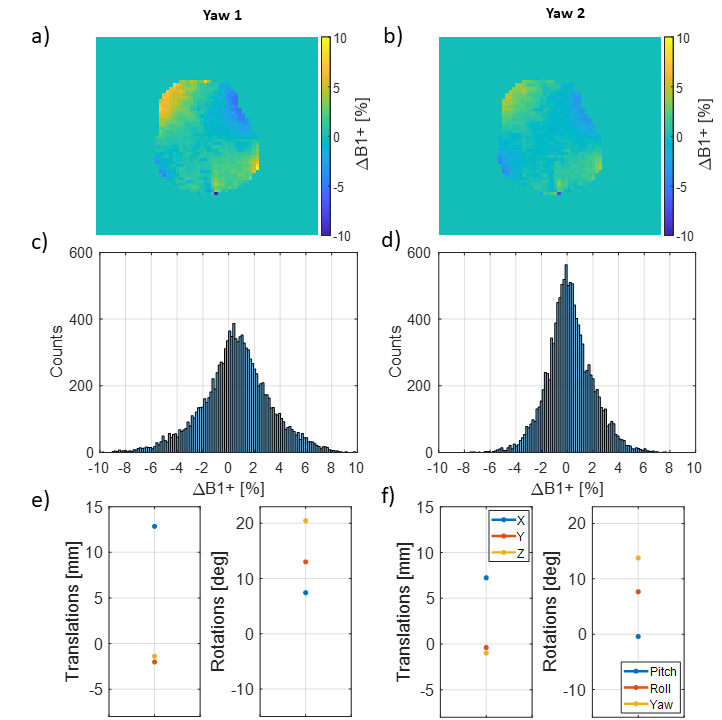
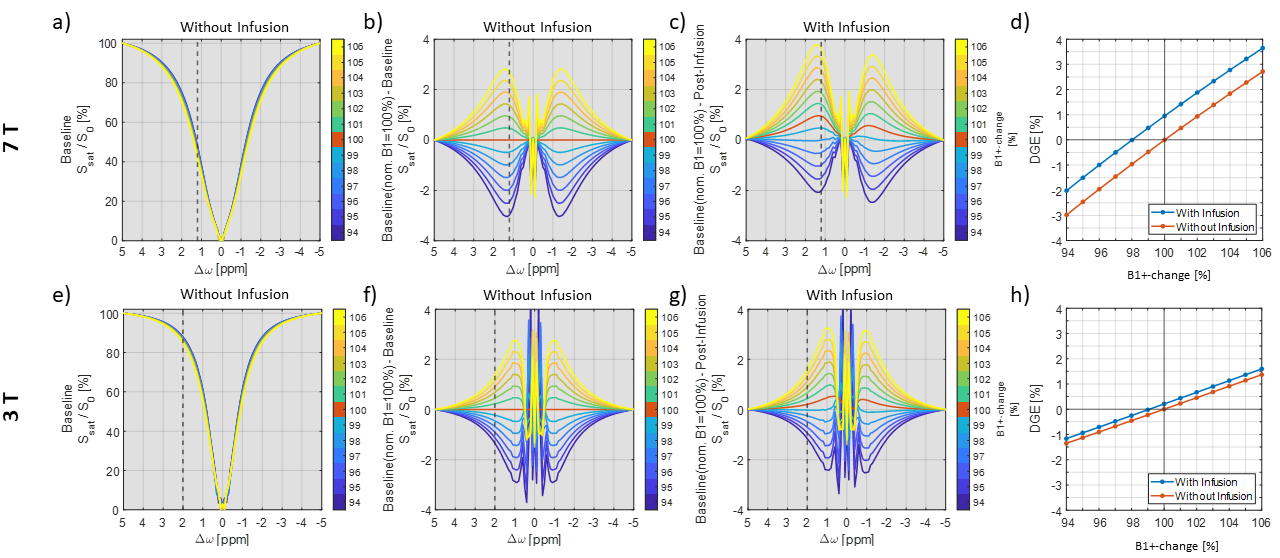
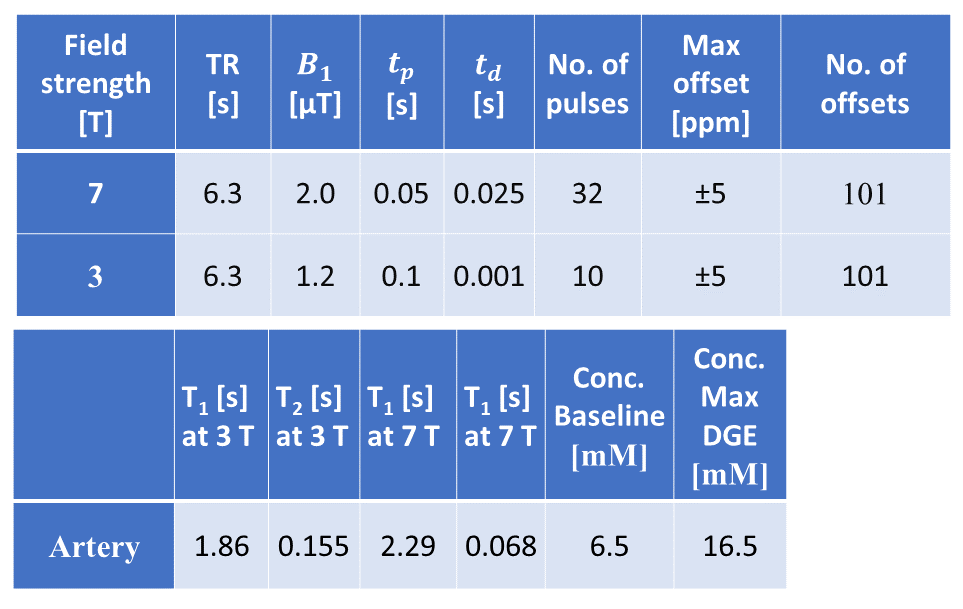
$$$B_{1}^{+},ref$$$ is the reference image to which the image $$$B_{1}^{+},mov$$$ was aligned. Histograms were created mapping the whole brain. Motion estimates and the corresponding $$$ΔB1+$$$-map of a transverse slice, also referred to as B1+-change, were plotted. Using the pulseqCEST toolbox, Bloch-McConnell simulations were performed for a standard 5-pool system containing a water pool, MTC pool and 4 glucose pools for 3T and 7T with the sequence and tissue parameters shown in Table 1. [2, 12] The B1+ varied from 94 % to 106 %. Difference Z-spectra were calculated, where the reference was the baseline Z-spectrum for a B1+ of 100 % subtracted by baseline Z-spectra with varying B1+. The same was performed with a post-infusion Z-spectrum and varying B1+. The DGE signal at 1.2 ppm for 7T and 2 ppm for 3T with and without infusion and varying B1+-changes was estimated.
Results and Discussion
Different B1+ patterns can be seen in the transverse slice direction, where the type of motion clearly governs the appearance (Figs. 1a-c, 2a-b). The larger the motion, the larger the B1+-change (Figs. 1a-c, 2a-b) with a shift of the center of the histogram (Figs. 1d-f, 2c-d). The smallest pitch movement (Figs. 1a, 1d, 1g) led to a shift of the $$$ΔB1+$$$ histogram’s center by about 1%. Positive and negative pitch movements also lead to negative and positive shifts of the histograms (Figs. 1e, f). Yaw movement resulted in the same order of B1+ change (Fig.2) but with a different appearance (Figs. 2a, 2b). The order of the observed changes agrees with changes found by MacLennan et al. [15] Even small changes of 1% in B1+ can lead to pseudo-DGE effects on the order of the true DGE effect at 3T (Figs. 3f, 3g, 3h). At 7T DGE effects are about 3 times as large, but B1+ effects due to motion are expected to increase with field strength (wavelength issue) (Figs. 3b, 3c, 3d). As a consequence, DGE experiments at a single frequency will suffer from inaccuracies when motion affects B1+ in the voxel (Figs. 3d, 3h). Fortunately, the glucoCEST effect for rapidly exchanging protons is asymmetric with respect to the water frequency and it should be possible to elucidate the true effect by acquiring full Z-spectra and using this asymmetry feature.Conclusion
B1+-changes due to motion cause changes in the direct water saturation of the Z-spectrum, resulting in pseudo-DGE effects. This can be addressed by using the fast-exchange-based asymmetry feature of glucoCEST effect in combination with the symmetry of the water signal.Acknowledgements
We thank Dr. Frederik Testud, Siemens Healthcare AB, Malmö, Sweden for collecting the experimental data used in this study.References
1. Xu X, Chan KW, Knutsson L, et al. Dynamic glucose enhanced (DGE) MRI for combined imaging of blood-brain barrier break down and increased blood volume in brain cancer. Magn Reson Med. 2015;74:1556-63.
2. Xu X, Yadav NN, Knutsson L, et al. Dynamic Glucose-Enhanced (DGE) MRI: Translation to Human Scanning and First Results in Glioma Patients. Tomography. 2015;1(2):105-14.
3. Schuenke P, Paech D, Koehler C, et al. Fast and Quantitative T1rho-weighted Dynamic Glucose Enhanced MRI. Sci Rep. 2017 Feb;7:42093.
4. Seidemo A, Lehmann PM, Rydhög A, et al. Towards more robust glucoCEST imaging in humans at 3 T: A study of the arterial input function and the effect of infusion time. NMR in Biomed. 2021;e4624.
5. Xu X, Sehgal AA, Yadav NN, et al. d-glucose weighted chemical exchange saturation transfer (glucoCEST)-based dynamic glucose enhanced (DGE) MRI at 3T: early experience in healthy volunteers and brain tumor patients. Magn Reson Med. 2020 Jul;84(1):247-262.
6. Knutsson L, Seidemo A, Rydhög Scherman A, et al. Arterial Input Functions and Tissue Response Curves in Dynamic Glucose-Enhanced (DGE) Imaging: Comparison Between glucoCEST and Blood Glucose Sampling in Humans. Tomography 2018;4(4):2379-1381.
7. Knutsson L, Xu X, van Zijl PCM, Chan KWY. Imaging of sugar-based contrast agents using their hydroxyl proton exchange properties. NMR Biomed. 2022 Jun 4:e4784.
8. Seidemo A, Wirestam R, Helms G, et al. Tissue response curve shape analysis of dynamic glucose enhanced (DGE) and dynamic contrast enhanced (DCE) MRI in patients with brain tumor. NMR Biomed. 2022 Oct 30:e4863
9. Zaiss M. Herz K. Deshmane A. et al. Possible artifacts in dynamic CEST MRI due to motion and field alterations. J Magn Reson. 2019;298:16-22.
10. Lehmann PM, Seidemo A, Andersen M, et al. A numerical human brain phantom for dynamic glucose-enhanced (DGE) MRI: On the influence of head motion at 3T. Magn Reson Med. 2023 May;89(5):1871-1887.. doi: 10.1002/mrm.29563
11. Van Zijl P. Yadav N. Mohammed Ali S. et al. Dynamic Glucose Enhanced MRI of Brain Tumors using Direct Water Saturation. In Proceedings of the 2023 ISMRM & ISMRT Annual Meeting & Exhibition. Abstract 2980
12. Lehmann PM. Wirestam R. Sundgren PC. et al. Dynamic Glucose Enhanced (DGE) MRI at 7 T: The influence of head motion on the B1+ field. Book of Abstracts ESMRMB 2023 Online 39th Annual Scientific Meeting 4–7 October 2023. https://doi.org/10.1007/s10334-023-01108-9. P143.
13. Chung S. Kim D. Breton E. et al. Rapid B1+ Mapping Using a Preconditioning RF Pulse with TurboFLASH Readout. Magn Reson Med. 2010;64:439–446.
14. Klein M. Staring K. Murphy M.A. et al. elastix: a toolbox for intensity based medical image registration. IEEE Transactions on Medical Imaging. 2019;29(1):196-205.
15. MacLennan T, Seres P, Rickard J, Stolz E, Beaulieu C, Wilman AH. Characterization of B1+ field variation in brain at 3 T using 385 healthy individuals across the lifespan. Magn Reson Med. 2022;87:960– 971. https://doi. org/10.1002/mrm.29011
Figures