4480
An efficient CEST workflow using joint optimization of sampling, reconstruction and quantification1Center for Biomedical Imaging Research, Department of Biomedical Engineering, Tsinghua University, Beijing, China
Synopsis
Keywords: CEST / APT / NOE, CEST & MT
Motivation: As an exciting ‘label-free' molecular imaging technique, CEST workflow is always time-consuming, because of the seconds-long TR and multiple frequency repetitions in acquisition, the iteration in reconstruction, and the pixel-by-pixel in B0 correction and quantification.
Goal(s): To achieve rapid and high-quality sampling, reconstruction and quantification of CEST-MRI.
Approach: We constructed a data-driven CEST framework, by joint optimization of k-space sampling, reconstruction and quantification.
Results: Retrospective experiments on human brain demonstrated the feasibility of combination with acceleration techniques including parallel imaging, compress sensing or deep learning, allowing 6X under-sampling rate and reconstruction of high-quality contrast maps in one second.
Impact: A data-driven CEST framework enabled joint optimization of k-space sampling,reconstruction and quantification. Retrospective experiments demonstrated that the the framework allows 6X under-sampling rate and reconstruction of high-quality contrast maps in one second. This one-stop workflow may facilitate more clinical needs.
1. Introduction
Chemical Exchange Saturation Transfer (CEST) MRI is an exciting ‘label-free’ molecular imaging technique that shows promise in clinical applications (1,2). It provides quantitative insights into endogenous solutes. Usually CEST MRI requires three independent parts to quantify targeted solutes: 1) collection of several saturation weighted k-space data. 2) a linear or non-linear reconstruction algorithm. 3) a post-processing technique. CEST workflow is always time-consuming, because of the seconds-long TR and multiple frequency repetitions in acquisition, the iteration in reconstruction, and the pixel-by-pixel in B0 correction and quantification. That hampers its widespread application in clinical.To address these challenges, we developed a data-driven CEST framework, which enabled a joint optimization of sampling, reconstruction and quantification. Retrospective experiments on human brain demonstrated the feasibility of combination with acceleration techniques including parallel imaging, compress sensing or deep learning, allowing 6X under-sampling rate and reconstruction of high-quality contrast maps in one second.
2. Methods
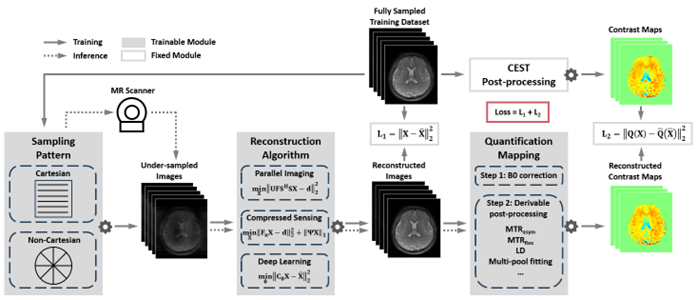
2.1 Framework designThe schematic of the proposed CEST framework is shown in Figure 1. The framework consisted of three parts: a Cartesian or non-Cartesian sampling module D, a model-based or data-based reconstruction algorithm C, and a derivable quantification technique Q. In the training stage, fully sampled training data was re-sampled based on the sampling pattern. The aliased images were fed into reconstruction and quantification mapping to generate de-aliased saturation images and corresponding quantification maps. In the inference stage, the optimized sampling pattern were fixed in an MR scanner to perform prospective data acquisition, then reconstructed and quantified by subsequent modules.
2.1.1 Parameterization of sampling pattern
The sampling model can be expressed as:
$$X=D_{k,∆\omega}\left(\hat{X}\right)=S^HF_{k,∆\omega}^HF_{k,∆\omega}S\left(\hat{X}\right)$$
where $$$F_{k,∆\omega}$$$ is Fourier transformation, S is multi-channel sensitivity maps, \hat{X} is fully sampled saturation images. Since fast Fourier transformation is discrete and non-differentiable, we build a Fourier transform matrix with one-dimensional parameters k1 to km, where m is the number sampling locations (3). For Cartesian sampling, the matrix can be expressed as $$$F(k,r)=e^{-jkr}$$$, which is continuous and derivable. Each offset has an independent set of parameters that determine the sampling locations:
$$F_{k,∆\omega}={F_{k,∆\omega_1},F_{k,∆\omega_2},⋯,F_{k,∆\omega_n}}$$
2.1.2 Reconstruction module
As for reconstruction, a Parallel Imaging (PI), Compressed Sensing (CS) or Deep Learning (DL) method can be embedded into the reconstruction module. The reconstruction method needs to be derivable to allow the backward propagation of the gradient.
2.1.3 Quantification mapping
The quantification module first corrects the B0 inhomogeneity, then processes the saturation images to generate quantification maps. In our current implementation, a 2D U-net was trained to learn a quantification mapping. The offset-dimension was taken as the channel-dimension of the network, and the outputs of the network were 6 contrast maps: MTRm, MTRp, MTRasym, MTRRex, LDamide, LDNOE. The network was pre-trained on fully sampled dataset, using fully sampled saturation images as input, calculated contrast maps as labels.
2.2 Retrospective Experiments
14 healthy volunteers were scanned on a Philips 3T scanner (Ingenia CX 3.0T; Philips Medical Systems, Best, The Netherlands). All subjects signed the written informed consent.
In terms of network training, to make the produced CEST images have high image quality and accurate quantification maps, the loss function was:
$$loss=\min_{k,\theta,\delta}\left\|C_\theta\left(D_k\left(\hat{X}\right)\right)-\hat{X}\right\|_2^2+{\mu}\left\|Q_\delta\left(C_\theta\left(D_k\left(\hat{X}\right)\right)\right)-Q_\delta\left(\hat{X}\right)\right\|_2^2 $$
where k, θ, δ are the trainable parameters in the sampling, reconstruction and quantification module, respectively.
3. Results and Discussion
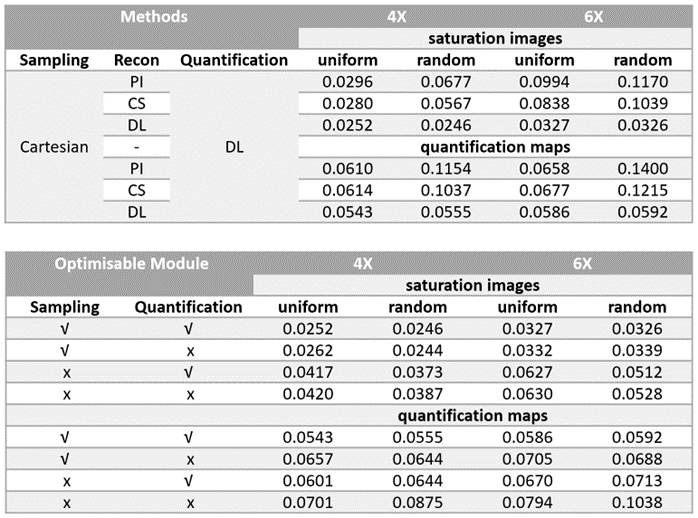
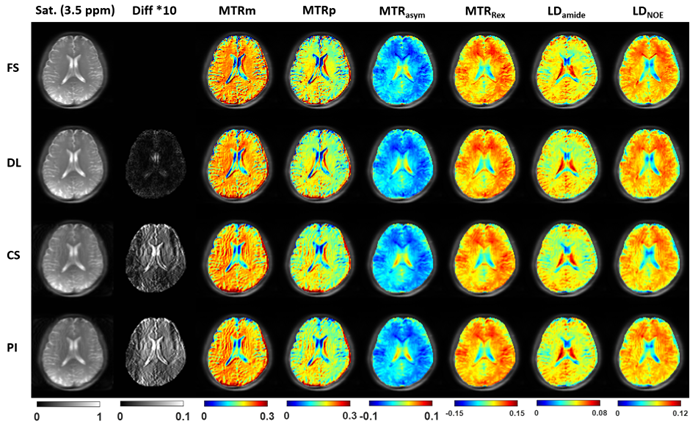
3.1 Comparison of different methodsWe compared the performance of different reconstruction methods on the test dataset. Image quality evaluation of saturation images and quantification maps were summarized in Table 1(top). DL yielded the best quantitative metrics under all experiment conditions. Despite of this, images and maps (6X) from all three reconstruction methods were closed to gold standard (Figure 2), demonstrating the robustness of the proposed framework.
3.2 Effect validation of D, C, and Q module
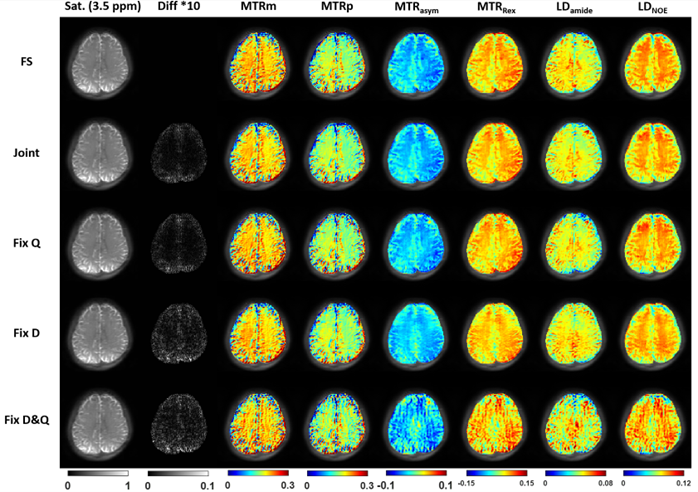
As shown in Table 1(bottom) and Figure 3, joint optimization produced the best quality images in ablation experiments. Fixing sampling or quantification module induced decreased performance. These facts illustrated the advantages of the proposed joint optimization pipeline.
3.3 Optimization of the sampling pattern
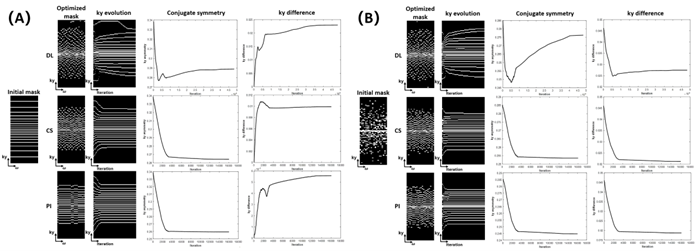
Figure 4 depicts the optimization of sampling locations. As training, the sampling locations of each offset were automatically optimized to improve acquisition efficiency. For both uniform and randomized sampling pattern, the conjugate symmetry and ky difference among all offsets converges to a similar value, which may reflect the characteristic of metabolic information in k-space.
4. Conclusion
Herein, we developed a data-driven CEST framework, which enabled a joint optimization of sampling, reconstruction and quantification. Quantification maps benefited from the optimized sampling pattern and reconstruction algorithm, and can be calculated within 1 second with shortened scan time (6X), which could meet the clinical needs of rapid acquisition and real-time analysis.Acknowledgements
This work is partially supported by National Key R&D Program of China 2022YFC3602500, 2022YFC3602503 and National Natural Science Foundation of China (NSFC) (Nos. 82071914).References
1. van Zijl PCM, Lam WW, Xu J, Knutsson L, Stanisz GJ. Magnetization Transfer Contrast and Chemical Exchange Saturation Transfer MRI. Features and analysis of the field-dependent saturation spectrum. Neuroimage. Mar 2018;168:222-241. doi:10.1016/j.neuroimage.2017.04.045
2. Vinogradov E, Sherry AD, Lenkinski RE. CEST: from basic principles to applications, challenges and opportunities. J Magn Reson. Apr 2013;229:155-72. doi:10.1016/j.jmr.2012.11.024
3. Aggarwal HK, Jacob M. J-MoDL: Joint Model-Based Deep Learning for Optimized Sampling and Reconstruction. IEEE J Sel Top Signal Process. Oct 2020;14(6):1151-1162. doi:10.1109/jstsp.2020.3004094
Figures