4475
Removing lipid artifacts in CEST imaging with a two-point turbo-spin-echo Dixon method1Key Laboratory for Biomedical Engineering of Ministry of Education, Department of Biomedical Engineering, College of Biomedical Engineering & Instrument Science, Zhejiang University, Hangzhou, China, 2siemens-healthineers, Shanghai, China
Synopsis
Keywords: CEST / APT / NOE, Fat
Motivation: Chemical Exchange Saturation Transfer (CEST) imaging has advanced by capturing molecular-level information of tissue metabolites. However, strong fat artifacts can affect the contrast of CEST signals.
Goal(s): We aim to seek a fat suppression technique that maintains high image signal-to-noise efficiency.
Approach: By combining TSE-CEST and flexible two-point Dixon methods, utilizing accurate multi-peak fat models, the obtained water-only images are used as CEST images.
Results: Z-spectra and MTRasym of ROIs in the water-fat-Creatine phantoms and high-fat fraction regions near the human knee demonstrate that accurate fat suppression achieved in the CEST images.
Impact: We proposed a two-point turbo-spin-echo Dixon technique, which utilizes TSE-CEST instead of the conventional gradient echo Dixon acquisition. Robust fat suppression was achieved in the phantoms and human knee by utilizing Dixon on the two images acquired for each offset.
Introduction
In body applications, strong lipid signals can interfere with the CEST contrast, complicating the z-spectrum appearance and leading to erroneous CEST effects (1,2). Although methods combining CEST preparation with multi-point Dixon fat-water separation have been proposed to obtain pure water CEST images, existing methods are limited to gradient echo acquisition (3,4). Since turbo-spin-echo (TSE) has a higher signal-to-noise efficiency than gradient-echo readout for CEST-related imaging (5,6), we propose a two-point TSE-CEST-Dixon technique with flexible echo shift aimed at reducing the influence of lipid on z-spectrum asymmetry analysis.Methods
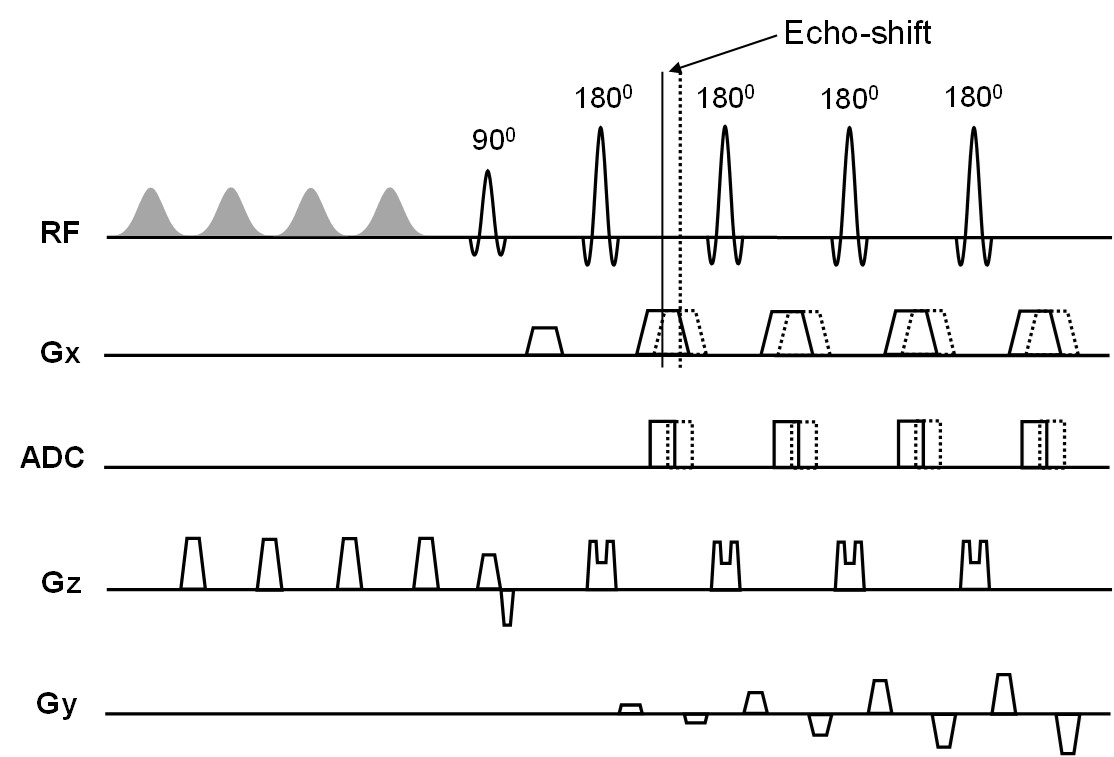
As shown in Figure 1, the acquisition window and readout gradients are displaced to generate an echo shift, which leads to a phase difference (not necessarily ) between water and fat signals due to their chemical shifts. A multi-peak spectral model was utilized to characterize fat, whereas the relative amplitudes of each lipid peak would be influenced by CEST saturation pulses of different frequency offsets. The magnetization of each peak under saturation can be described by the following Bloch equations (7):$$\frac{\text{d}M_x^k}{\text{d}t}={-R_2}{M_x^k}-{∆ω_k}{M_y^k},$$$$\frac{\text{d}{M_y^k}}{\text{d}t}=-{R_2}{M_y^k}+{∆ω_k}{M_x^k}-{ω_1(t)}{M_z^k},$$$${\rm{\qquad\qquad\qquad\qquad\qquad}}\frac{\text{d}{M_z^k}}{\text{d}t}=-{R_1}{M_z^k}+{ω_1 (t)}{M_y^k}+{R_1}{M_0^k},{\rm{\qquad\qquad\qquad\qquad[1]}}$$where and of fat are based on prior knowledge in literature (8); is the CEST saturation RF field and modulated by the transmit map; represents the frequency difference between the CEST saturation offset and the chemical shift of the k-th fat peak; and is the equilibrium magnetization of the k‐th fat peak. For each CEST frequency offset, Equation [1] was solved numerically, with the relative amplitudes of the fat peaks updated. Then, the updated fat model was utilized in two-point Dixon water-fat separation (9) to obtain pure water CEST images.
Phantom Study: A series of water-oil mixture phantoms were prepared with different fat fractions and creatine concentrations, comprising sunflower seed oil, creatine, agar, and PBS solution. A 3T Siemens Prisma scanner with a custom-made 4-channel rat coil was used for data acquisition. The CEST preparation module consisted of 10 Gaussian-shaped pulses, with each 100ms long and B1=2μT. The CEST images were acquired using a 2D turbo-spin-echo sequence with a base TE=12ms, an echo shift of 0.94ms, FA=180°, and TR=5s. A total of 32 offsets were acquired from -6 ppm to 6 ppm, and one unsaturated reference image was collected. A vendor-preset preconditioning RF sequence (10) was implemented to acquire the B1 map.
Human Study: The local institutional review board approved the human study. Sagittal images of the volunteer's right knee were acquired using a knee coil, with the same aforementioned acquisition parameters as those used in the phantom experiment.
Processing: The z-spectrum and magnetization transfer ratio asymmetry (MTRasym) spectra in user-defined regions of interest (ROI) were obtained from various processing strategies (with or without Bloch/Dixon processing) to demonstrate the effectiveness of fat elimination and the accuracy of our proposed method.
Results
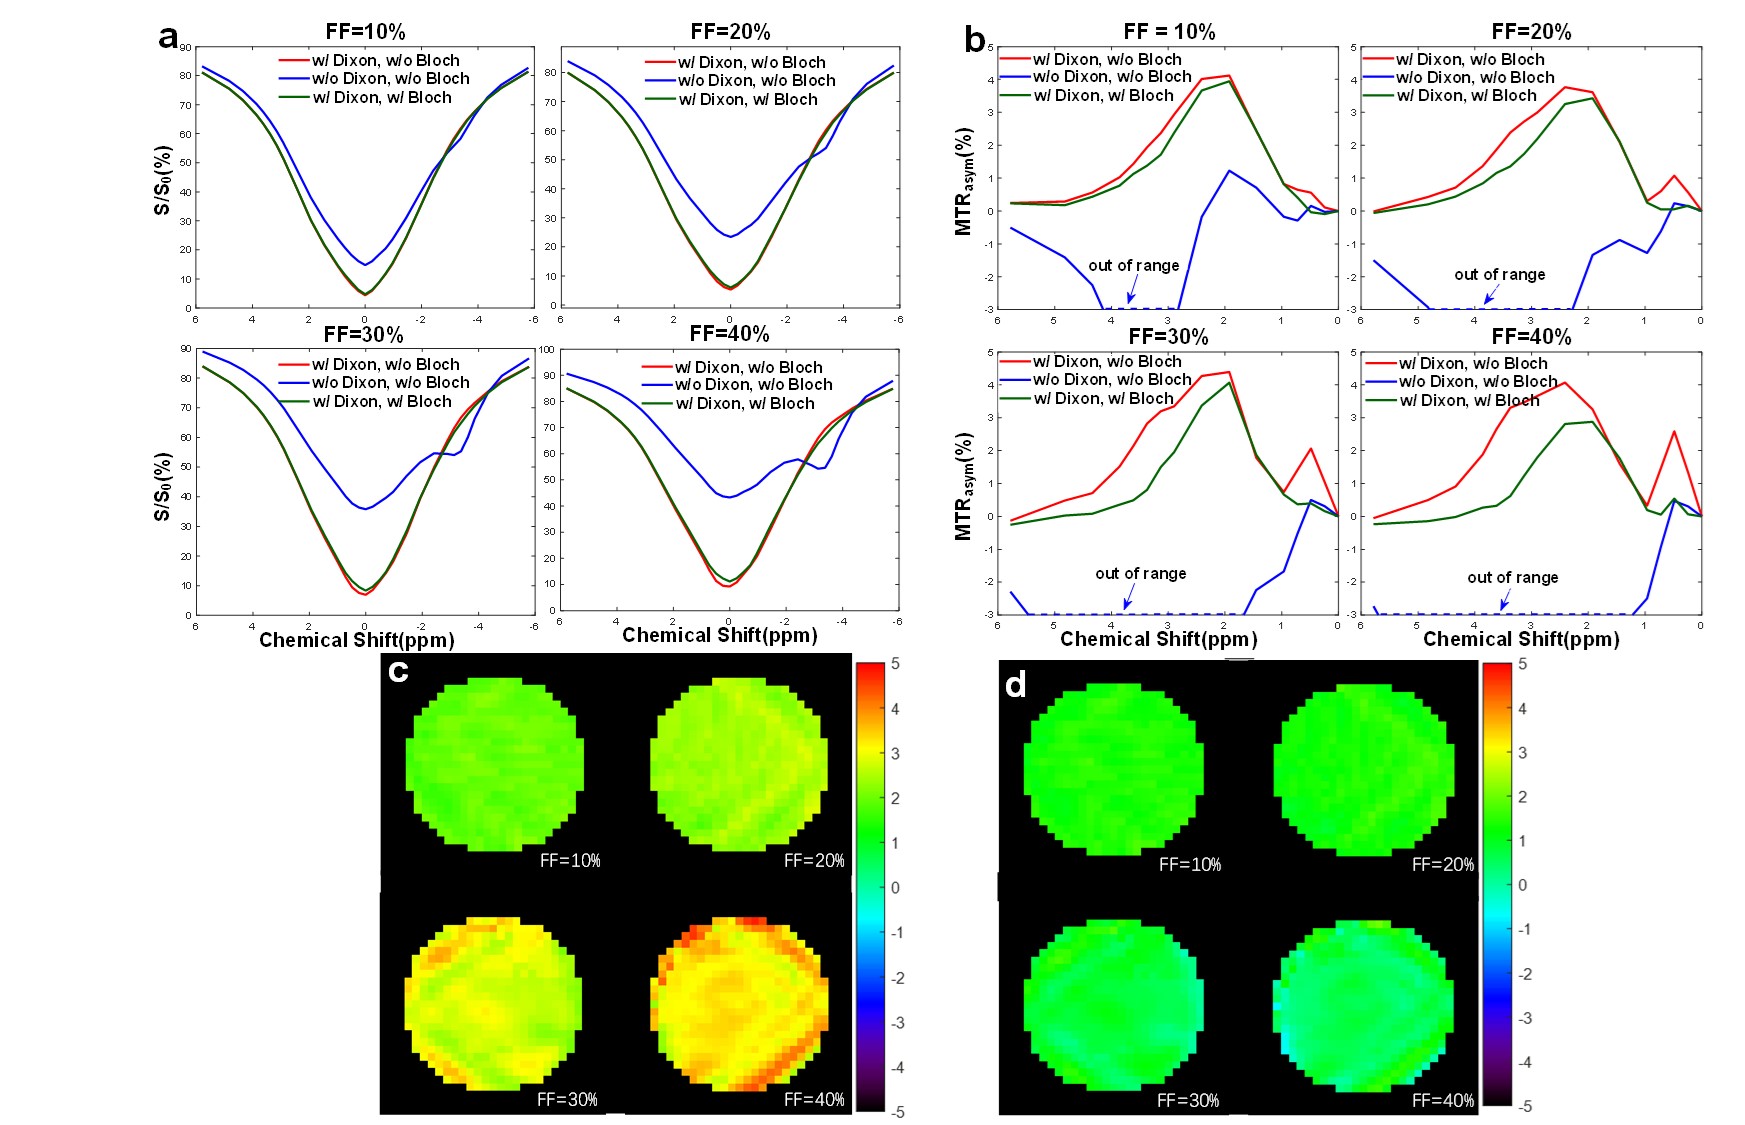
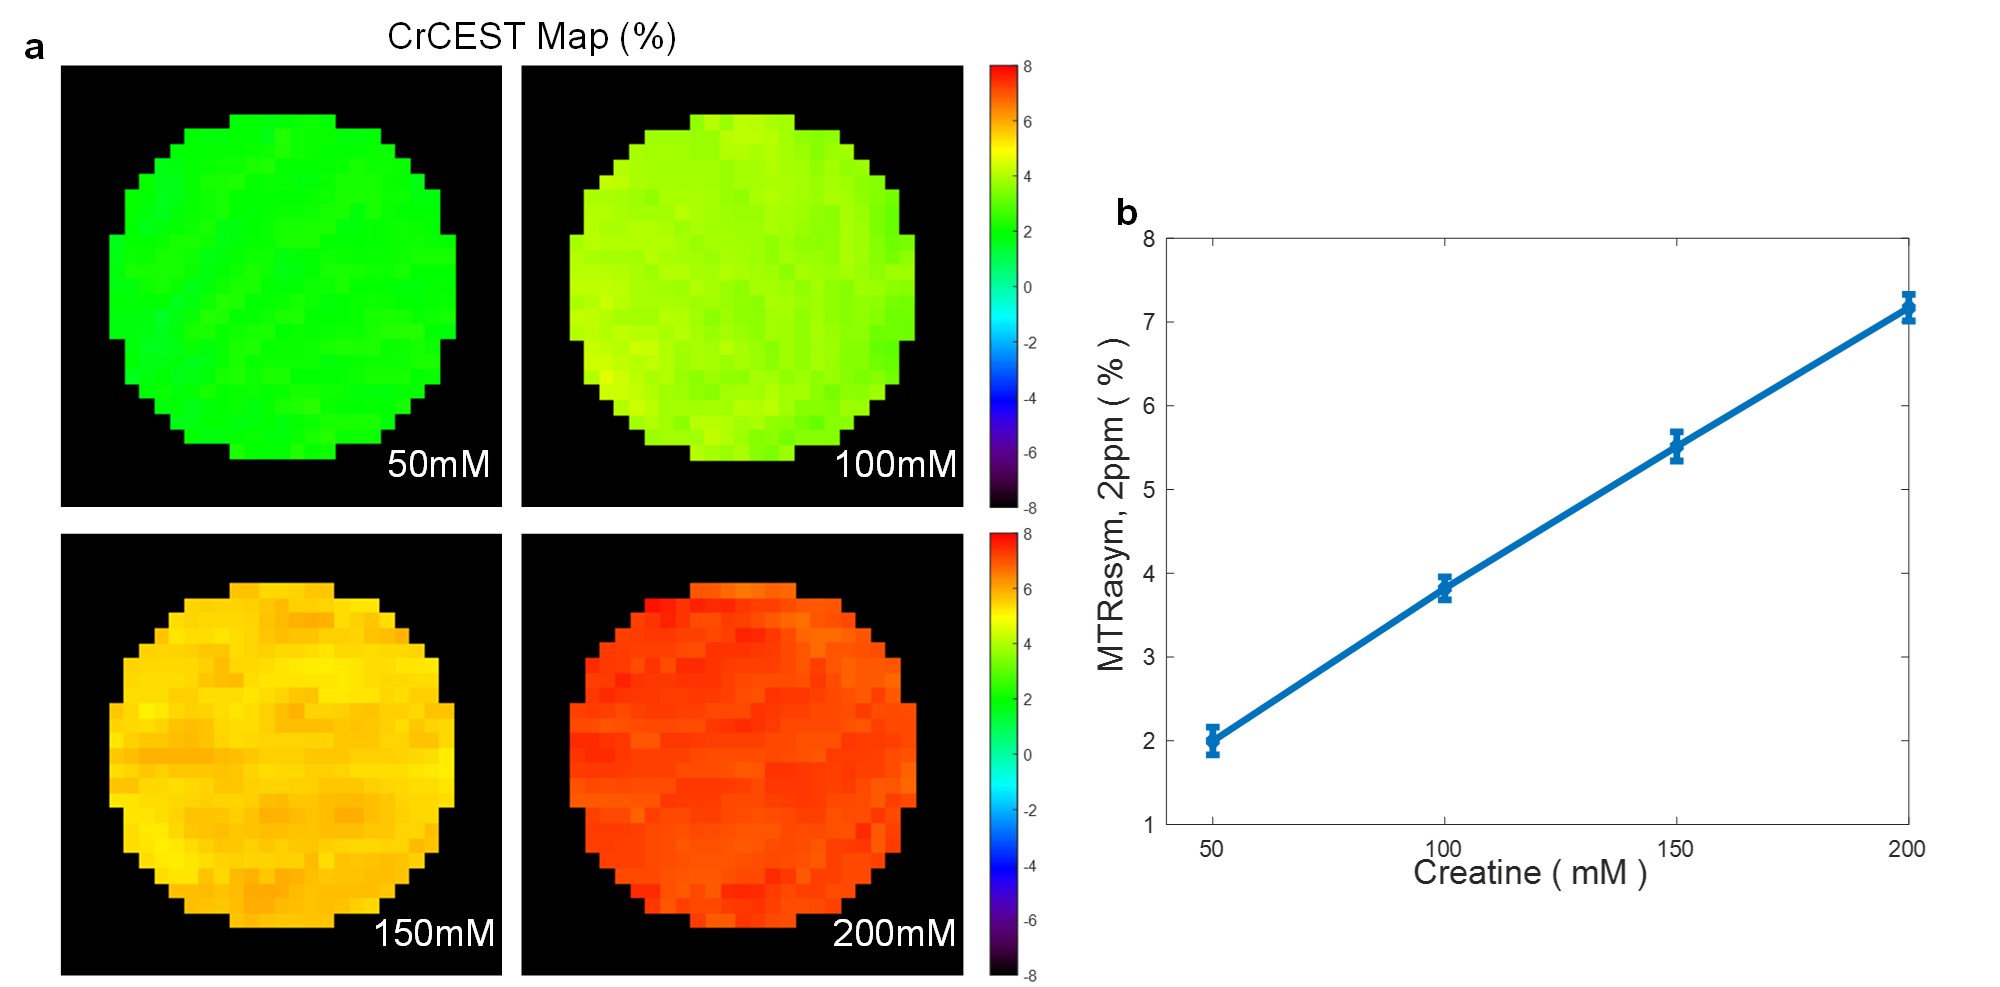
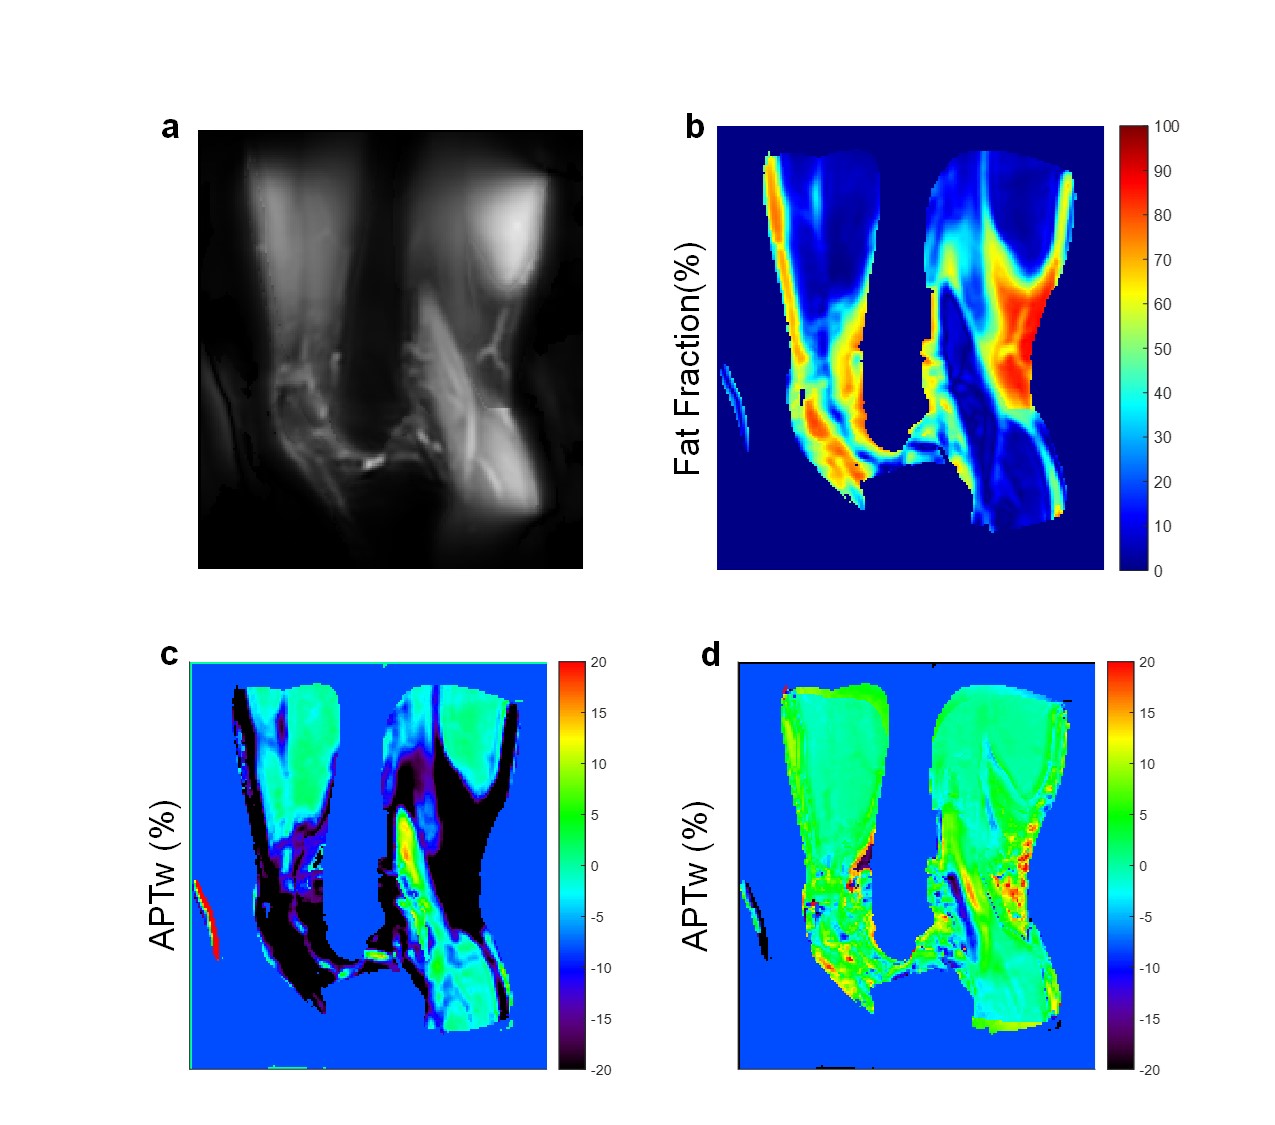
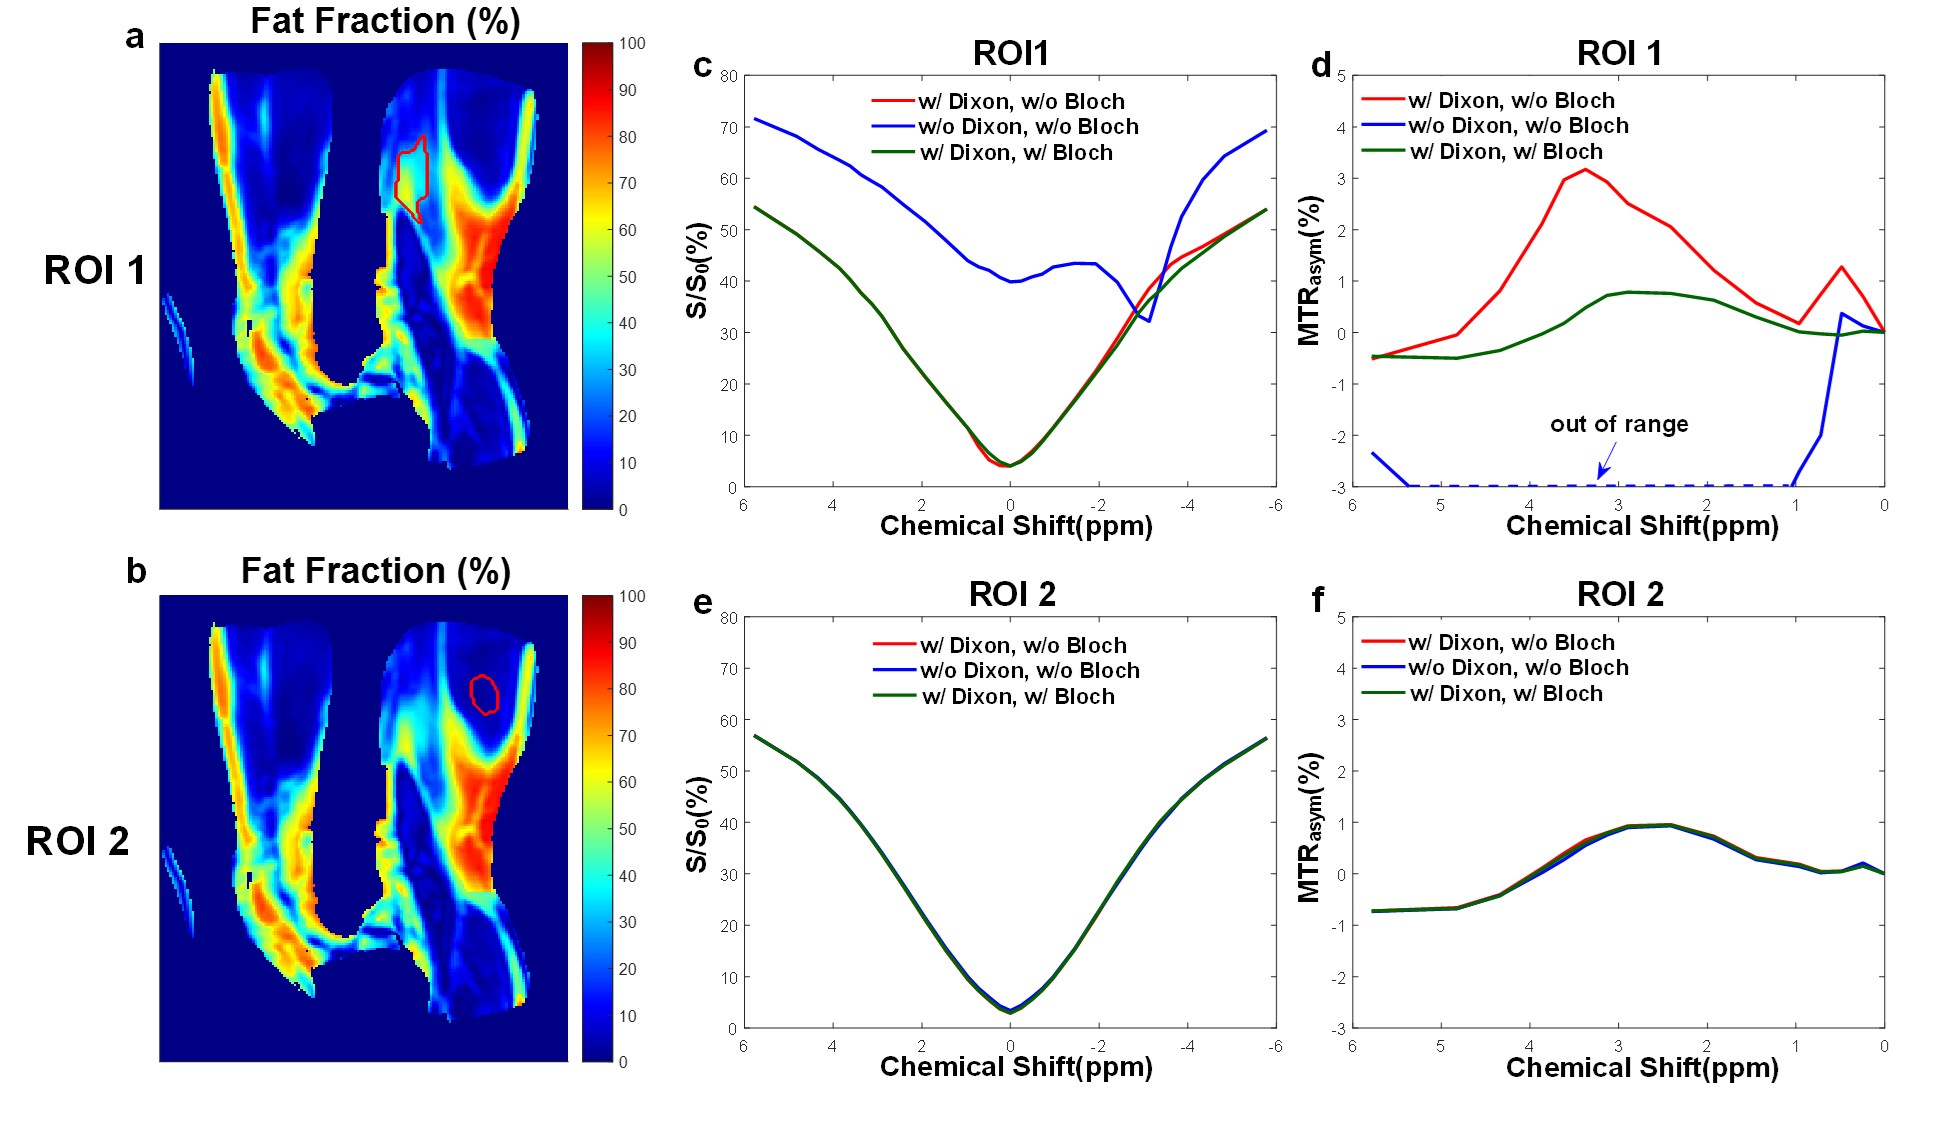
Figure 2 illustrates the z-spectra and MTRasym spectra from creatine phantoms of varying fat fractions (10%-40%). It is clear that the raw spectra (blue) are grossly contaminated by the lipid artifacts. Although the Dixon correction alone (red) can largely restore the spectra, the residual artifacts at ~0.61ppm can only be removed by additional Bloch correction (green) with smooth APTw maps generated. Figure 3 displays the images of creatine phantoms with a constant fat fraction of 20% and varying Creatine concentrations from 50mM to100mM. The CEST values after Dixon and Bloch correction exhibited a strong linear relationship (R2=0.98) with the creatine concentration (Fig. 3b). Figure 4 presents the water-only image and the fat fraction map calculated using the two-point Dixon method, as well as the APTw maps before and after proposed fat correction in a participant's right knee. Similar to the phantom results, the overall quality of the APTw map got substantially improved after the fat correction, apart from the joint capsule (indicated by arrows). Figure 5 compares the z-spectra and MTRasym spectra from high-fat fraction (Figs. 5c-d) and low-fat fraction (Figs. 5e-f) ROIs in the gastrocnemius muscle. The spectra were minimally affected by the fat correction processing in low-fat ROI, while the spectra were substantially improved after fat correction in high-fat ROI.Discussion & Conclusion
In this work, we presented a novel two-point TSE-Dixon method to correct fat artifacts in CEST imaging. The proposed TSE-CEST-Dixon method requires fewer acquisitions and has higher SNR efficiency than previous multi-point gradient echo methods. The TSE-CEST-Dixon method was validated in both phantom and human studies, yielding substantially improved results after Dixon and Bloch correction. The TSE-CEST-Dixon method has the potential to overcome the lipid artifact hurdle in CEST imaging of the human body.Acknowledgements
National Natural Science Foundation of China: 81971605. Key R&D Program of Zhejiang Province: 2022C04031. Leading Innovation and Entrepreneurship Team of Zhejiang Province: 2020R01003. This work was supported by the MOE Frontier Science Center for Brain Science & Brain-Machine Integration, Zhejiang University.References
Figures