4473
A 3D steady-state CEST sequence for in vivo imaging of cerebral blood vessels at 3T1Center for Biomedical Imaging Research, Department of Biomedical Engineering, Tsinghua University, Beijing, China, 2Institute of Science and Technology for Brain-Inspired Intelligence, Fudan University, Shanghai, China, 3Key Laboratory of Computational Neuroscience and Brain-Inspired Intelligence (Fudan University), Ministry of Education, Shanghai, China, 4State Key Laboratory of Brain and Cognitive Science, Institute of Biophysics, Chinese Academy of Sciences, Beijing, China, 5Beijing Neurosurgical Institute, Capital Medical University, Beijing Tiantan Hospital, Beijing, China
Synopsis
Keywords: CEST / APT / NOE, CEST & MT
Motivation: Cerebral blood vessels play key roles in oxygen transportation and nutrition metabolism. MR angiography provides non-invasive and comprehensive information on vessel structure, blood volume and even oxygenation level. A metabolic MR imaging tool for vessels may facilitate more clinical needs.
Goal(s): To observe CEST signal in vessels including proteins and peptides, sugars and macromolecule that contains aliphatic protons.
Approach: We developed a 3D steady-state vessel-CEST sequence. Sequence parameters were optimized by simulation. Repeatability and difference between arteries and veins were investigated on 8 subujects.
Results: Preliminary results demonstrated good repeatability of the pulse sequence, and allow sensitive visualization of blood signal in vessels.
Impact: We developed a 3D steady-state CEST sequence for in vivo z-spectra analysis of cerebral vessels.Preliminary results demonstrated good repeatability of the sequence,and difference between arteries and veins were observed.These facts illustrated the potential value in diagnosis of blood metabolism-related diseases.
1. Introduction
Chemical exchange saturation transfer (CEST) MRI has emerged as an exciting molecular tool that provides quantitative insights into endogenous solutes (1). Since blood contains many labile protons (e.g., from glucose, amine, amide, etc.) that can produce CEST contrast through chemical exchange or cross-relaxation with water protons, these features could be utilized to observe blood signal non-invasively (2-4). In this study, we developed a 3D steady-state CEST sequence for in vivo cerebral blood signal analysis. We performed a repeatability test on eight healthy subjects, and differences between vessels were analyzed. The preliminary results illustrated the potential value of the proposed technique in the diagnosis and evaluation of blood metabolism-related diseases.2. Methods
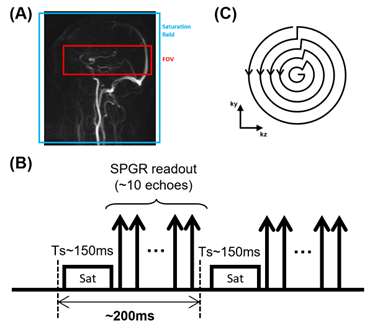
2.1 Sequence designThe schematic of the proposed pulse sequence is shown in Figure 1, where each unit contains a series of Gaussian-shape saturation pulses and a gradient echo acquisition. The acquisition window is short enough to ensure the small interval between saturation blocks, and further allows the in-flow blood to be continuously labeled. To obtain z-spectra of blood in a 3D FOV within an acceptable scan time, we adopted a rapid acquisition strategy, known as steady-state CEST. Since CEST effect accumulates over time, the proposed sequence uses a high-low view order to ensure the k-space center signals have more CEST effect. Besides, the saturation field is much larger than the imaging field to avoid unsaturated blood flow into imaging FOV. Note that the gradient echo acquisition brings bright blood contrast to the image.
2.2 Numerical simulation
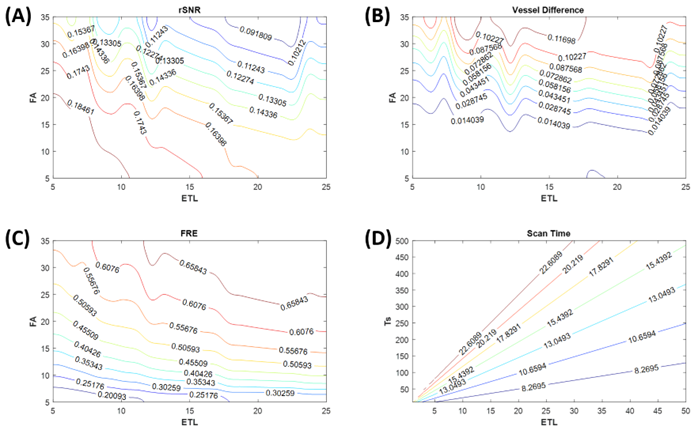
Two-pool Bloch-McConnell simulations were performed to investigate the effect of saturation time and TFE factor. We chose one peak of glucose as an endogenous contrast agent in the simulation. Simulation parameters were: exchange rate=1200 Hz, relative concentration=0.005, δω=2.1 ppm, T1water=1600 ms, T2water=150 Ms. We assumed that blood flows from the cardiac into the FOV in 1 second and flows through the FOV in 0.4 seconds. Flip Angle (FA) and Echo Train Length (ETL) were varied to explore the best relative SNR, vessel difference, and Flow-Related Enhancement (FRE) within an acceptable scan time.
2.3 MRI experiments
We conducted repeated experiments to verify the repeatability of the proposed sequence. Eight healthy subjects were scanned at a 3T scanner (Ingenia, Philips Healthcare) with a 32-channel coil. All volunteers signed the written informed consent. 34 frequency offsets varying from -8 to 8 were performed at 2.5 μT within 14 minutes. Other scan parameters were: saturation time of 100 ms, FOV of 160 x 160 x 60 mm3 (2 imaging slabs), resolution of 1 x 1 x 1.2 mm3, TFE factor of 15. The blood CEST sequence was repeated twice within the scan sessions to evaluate the measurement repeatability, by calculating the intraclass correlation coefficient (ICC) at 4 vessel locations (i.e., right M1, left M1, basilar artery and vein around the torcular). As for analysis of vessels difference, paired t-test was performed between 4 vessel locations.
3. Results and Discussion
3.1 Simulation resultsSimulation results are shown in Figure 2. To achieve high rSNR and small vessel difference, we set the flip angle to 15, saturation time to 100-150ms, and ETL to 10-15, with a scan time of less than 15 minutes.
3.2 Repeatability analysis
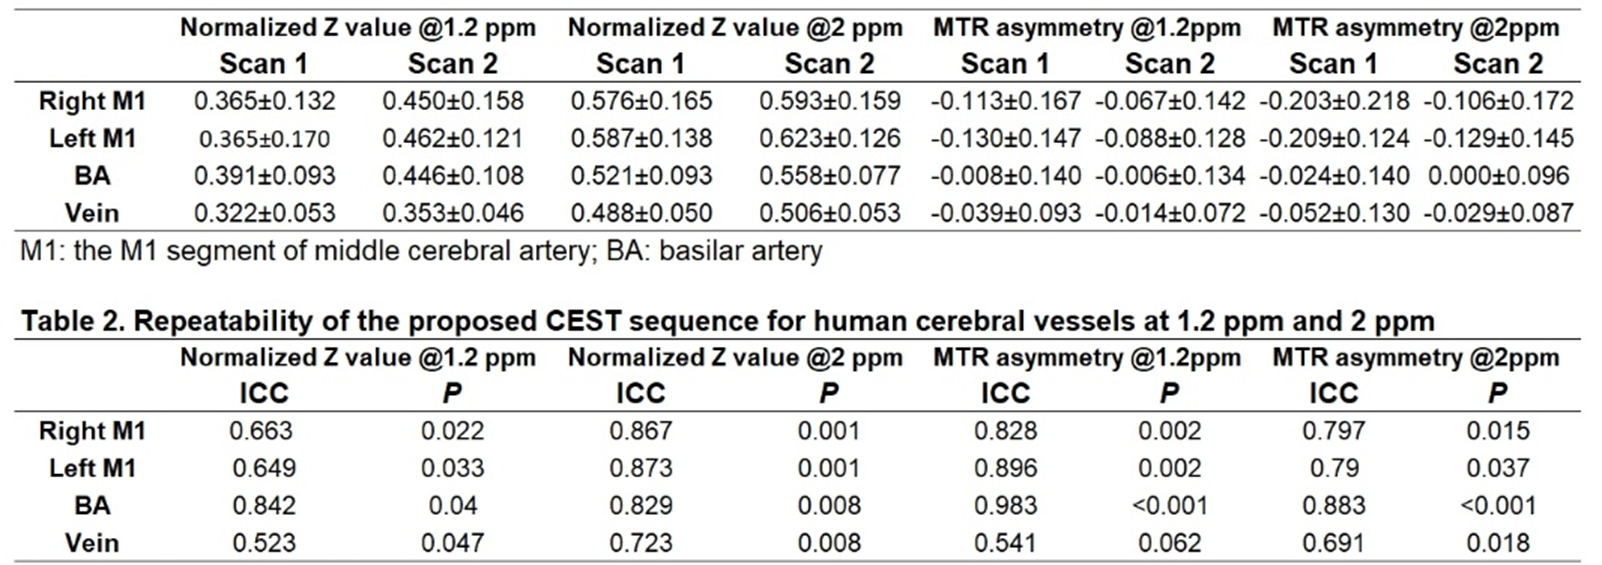
The mean and standard deviation (across the 8 subjects) of the normalized Z spectra and MTR asymmetry at 1.2 ppm and 2 ppm for the 4 vascular locations are shown in Table 1. The ICC values and the corresponding P values are shown in Table 2. Moderate to excellent repeatability was obtained for both the normalized Z spectra and MTR asymmetry.
3.3 Vessels difference analysis
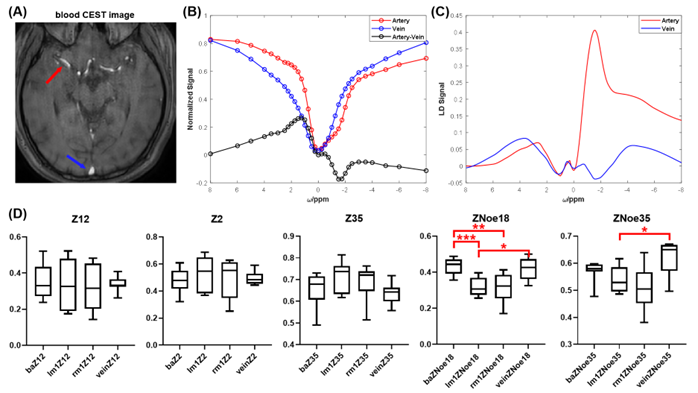
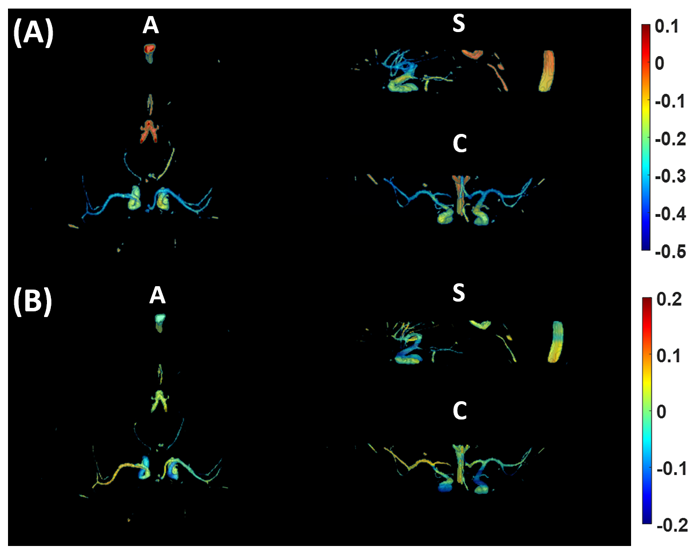
Figure 3 shows the analysis of z-spectrum features of arteries and veins. Arterial blood had stronger NOE effects than venous blood with statistical significance. One possible reason is that arterial blood contains more oxygen than venous blood. 3D maps of MTRasym and LD at 1-3 ppm are depicted in Figure 4, illustrating the capacity of the proposed sequence to obtain 3D spatial metabolism distribution of blood.
4. Conclusion
In this study, we developed a 3D steady-state CEST sequence for in vivo z-spectra analysis of cerebral vessels. Our preliminary results demonstrated good repeatability of the pulse sequence, and differences between arteries and veins were observed. These facts illustrated the potential value in the diagnosis and evaluation of blood metabolism-related diseases.Acknowledgements
This work is partially supported by National Key R&D Program of China 2022YFC3602500, 2022YFC3602503 and National Natural Science Foundation of China (NSFC) (Nos. 82071914).References
1. van Zijl PCM, Lam WW, Xu J, Knutsson L, Stanisz GJ. Magnetization Transfer Contrast and Chemical Exchange Saturation Transfer MRI. Features and analysis of the field-dependent saturation spectrum. Neuroimage. Mar 2018;168:222-241. doi:10.1016/j.neuroimage.2017.04.045
2. Cui J, Zhao Y, Wang F, Gochberg DF, Zu Z. Contribution of blood to nuclear Overhauser effect at -1.6 ppm. Magn Reson Med. Jan 2022;87(1):409-416. doi:10.1002/mrm.28973
3. Shah SM, Mougin OE, Carradus AJ, et al. The z-spectrum from human blood at 7T. Neuroimage. Feb 15 2018;167:31-40. doi:10.1016/j.neuroimage.2017.10.053
4. Zheng S, van der Bom IM, Zu Z, Lin G, Zhao Y, Gounis MJ. Chemical exchange saturation transfer effect in blood. Magn Reson Med. Mar 2014;71(3):1082-92. doi:10.1002/mrm.24770
Figures