4471
Accelerated CEST MRI by reconstruction using low-rank plus sparse decomposition in both k-space and image domain1Center for Biomedical Imaging Research, Department of Biomedical Engineering, Tsinghua University, Beijing, China
Synopsis
Keywords: CEST / APT / NOE, CEST & MT
Motivation: Chemical Exchange Saturation Transfer (CEST) acceleration requires robust contrast recovery from under-sampled k-space data.
Goal(s): To achieve accelerated CEST-MRI with well-preserved contrast among different tissue types.
Approach: Herein we proposed a reconstruction method that iteratively decomposed both K-space and Image domains into Low-rank plus Sparse components, termed as KILS.
Results: Retrospective experiments from the healthy adults and brain tumor patients indicated that KILS could achieve an 8X acceleration factor, with well-preserved contrast among different tissue types. Experiments conducted on human liver at 3T and rat brain at 9.4T demonstrated that KILS exhibited good general applicability, suggesting its potential clinical utility.
Impact: We developed KILS, which utilizes an iterative low-rank plus sparse matrix decomposition in both k-space and image domains for robust CEST contrast recovery from under-sampled k-space data and holds significant potential.
1. Introduction
Chemical Exchange Saturation Transfer (CEST) MRI is a promising molecular imaging technique that allows for in vivo metabolic contrast by detecting proton exchange effects between water and solute pools (1). However, traditional CEST MRI methods suffer from long scan times, low signal-to-noise ratio (SNR), and asymmetrical signal variations, posing challenges for fast and robust image acquisition and reconstruction.Based on the feasibility demonstrated by Otazo et al. in various dynamic MRI scenarios (2), the low-rank plus sparse matrix decomposition (L+S) technique can be potentially applied in CEST MRI (3). Herein we proposed a reconstruction method that iteratively decomposed both K-space and Image domains into Low-rank plus Sparse components, termed as KILS.
2. Methods
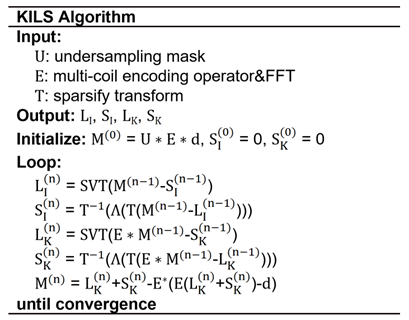
2.1 KILS: L+S decomposition in K-I domainThe objective function with a simultaneous matrix decomposition approach in both image domain and k-space is:
$$min\left\|L_I\right\|_*+\lambda_1\left\|TS_I\right\|_1+\lambda_2\left\|L_K\right\|_*+\lambda_3\left\|TS_K\right\|_1$$
$$s.t.\ UE\left(L_I+S_I\right)=d$$
$$E\left(L_I+S_I\right)=L_K+S_K$$
where LI, SI, LK and SK are low-rank and sparse components in image domain and k-space, respectively. T is a sparse transformation of S. E is an encoding operator consisting of sensitivity encoding and Fourior Transform, U is the under-sampling mask in k-space, and d is the acquired data in k-space. According to the proximal gradient method, the final expressions for the four components in the kth iteration are as follows:
$$L_I^{\left(k\right)}={\rm SVT}_{\lambda_{L_I}}\left\{L_I^{\left(k-1\right)}-t_I^{\left(k\right)}\left(UE\right)^\ast\left[UE\left(L_I^{\left(k-1\right)}+S_I^{\left(k-1\right)}\right)-d\right]-t_I^{\left(k\right)}E^\ast\left[E\left(L_I^{\left(k-1\right)}+S_I^{\left(k-1\right)}\right)-\left(L_K^{\left(k-1\right)}+S_K^{\left(k-1\right)}\right)\right]\right\}$$
$$S_I^{\left(k\right)}=T^{-1}\Lambda_{\lambda_{S_I}}\left\{T\left[S_I^{\left(k-1\right)}-t_I^{\left(k\right)}\left(UE\right)^\ast\left(UE\left(L_I^{\left(k-1\right)}+S_I^{\left(k-1\right)}\right)-d\right)-t_I^{\left(k\right)}E^\ast\left(E\left(L_I^{\left(k-1\right)}+S_I^{\left(k-1\right)}\right)-\left(L_K^{\left(k-1\right)}+S_K^{\left(k-1\right)}\right)\right)\right]\right\}$$
$$L_K^{\left(k\right)}={\rm SVT}_{\lambda_{L_K}}\left\{L_K^{\left(k-1\right)}-t_K^{\left(k\right)}\left[E\left(L_I^{\left(k-1\right)}+S_I^{\left(k-1\right)}\right)-\left(L_K^{\left(k-1\right)}+S_K^{\left(k-1\right)}\right)\right]\right\}$$
$$S_K^{\left(k\right)}=T^{-1}\Lambda_{\lambda_{S_I}}\left\{T\left[S_K^{\left(k-1\right)}-t_K^{\left(k\right)}\left(E\left(L_I^{\left(k-1\right)}+S_I^{\left(k-1\right)}\right)-\left(L_K^{\left(k-1\right)}+S_K^{\left(k-1\right)}\right)\right)\right]\right\}$$
Equations above are presented in Table 1.
2.2 CEST MRI experiments
Human data were acquired at a 3T scanner (Ingenia, Philips Healthcare) using a 3D multi-shot TSE CEST sequence with 31 saturation offsets. The brain data encompassed 11 healthy adults with voxel size of 1.8×1.8×3.3 mm3 and 15 brain tumor patients with voxel size of 2×2×6 mm3. Moreover, A stroke rat was scanned with a 2D CEST RARE sequence and voxel size of 0.27×0.33×1.2 mm3 and a free-breathing abdominal CEST sequence with water pre-saturation and respiratory gating was performed, involving scanning a single healthy subject with 2D single-shot TSE readout, voxel size of 1.7×1.7 mm2 and slice thickness of 4 mm.
2.3 Image reconstruction
Image reconstruction was carried out using MATLAB 2021b. The reconstruction hyper-parameters, $$$\lambda_{L_I}$$$, $$$\lambda_{S_I}$$$, $$$\lambda_{L_K}$$$ and $$$\lambda_{S_K}$$$ were selected by grid search with minimum MSE.
3. Results
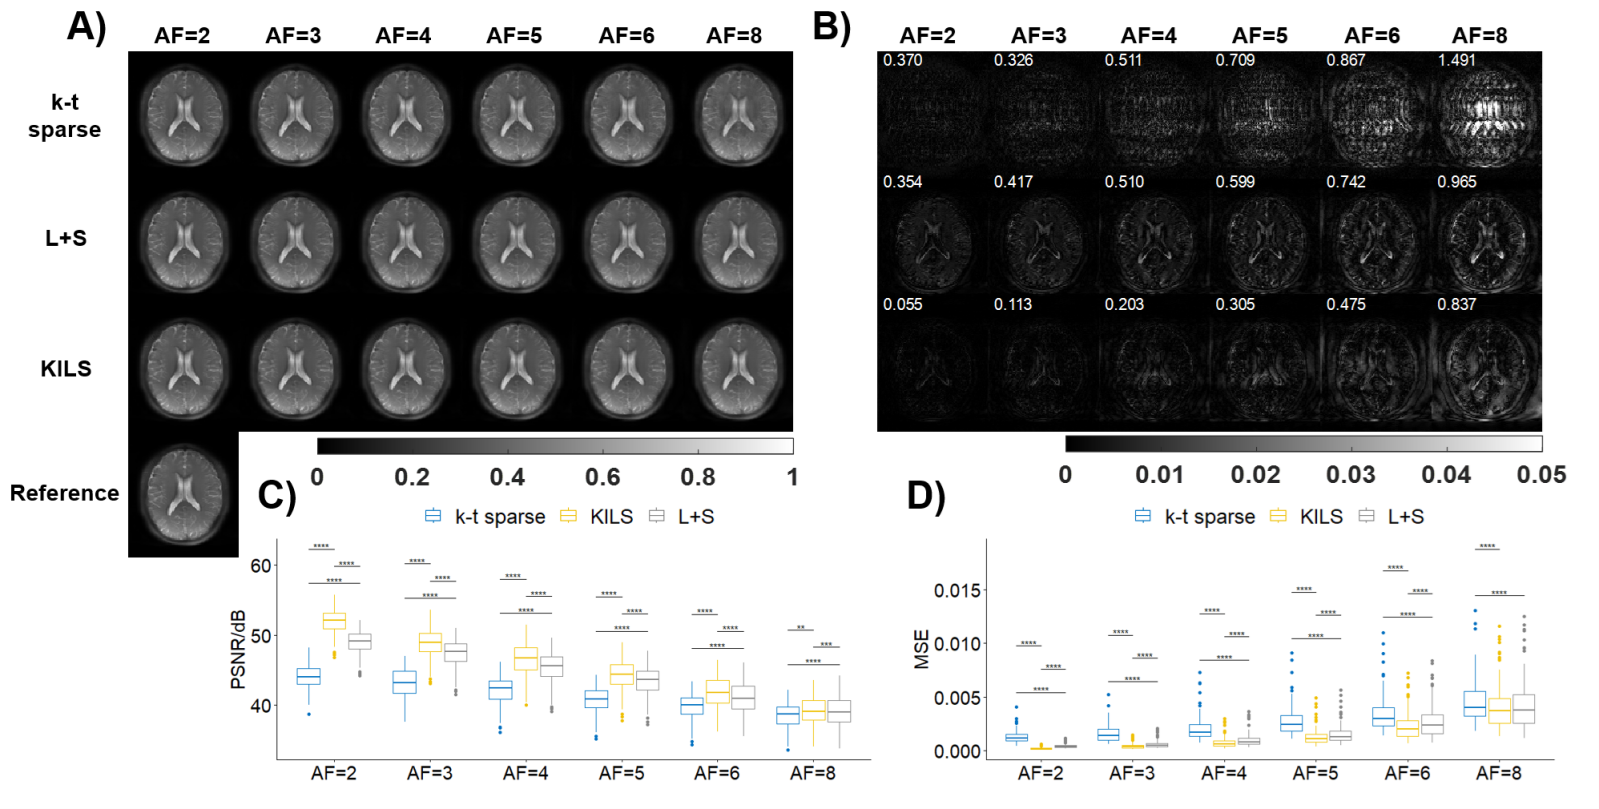
3.1 Human brain resultsFigure 1 focuses on quantitative image-quality assessment. It is evident that KILS outperformed other methods in reconstructing saturation images, displaying minimal errors (Figure 1(A-B)). The statistical analysis further confirmed the superior reconstruction accuracy of KILS, as indicated by the higher PSNR and lower MSE values (Figure 1(C-D), p<0.01).
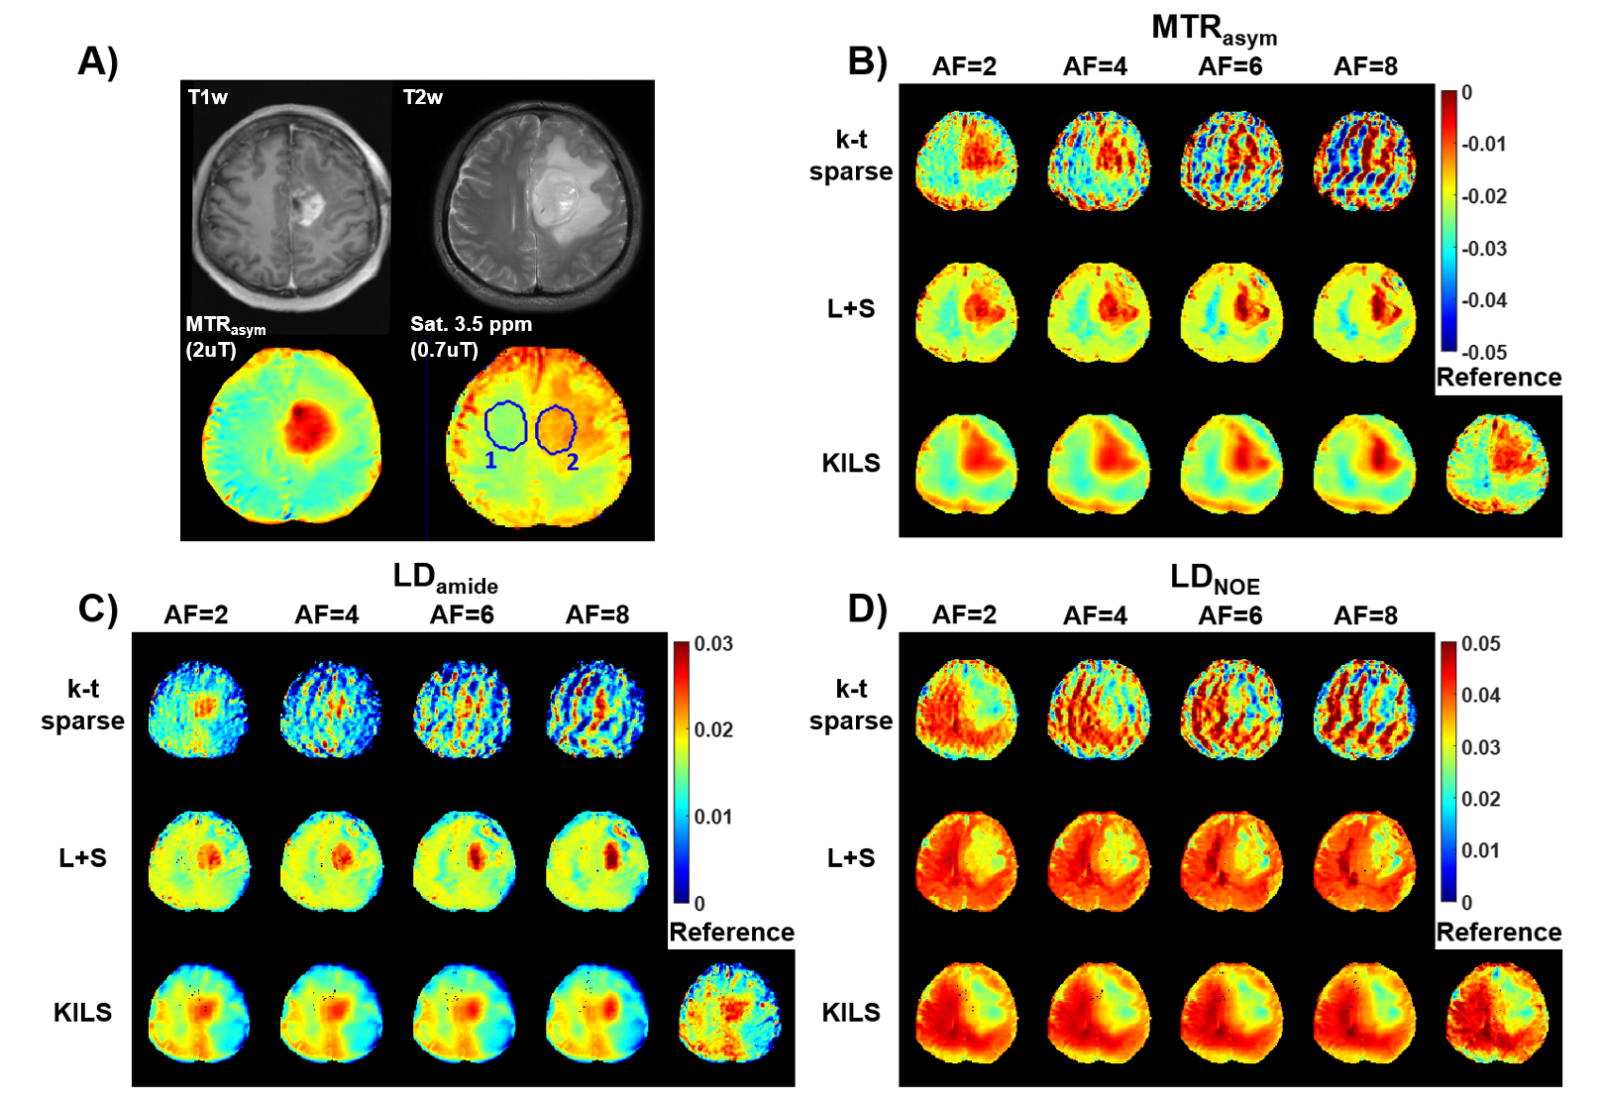
CEST contrast maps from a brain tumor patient with AFs varying from 2 to 8, are depicted in Figure 2. The lesion region exhibited hyper-intense amide signals and lower-intense NOE signals compared to normal brain tissue. KILS improved the visualization of contrast enhancement in the tumor region. At AF=8, KILS could maintain the contrast between different tissue types, demonstrating the robustness of KILS on CEST contrast enhancement.
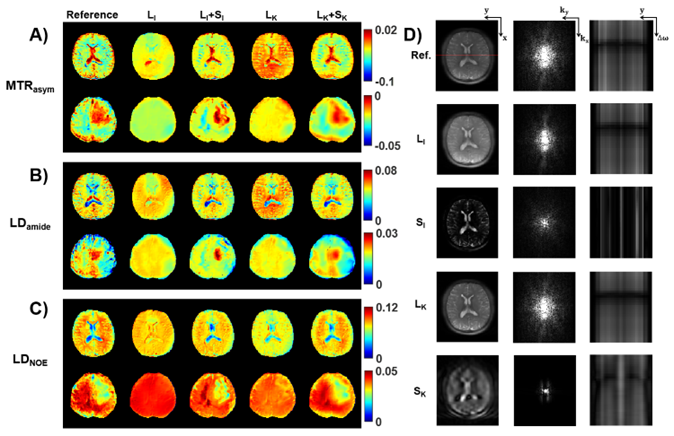
Figure 3 displays each component from a healthy adult and a brain tumor patient, which indicates the sparse component in the L+S method does not capture the disparities of z-spectra from different voxels while the contrast maps of LK present the basis intensity of CEST contrast with rich anatomical texture. Specifically, the brain tumor region displays a higher signal intensity in both MTRasym and LDamide maps, and a lower signal intensity in the LDNOE map. Results from ablation experiments further support the assumption regarding the explanation of the KILS model.
3.2 Other applications
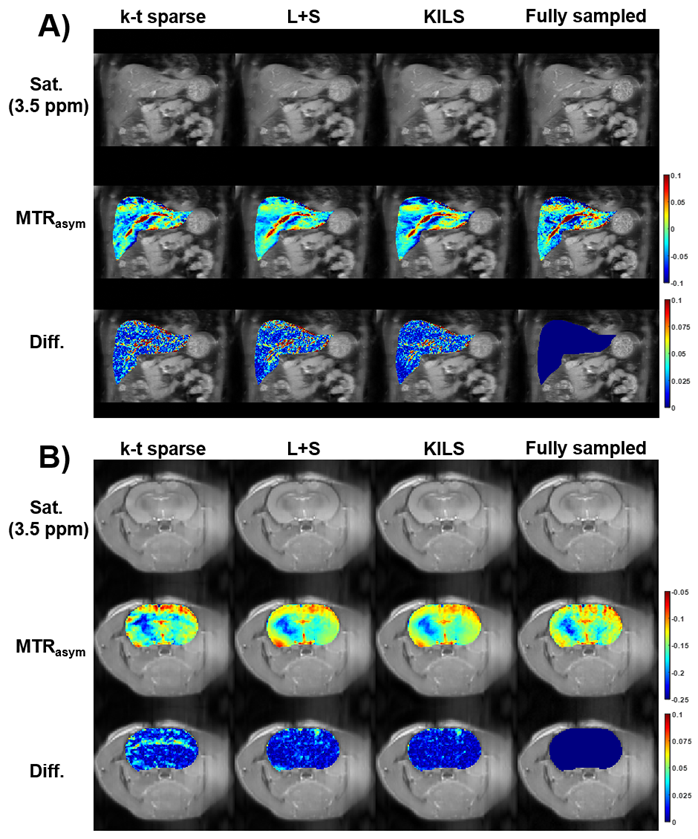
We applied the KILS method to human liver and rat brain CEST MRI. Figure 4 illustrates the liver images and rat brain images with MTRasym maps obtained from L+S, KILS, k-t sparse and fully sampled data. Notably, KILS demonstrated the minimum reconstruction error both in saturation images and the MTRasym map.
4. Dicussion and conclusion
In this study, we introduced a novel iterative low-rank plus sparse matrix decomposition technique in the K-I domain, referred to as KILS. This method enabled simultaneous L+S decomposition in both k-space and image domains, facilitating the reconstruction of saturation images with robust CEST contrast from under-sampled k-space data (up to 8X). Results demonstrated that KILS consistently produced faithful image reconstructions based on various evaluation metrics and robust contrast maps after post-processing. Additionally, an ablation experiment was conducted, confirming that KILS effectively captures the similarity and disparity of z-spectra in k-space. KILS is expected to accelerate clinical CEST protocols, reconstruct robust CEST contrast maps, and expand the clinical utilities of CEST MRI. Nevertheless, further investigations are necessary to validate the effectiveness of KILS.Acknowledgements
This work is partially supported by National Key R&D Program of China 2022YFC3602500, 2022YFC3602503 and National Natural Science Foundation of China (NSFC) (Nos. 82071914).References
1. van Zijl PCM, Lam WW, Xu J, Knutsson L, Stanisz GJ. Magnetization Transfer Contrast and Chemical Exchange Saturation Transfer MRI. Features and analysis of the field-dependent saturation spectrum. Neuroimage. Mar 2018;168:222-241. doi:10.1016/j.neuroimage.2017.04.045
2. Otazo R, Candes E, Sodickson DK. Low-rank plus sparse matrix decomposition for accelerated dynamic MRI with separation of background and dynamic components. Magn Reson Med. Mar 2015;73(3):1125-36. doi:10.1002/mrm.25240
3. Kwiatkowski G, Kozerke S. Accelerating CEST MRI in the mouse brain at 9.4 T by exploiting sparsity in the Z-spectrum domain. NMR Biomed. Sep 2020;33(9):e4360. doi:10.1002/nbm.4360
Figures