4469
Decorrelation Algorithm for Correcting B1 Artifacts in APTw Imaging at 3 Tesla1Department of R&D Advanced Applications, Olea Medical, La Ciotat, France, 2Lysholm Department of Neuroradiology, University College of London Hospitals NHS Foundation Trust, London, United Kingdom, 3Institute of Neurology UCL, London, United Kingdom, 4Siemens Healthcare GmbH, Erlangen, Germany, 5Institute of Neuroradiology, University Clinic Erlangen, Friedrich-Alexander-Universität Erlangen-Nürnberg (FAU), Erlangen, Germany
Synopsis
Keywords: CEST / APT / NOE, CEST & MT, CEST, APTw, B1-correction
Motivation: We present a data-driven approach for B1 correction in APTw MRI eliminating the requirement for additional volume sampling at various B1-values, thereby significantly reducing acquisition time.
Goal(s): This enhancement ensures feasible and robust B1 correction in clinical settings. Our method establishes homogeneity in white matter (WM) and gray matter (GM) values within 3D-APTw volume.
Approach: By modeling the correlation between rB1 and the APTw data, followed by a decorrelation algorithm, we achieve closer alignment of WM and GM values across 3D volume.
Results: This rapid technique considerably reduces acquisition time and significantly improves the coherence of WM and GM values throughout the slices.
Impact: The proposed B1 decorrelation technique strongly impacts qualitative and semi-quantitative APTw imaging applications due to considerable reduction in B1 artifacts. Homogeneous contrast among WM, GM, and tumor values is achieved within and across slices.
INTRODUCTION
B1-inhomogeneity corrections, crucial at 7 Tesla CEST imaging1, gain significance at 3 Tesla2, particularly in high B1 value methods like APTw MR imaging3. Inhomogeneities affect the Z-Spectrum, causing RF field variations across the FOV, impacting nominal B1 values in the acquisition protocol. To resolve this, multiple CEST Z-Spectra volumes are acquired at varied B1-values1, along with an rB1 map capturing field variations. Our 'data-driven' innovation instead corrects B1 inhomogeneities in APTw MRI data solely using B0-corrected reference and label volumes (acquired at a single B1 value), plus the rB1 map.METHODS
Technical Solution:First, we consider the values in each voxel of the observed B0-corrected CEST volume to be a function of the B1 field inhomogeneities. In general, we can formalize our technique as $$$Z_i = f(rB1_i)$$$ where $$$i$$$ is the index of a given brain voxel, $$$Z$$$ the observed B0-corrected CEST volume and $$$rB1$$$ is the rB1 3D map. The main objective of our method is to estimate the parameters of the function $$$f$$$ given the APTw signal and the relative B1 field inhomogeneity in the brain, and correct the original APTw signal using this function. The nature of the function can vary, (e.g. linear, exponential, polynomial, etc) but it must be able to capture the changes in the field inhomogeneities while not being too complex to avoid overfitting of the underlying brain structures. Once the function parameters are estimated we can subtract $$$f(rB1)$$$ from the acquired data. In this work we consider $$$f = \alpha \cdot (rB1-1)$$$ , where $$$\alpha$$$ is the parameter to be fitted from the data. The value 1 was inserted into the equation, representing the ideal efficiency of the radiofrequency field in the context of rB1 mapping.
MRI Acquisition:
APTw MRI data were acquired from one patient with glioblastoma (grade 4, IDH mutant, with retention of 1p/19q) on a 3T MRI scanner (MAGNETOM Prisma, Siemens, Erlangen, Germany) with a 64-channel head and neck coil. The APTw protocol (3 min, 2x2x5mm3, 12 slices) was performed with a 3D snapshot-GRE sequence4, setting a B1 root mean of square of 2μT, a Duty Cycle of 90% for 26 offsets, from $$$\delta \omega$$$=-6.0ppm to 6.0ppm with a step of 0.5ppm, and $$$M0$$$ at -300ppm. The WASAB1 protocol5 (2 min) was performed for simultaneous B0-B1 mapping.
Post-processing:
Olea Sphere 3.0 software (Olea Medical, La Ciotat, France) was used to post-process the APTw and WASAB1 data. The processing steps comprised raw data denoising6, rigid motion correction7, normalization by M0 for Z-Spectra computation, and B0-correction of the Z-Spectra using linear interpolation. B0 and rB1 maps were computed using Fast-WASAB1 approach8. APTw3 and Fluid-Suppressed9 APTw maps were computed at 3.5 ppm from water frequency.
Statistical Analysis:
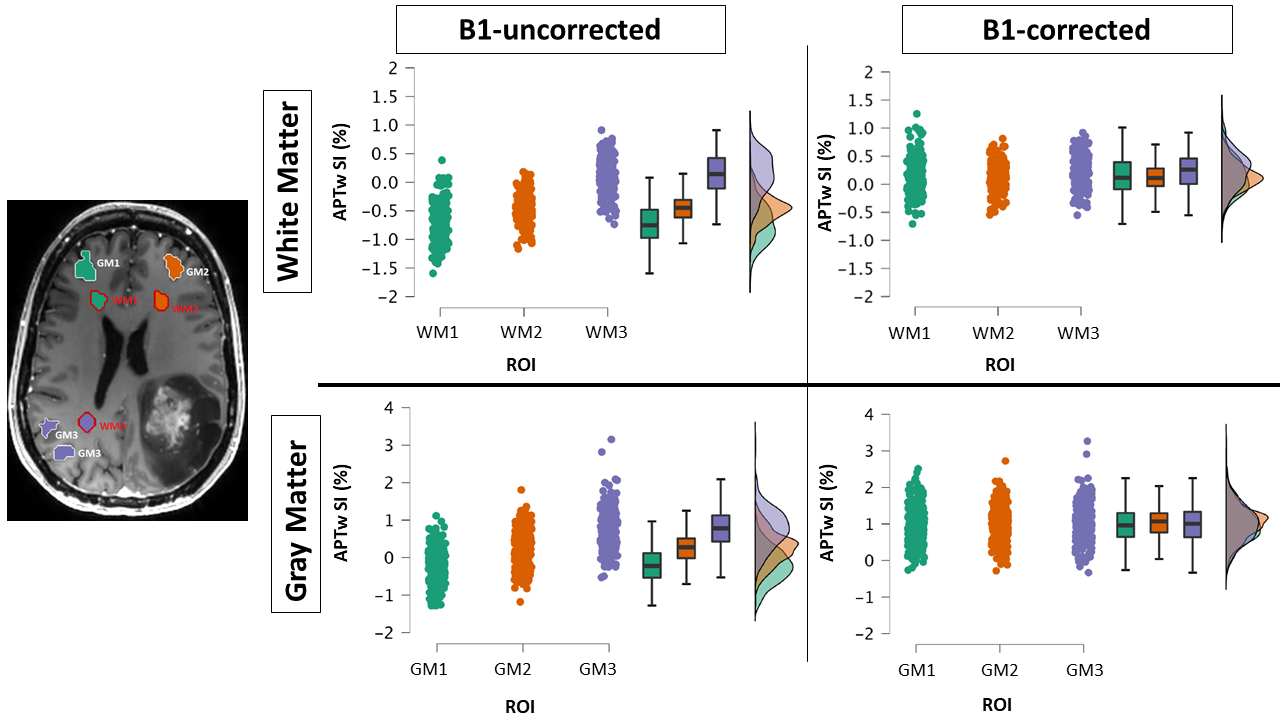
Six distinct 3D volumes of interest (VOIs) were positioned within three distinct remote regions in the normal-appearing white matter (WM) and three in the normal-appearing gray matter (GM). Boxplots and histograms were generated using the APTw map before and after applying the proposed method.
Results
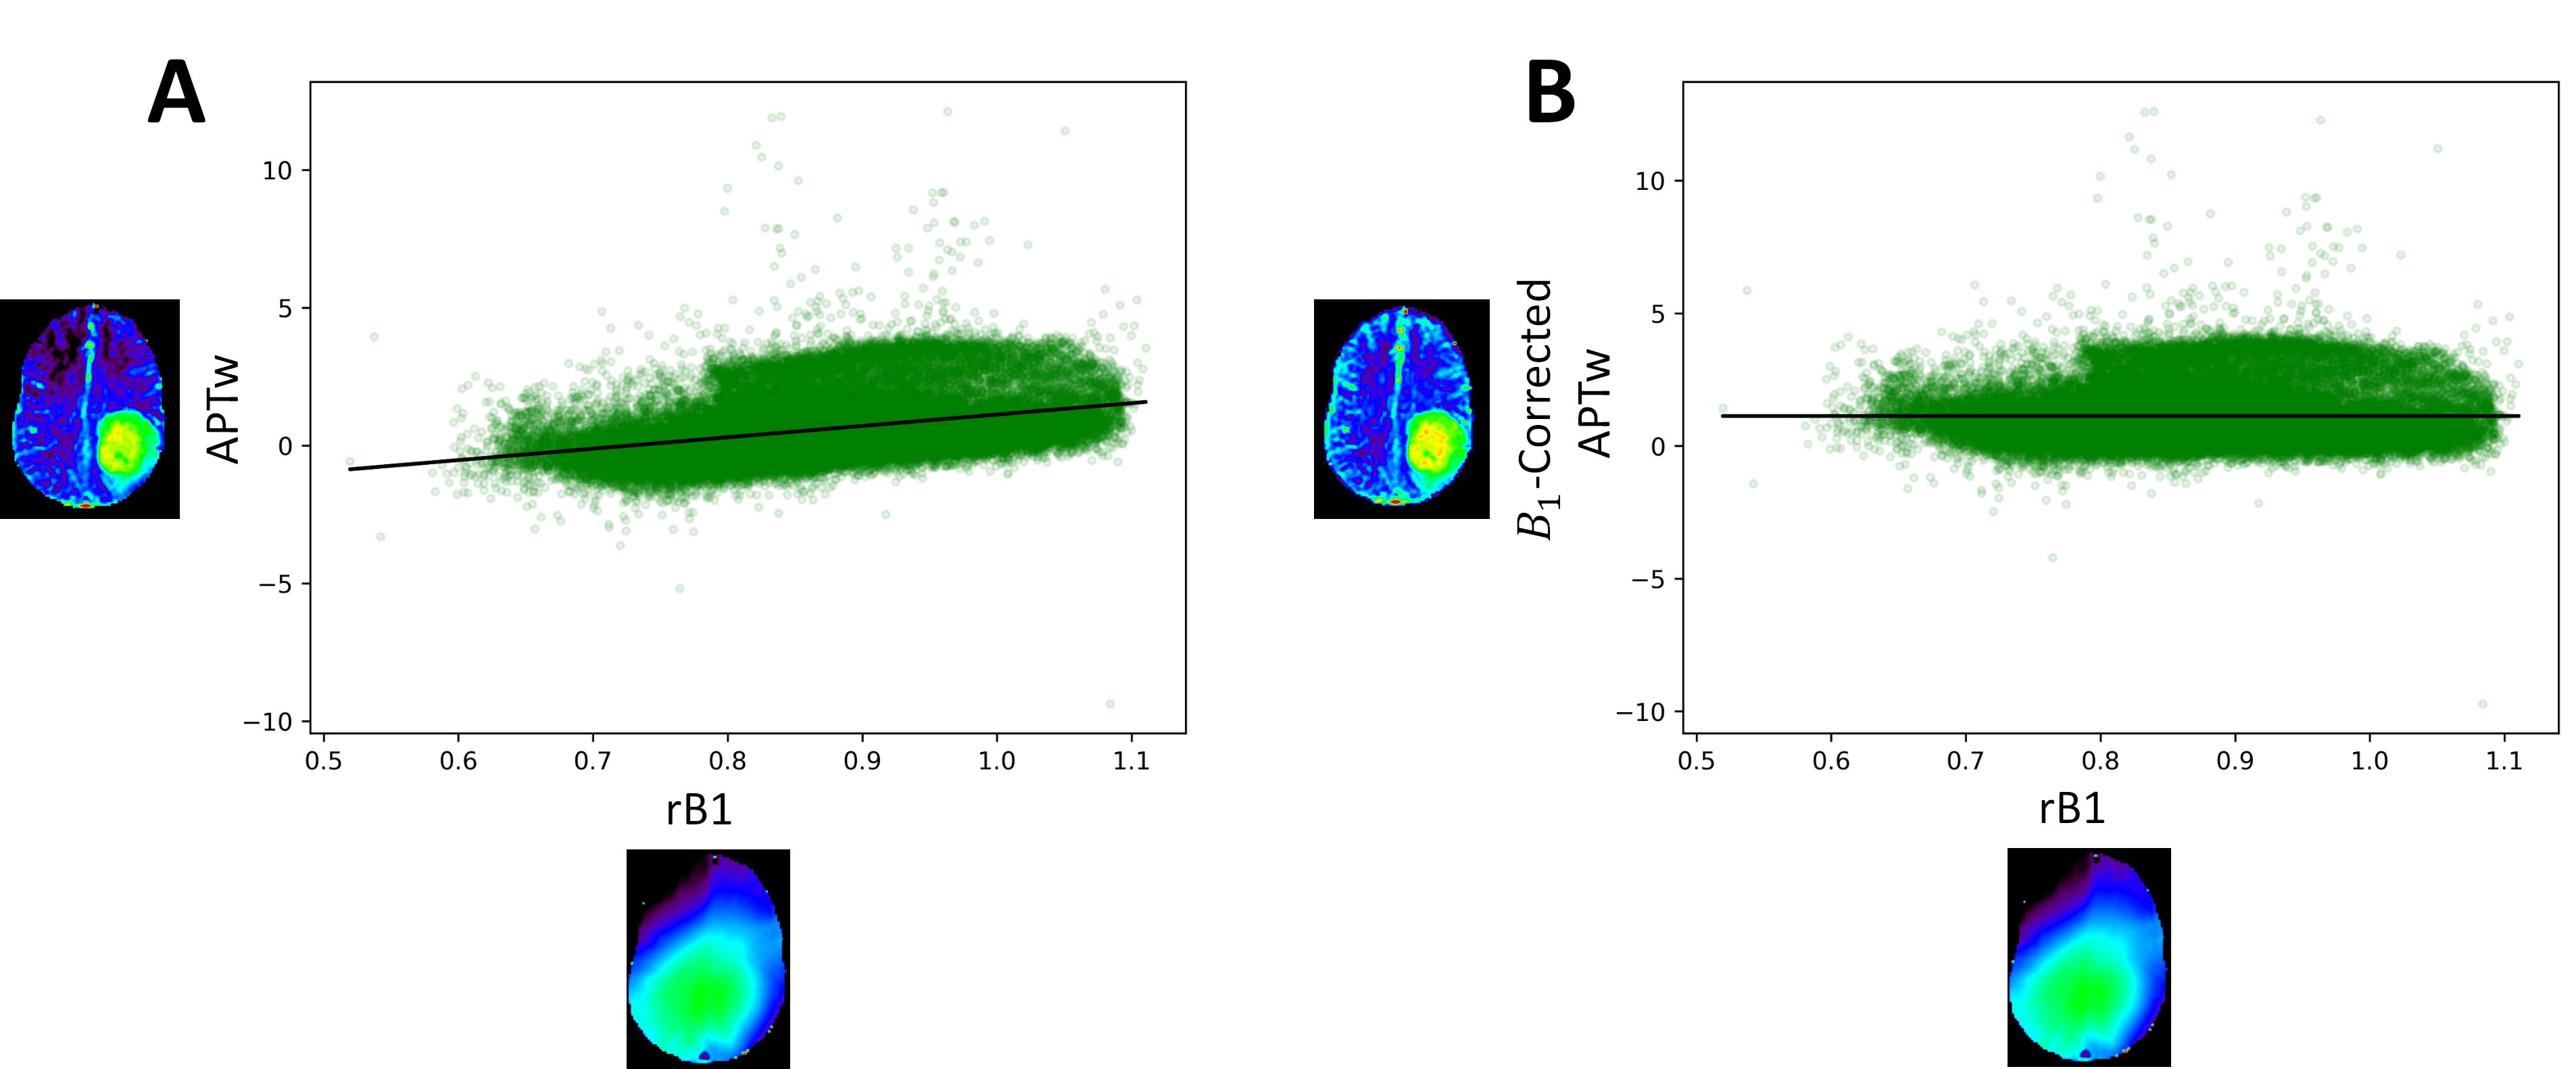
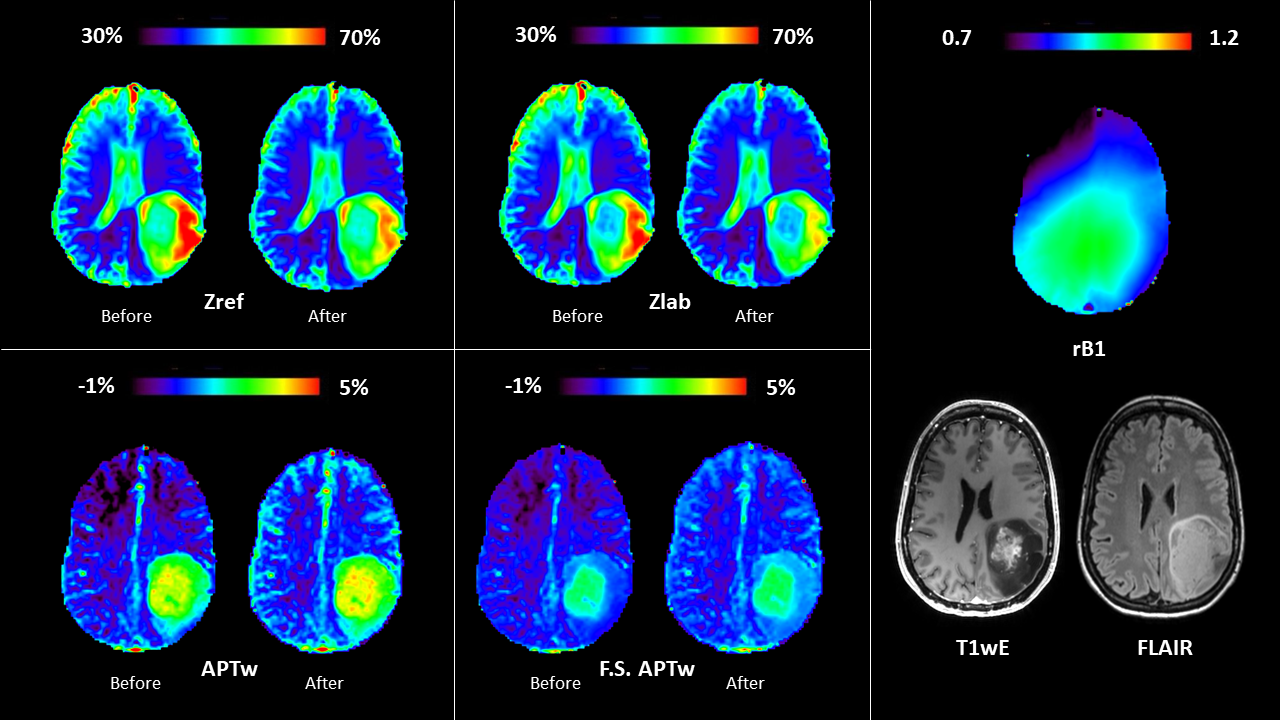
Figure1 illustrates the implementation of our decorrelation method on the APTw map. In Figure1A, the linear association between the APTw map ($$$MTR_{asym}$$$) and the rB1 map is identified and subsequently eliminated from the APTw map, resulting in the generation of B1-corrected APTw data that is independent of the rB1 map. Similar to its application in the APTw map, our decorrelation method can be extended to the $$$Z_{ref}$$$, $$$Z_{lab}$$$, and fluid-suppressed APTw maps (Figure2). This procedure significantly diminishes B1 inhomogeneity-induced artifacts in the contrast of these maps, notably visible in the frontal lobe. Figure3 presents the outcomes of the three VOIs in the WM and GM, displaying the APTw data before and after the implementation of our method. Post-method application, both the median and the overall profile of the histograms demonstrate increased similarity, indicating enhanced homogeneity in both WM and GM.DISCUSSION AND CONCLUSION
In this study, we introduced a data-driven B1-correction method that significantly improves contrast homogeneity in both WM and GM applied to an APTw clinical case. This method, requiring no additional acquisitions, adds significant value to the clinical application of APTw, improving associated statistical analyses and discrimination thresholds. In upcoming studies, our objective is to enhance B1 correction using a more advanced model (beyond linear), broaden the dataset, and further extend decorrelation algorithms for B0 correction.Acknowledgements
This project has received funding from the Department of Health’s NHR-funded Biomedical Research Centre at University College London and the German Research Foundation DFG ZA 814/5-1. SB and LM are supported by the National Institute of Health Research Biomedical Research Council, UCL Hospitals NHS Trust.References
1- Windschuh, Johannes, et al. "Correction of B1‐inhomogeneities for relaxation‐compensated CEST imaging at 7 T." NMR in biomedicine 28.5 (2015): 529-537.
2- Goerke, Steffen, et al. "Relaxation‐compensated APT and rNOE CEST‐MRI of human brain tumors at 3 T." Magnetic resonance in medicine 82.2 (2019): 622-632.
3- Zhou, Jinyuan, et al. "Review and consensus recommendations on clinical APT‐weighted imaging approaches at 3T: application to brain tumors." Magnetic resonance in medicine 88.2 (2022): 546-574.
4- Sedykh, Maria, et al. "snapshot CEST++: the next snapshot CEST for fast whole‐brain APTw imaging at 3T." NMR in Biomedicine (2023): e4955.
5- Schuenke, Patrick, et al. "Simultaneous mapping of water shift and B1 (WASABI)—application to field‐inhomogeneity correction of CEST MRI data." Magnetic resonance in medicine 77.2 (2017): 571-580.
6- Casagranda, Stefano, et al. Principal Component selections and filtering by spatial information criteria for multi-acquisition CEST MRI denoising. In Proceedings of the 31st Annual Meeting of the ISMRM 2022. Abstract 2080.
7- Klein, Stefan, et al. Elastix: a toolbox for intensity-based medical image registration. IEEE transactions on medical imaging, 2009, 29.1: 196-205.
8- Papageorgakis, Christos, et al. "CEST 2022–Fast WASABI post-processing: Access to rapid B0 and B1 correction in clinical routine for CEST MRI." Magnetic Resonance Imaging (2023).
9- Schüre, Jan-Rüdiger, et al. " Fluid-suppression in APTw CEST imaging – new theoretical insights and clinical benefits". Magnetic resonance in medicine (2023) doi:10.1002/mrm.29915.
Figures