4467
A Simple Approach for Quantifying T1 and Macromolecular Proton Fraction from Rapid Inversion Recovery with 3D stack-of-spiral FLASH readout1Department of Biomedical Engineering, Johns Hopkins University School of Medicine, Baltimore, MD, United States, 2Russell H. Morgan Department of Radiology and Radiological Science, Johns Hopkins University School of Medicine, Baltimore, MD, United States, 3The F.M. Kirby Research Center for Functional Brain Imaging, Kennedy Krieger Institute, Baltimore, MD, United States
Synopsis
Keywords: Magnetization Transfer, Magnetization transfer, T1, stack-of-spiral FLASH
Motivation: Simultaneous Quantification of T1 and macromolecular proton fraction (fm) is desired but current methods are time consuming.
Goal(s): To develop an approach for quantitative mapping of both apparent T1 and fM from inversion recovery (IR) curves.
Approach: IR curves with efficient 3D stack-of-spiral FLASH readout were fitted with a monoexponential function, extracting both the apparent T1 and the inversion degree with the latter to determine fm. This method was evaluated through theory, simulation, phantom, and brain experiments.
Results: This study demonstrated a simple and rapid approach for 3D mapping of both apparent T1 and fm.
Impact: A simple and rapid approach for quantitative mapping of both apparent T1 and macromolecular proton fraction (fm) will help understanding the T1 contrast mechanism and facilitate developing pathological biomarkers for various clinical applications.
Introduction
Tissue T1 values have long been recognized to be inversely correlated with the macromolecular proton fraction (fm) and iron content1. Several methods have been investigated to measure fM based on classic two-pool exchange models of magnetization transfer (MT)2,3.Inversion recovery (IR) is the gold standard for T1 mapping but is limited by the long scan time due to using TR>>T1. IR curves have also been fitted with biexponential functions to estimate multiple MT parameters4-7, including R1 of both free water proton pool (R1,w) and the bounded macromolecular proton pool (R1,m), fm, and the exchange rate from macromolecular proton pool to water proton pool (km). The R1,m and Km have been found to be much less tissue dependent than other parameters4-13.
Here we propose a simple and rapid approach for quantitative mapping of both apparent T1 and fm simultaneously from IR curves with short TR and efficient 3D stack-of-spiral FLASH readout.
Methods
Based on two-pool exchange model characterized by Bloch- McConnell equation7,15,16:$$\frac{dMz_m}{dt} = (M_{0,m}-M_{z,m})R_{1,m}-k_mM_{z,m}+k_wM_{z,w}.\\
\frac{dMz_w}{dt} = (M_{0,w}-M_{z,w})R_{1,w}-k_wM_{z,w}+k_mM_{z,m}. \tag{1}$$
where, kw denotes rate for reverse exchange $$$(k_{w}=k_{m}\frac{f_{m}}{(1-f_{m})})$$$. The analytical solution is characterized by a biexponential function:
$$\frac{M_{z,w(t)}}{M_{0,w}} = 1- a_{s}e^{-\lambda_st} - a{_f}e^{-\lambda_ft}. \tag{2}$$
The slow/fast relaxation rates, λs/λf, and their coefficients, as/af, can be derived,
$$2\lambda_{f,s} = R_w+R_m + k_w + k_m\pm\sqrt{(R_w-R_m + k_w -k_m)^2 + 4k_wk_m}.\\
a_{s,f} = \pm\frac{(R_w + k_w -\lambda_{f,s}(1-\frac{M_{z,w(0)} }{M_{0,w} } ) -k_w (1-\frac{M_{z,m(0)}}{M_{0,m}})}{\lambda_s-\lambda_f}. \tag{3}$$
In simulation, these parameters were assumed7,14: Rw=0.4Hz (T1,w=2500ms), Rm=5Hz (T1,m=200ms), km=20Hz for in-vivo11-13 and km=50Hz for phantom13, fm=0.3 for white matter and fm=0.15 for gray matter.
The coefficient as and its derived inversion degree (acos(1- as)) were found to be monotonically decreasing with increasing fm (Fig.1a,b). Recognizing that λf is more than 20 times larger than λs, inversion times (TIs) much longer than 1/λf (<40ms) can be sampled to fit a monoexponential function extracting both 1/λs which is just the apparent T1 and the inversion degree which is dependent on fm. This is in contrast to using very short TIs to sample the biexponential function by other IR methods4-7.
The simulations of the IR sequence (described below) with two-pool exchange model (Eq.1) was performed. The simulated results indicated that fm and inversion degree have a linear relationship (Fig.1c):
$$Phantom: k_m = 50Hz, Inversion degree = -86.3f_m + 155.9.\\
In-vivo: k_m =20Hz, Inversion degree = -78.2f_m +157.2. \tag{4}$$
A MT Phantom was prepared, consisting of 16 different tubes: 4 tubes of cross-linked bovine serum albumin (BSA)13with 5/10/15/20%w/v concentrations; 5 Gadoteridol (Prohance) tubes with 0.048/0.068/0.097/0.140/0.230mmol/L concentrations; 5 tubes of 10%w/v BSA added gadoteridol with the same concentrations listed above; a phosphate buffer saline (PBS) tube and an agarose gel tube made as reference.
Experiments were performed on a 3T Philips scanner using a 32-channel head-only receive coil and three young healthy subjects were recruited. Our IR sequence started with a global saturation pulse with a fixed saturation delay of 2s followed by an 15ms hyperbolic-secant adiabatic inversion pulse with 7 logarithmically spaced TI from 100ms to 3000ms. It utilized a 3D stack-of-spiral turbo FLASH (TFE) readout17 with TFE factor=75 and SENSE factor=2. The FOV and acquisition resolution were set to be 200×200×120mm3 and 1.0×1.0×1.0 mm3. The scan duration was about 7.3min. 3-parameter fitting model was used to fit T1, inversion degree, and M0. Then fm map can be converted from inversion degree maps using Eq. (4). If the calculated fm was negative, it was set to be zero.
Results and Discussion
The T1, inversion degree and fm maps of MT phantom is illustrated in Fig. 2. In column 1 and column 3, the T1 values increased with decreasing Gd concentrations, while the inversion degree did not change much. In column 2, both T1 and inversion degree increased with lowering BSA concentrations as expected. The mean values of T1, inversion degree and fm of each tube is summarized in Table 1.The T1, inversion degree and fm maps of one slice from a subject’s brain is illustrated in Fig.3. The inversion degree in white matter were markedly lower than in gray matter, which was not expected as an adiabatic pulse was typically assumed to yield uniform and full inversion. The calculated T1 and fm values from frontal and posterior white matter, putamen and cortical gray matter ROIs were around 961ms, 927ms, 1160ms, 1568ms, and 0.22, 0.20, 0.14, 0.12, respectively (Table 2).
Conclusion
Through theory, simulation, phantom and in vivo experiments, this study demonstrated a simple and rapid IR based approach for quantitative 3D mapping of both apparent T1 and fm simultaneously. Further acceleration through compressed sensing and more validation is under investigation.Acknowledgements
No acknowledgement found.References
1. Rooney, William D., et al. "Magnetic field and tissue dependencies of human brain longitudinal 1H2O relaxation in vivo." Magnetic Resonance in Medicine: An Official Journal of the International Society for Magnetic Resonance in Medicine57.2 (2007): 308-318.
2. Sled, John G. "Modelling and interpretation of magnetization transfer imaging in the brain." Neuroimage 182 (2018): 128-135.
3. Kisel, Alena A., Anna V. Naumova, and Vasily L. Yarnykh. "Macromolecular proton fraction as a myelin biomarker: principles, validation, and applications." Frontiers in neuroscience 16 (2022): 819912.
4. Gochberg, Daniel F., and John C. Gore. "Quantitative magnetization transfer imaging via selective inversion recovery with short repetition times." Magnetic Resonance in Medicine: An Official Journal of the International Society for Magnetic Resonance in Medicine 57.2 (2007): 437-441.
5. Li, Ke, et al. "Optimized inversion recovery sequences for quantitative T1 and magnetization transfer imaging." Magnetic Resonance in Medicine 64.2 (2010): 491-500.
6. van Gelderen, Peter, Xu Jiang, and Jeff H. Duyn. "Effects of magnetization transfer on T1 contrast in human brain white matter." NeuroImage 128 (2016): 85-95.
7. Wang, Yicun, et al. "B0-field dependence of MRI T1 relaxation in human brain." NeuroImage 213 (2020): 116700.
8. Dortch, Richard D., et al. "Quantitative magnetization transfer imaging in human brain at 3 T via selective inversion recovery." Magnetic resonance in medicine 66.5 (2011): 1346-1352.
9. Dortch, Richard D., et al. "Optimization of selective inversion recovery magnetization transfer imaging for macromolecular content mapping in the human brain." Magnetic resonance in medicine 80.5 (2018): 1824-1835.
10. Cronin, Matthew J., et al. "Rapid whole-brain quantitative magnetization transfer imaging using 3D selective inversion recovery sequences." Magnetic resonance imaging 68 (2020): 66-74.
11. Yarnykh, Vasily L. "Fast macromolecular proton fraction mapping from a single off‐resonance magnetization transfer measurement." Magnetic resonance in medicine 68.1 (2012): 166-178.
12. Yarnykh, Vasily L. "Time‐efficient, high‐resolution, whole brain three‐dimensional macromolecular proton fraction mapping." Magnetic resonance in medicine 75.5 (2016): 2100-2106.
13. Xu, Jiadi, et al. "On‐resonance variable delay multipulse scheme for imaging of fast‐exchanging protons and semisolid macromolecules." Magnetic resonance in medicine 77.2 (2017): 730-739.
14. van Gelderen P, Jiang X, Duyn J H. Rapid measurement of brain macromolecular proton fraction with transient saturation transfer MRI[J]. Magnetic resonance in medicine, 2017, 77(6): 2174-2185.
15. McConnell H M. Reaction rates by nuclear magnetic resonance[J]. The Journal of chemical physics, 1958, 28(3): 430-431.
16. Henkelman R M, Huang X, Xiang Q S, et al. Quantitative interpretation of magnetization transfer[J]. Magnetic resonance in medicine, 1993, 29(6): 759-766.
17. Zhu, Dan, et al. "Evaluation of 3D stack‐of‐spiral turbo FLASH acquisitions for pseudo‐continuous and velocity‐selective ASL–derived brain perfusion mapping." Magnetic resonance in medicine (2023).
Figures
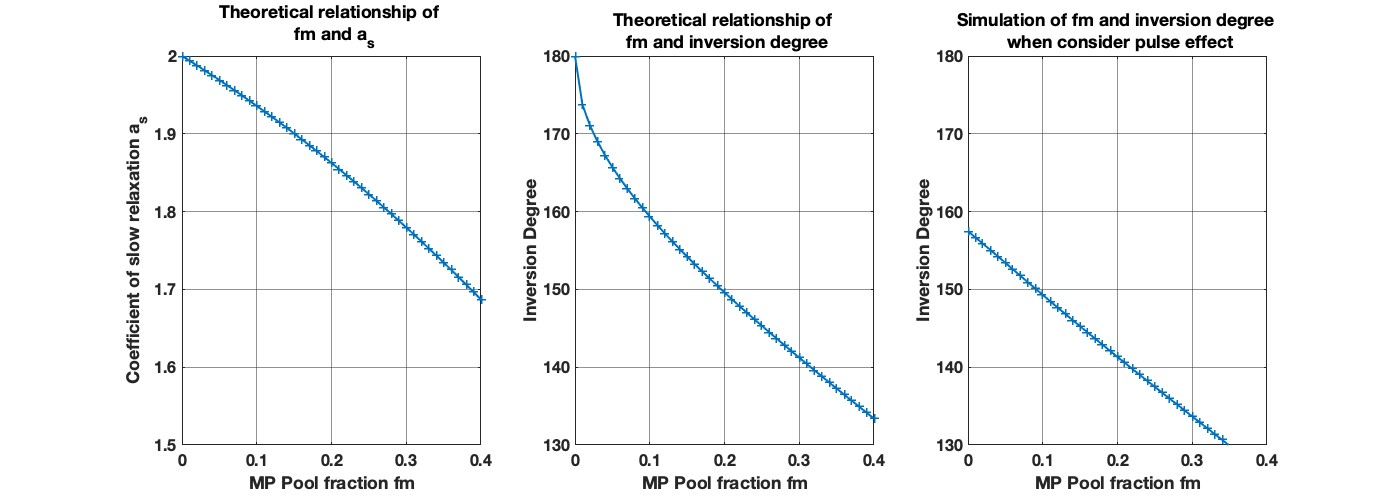
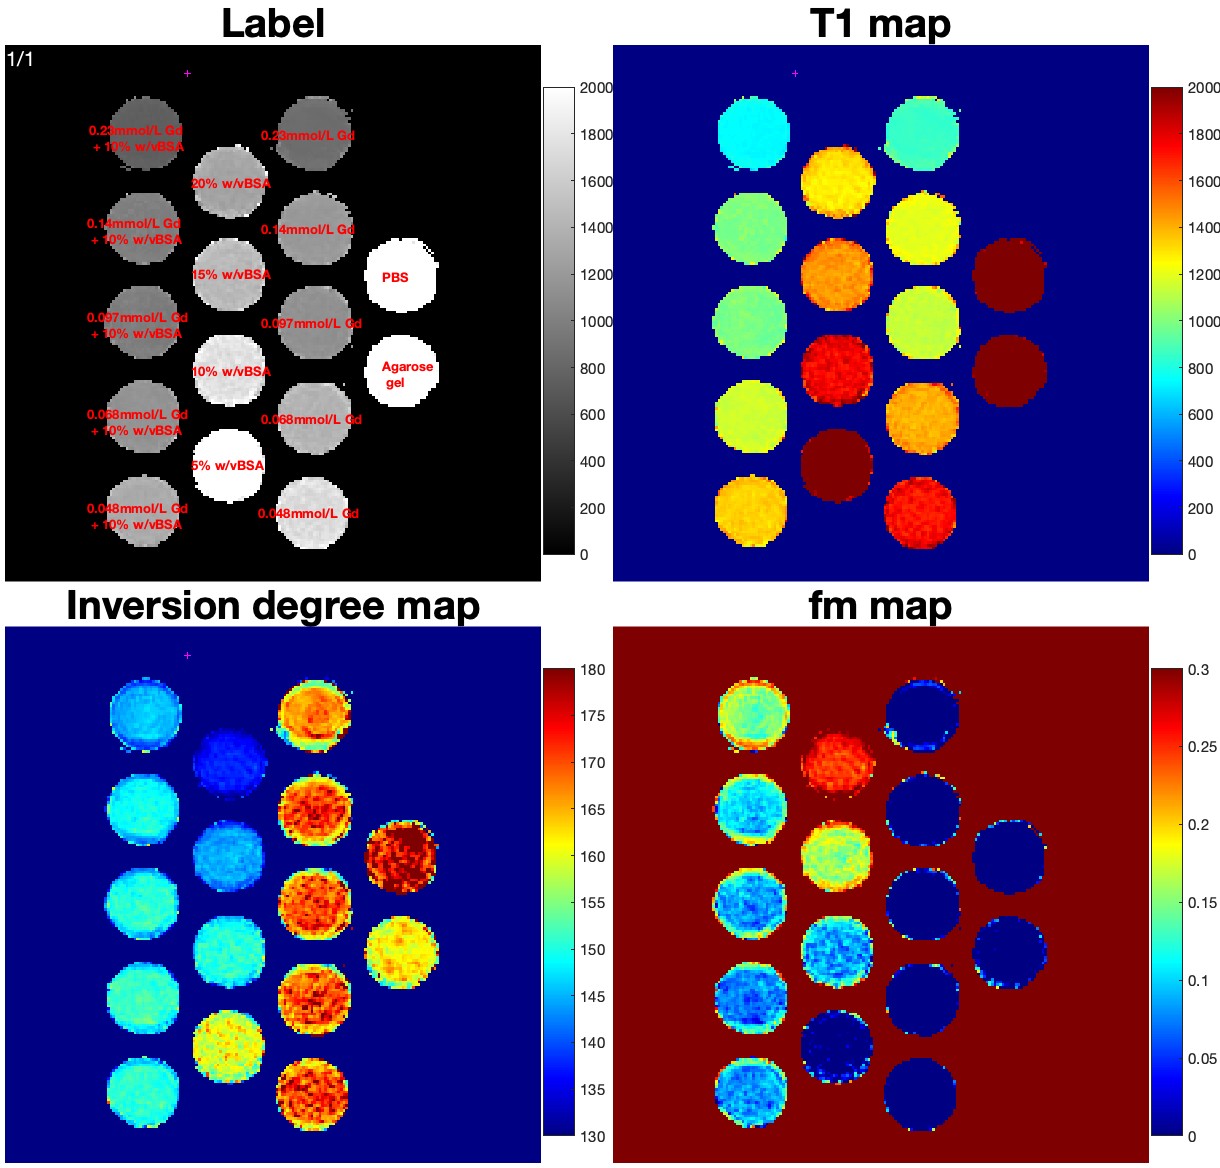
Fig.2. (a) The components of 16 tubes in the MT phantom. Columns from left to right: 5 tubes of 10% w/v BSA added five different gadoteridol concentrations; 4 BSA tubes with different % w/v; 5 different gadoteridol tubes with the same concentration as column1; PBS and agarose gel tubes. (b) fitted T1 map in ms. (c) fitted inversion degree map. (d) fm map converted from the inversion degree map using Eq. [4] with km=50Hz. The BSA tubes (column 2) showed decreasing fmwith increasing BSA concentrations, while the gadoteridol tubes (column 3) and PBS/agarose gel tubes all showed close to zero fm.
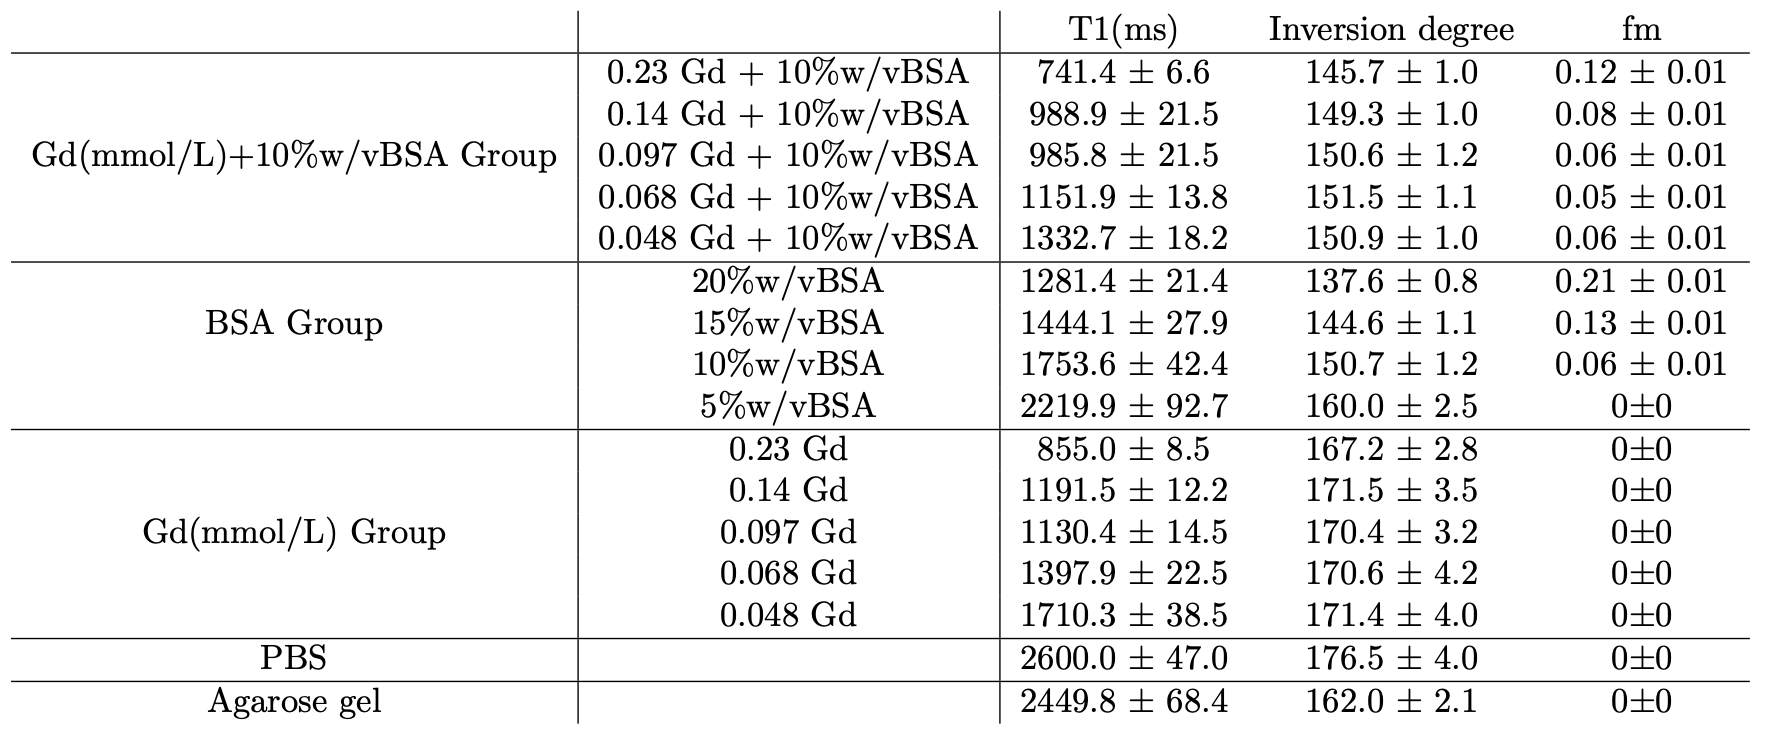
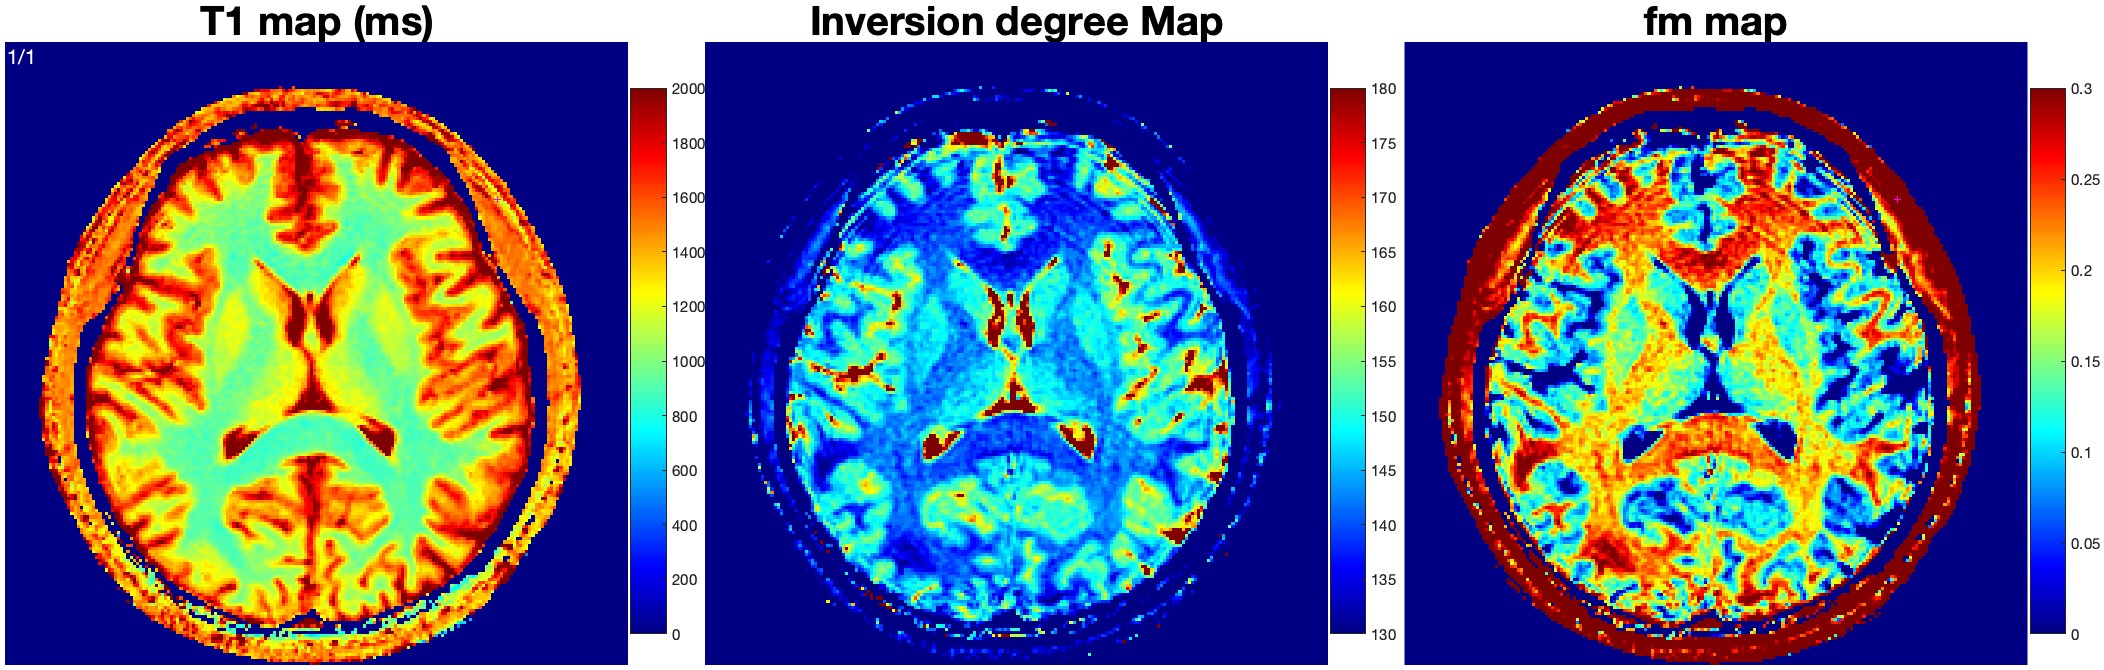
Fig.3. A representative slice of T1 map, inversion degree map, and fm map from one healthy subject. Instead of achieving uniform close-to-full inversion as expected from an adiabatic pulse, inversion degrees from white matter areas were markedly lower than those of gray matter regions. The fm map was converted from the inversion degree map using Eq.(4) with km=20Hz, showing higher fm in white matter than in gray matter, while fm of CSF in lateral ventricles and subarachnoid space close to zero.
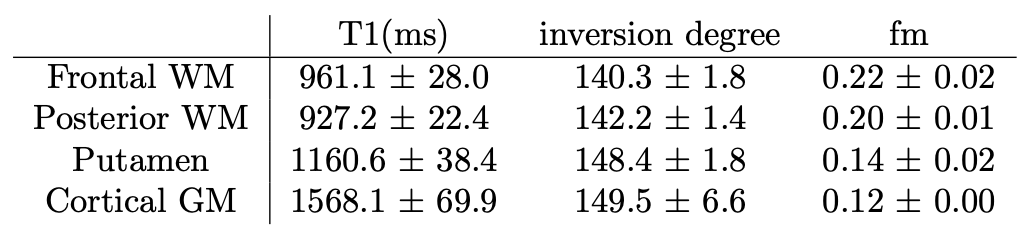
Table 2. The mean and std of T1, inversion degree, and fm values from the ROIs of frontal white matter, posterior white matter, putamen, and gray matter cortex.