4466
Advancing Z-Spectrum Analysis Protons (ZAP) Using Machine Learning with Random Forest Regression.1Radiology, UC San Diego, La Jolla, CA, United States
Synopsis
Keywords: Magnetization Transfer, CEST & MT, Z-Spectrum, AI
Motivation: To overcome long scan times in MRI's Z-Spectrum Analysis Protons (ZAP), impairing its clinical utility and patient comfort.
Goal(s): This study aimed to refine ZAP, targeting a reduction in scan duration while maintaining high accuracy in proton exchange measurements.
Approach: We applied Random Forest Regression to identify key offset frequencies, focusing on the most informative data and potentially reducing the scanning time.
Results: Our approach successfully reduced scan times without compromising accuracy. The RFR model’s predictions aligned closely with traditional ZAP methods, indicating that fewer offset frequencies are needed for reliable data interpretation.
Impact: This study may allow for targeted anatomical and disease-specific imaging with reduced scan times, potentially improving diagnostic accuracy and patient experience, and facilitating quicker, more focused clinical decisions.
Introduction
The Z-spectrum analysis protons (ZAP) characterizes multi-parametric quantitative measurements of macromolecular exchange protons. This is achieved by collecting Magnetization Transfer (MT) data across a wide range of offset frequencies and modeling the Z-spectrum with a two-Lorentzian compartment structure. This model is defined by three parameters: the apparent spin-spin relaxation durations of both restricted (T2r) and free (T2f) protons, along with their relative fraction (Ff and Fr = 1–Ff) [1]. ZAP has been previously utilized to investigate multiple anatomies underscoring its potential as a disease-state discriminator or biomarker [1, 2]. MT imaging data offers a rich source of information suitable for predictive modeling. For this study, we employed the Random Forest Regressor (RFR) algorithm [3]. RFR offers robust non-linear modeling capabilities and excels in managing large datasets with potential collinearities among features. Furthermore, RDR provides quantification of feature importance, which is particularly useful for understanding and reducing the number of features potentially allowing to reduce scan time.Methods
Twenty healthy volunteers, aged between 24 and 62 (average age of 42 ± 15 years), underwent scanning on a clinical 3T scanner (Vantage Galan 3T, Canon Medical, Japan) after giving informed consent. The imaging utilized body and spine SPEEDER coils. The scanning protocol included a 2D single-shot FSE with parameters: TE = 10 ms, NEX = 1, and FA = 90°. It incorporated respiratory gating and MT preparation pulses (20 narrowband sinc, 20 ms duration, and B1rms of 2μT ). The set of 55 off-resonance frequencies spanned from -100 to 100 kHz. Other scanning parameters: FOV = 38×30 cm, matrix size 384×356, capturing a single 5 mm-thick axial slice through the liver. Subsequent analyses employed a two-Lorentzian compartments model to compute Z-Spectrum metrics (T2f, T2r, Ff, Fr) in a manually segmented liver region. Each offset frequency's signal intensity served as a feature, while three independent metrics (T2f, T2r, Ff) acted as labels. Data shuffled on a per-voxel basis, comprised roughly 120,000 entries. This dataset was partitioned into training (80%) and validation (20%) sets. Test data, later obtained from extra two volunteers (25 ± 1-year-old), consisted of two series: (i) using 55 offset frequencies and (ii) a series focusing on the top 20 most important offset frequencies as identified by the RFR. Model training was conducted using the RandomForestRegressor from the sklearn library [4] in Python. A comprehensive hyperparameter search was performed. This search used 3-fold cross-validation, with the model refit based on the R2 score. Performance was evaluated using Mean Absolute Error (MAE), after validation the model was retrained with the best hyperparameters combination on a combined training and validation data. The best model was then cloned and reduced for the 20 features.Results
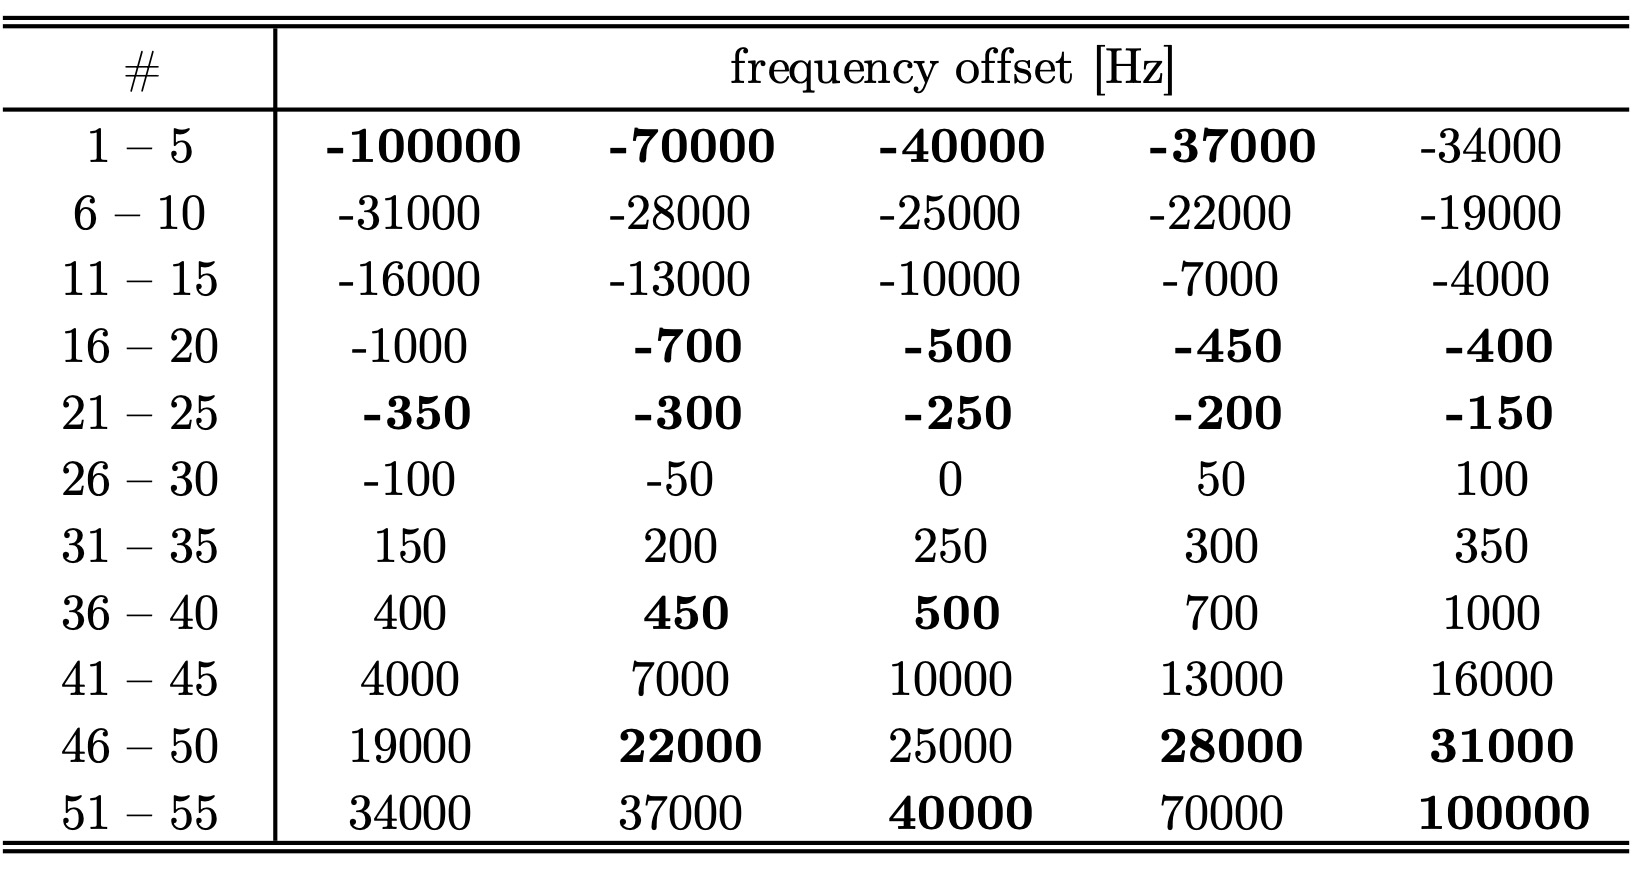
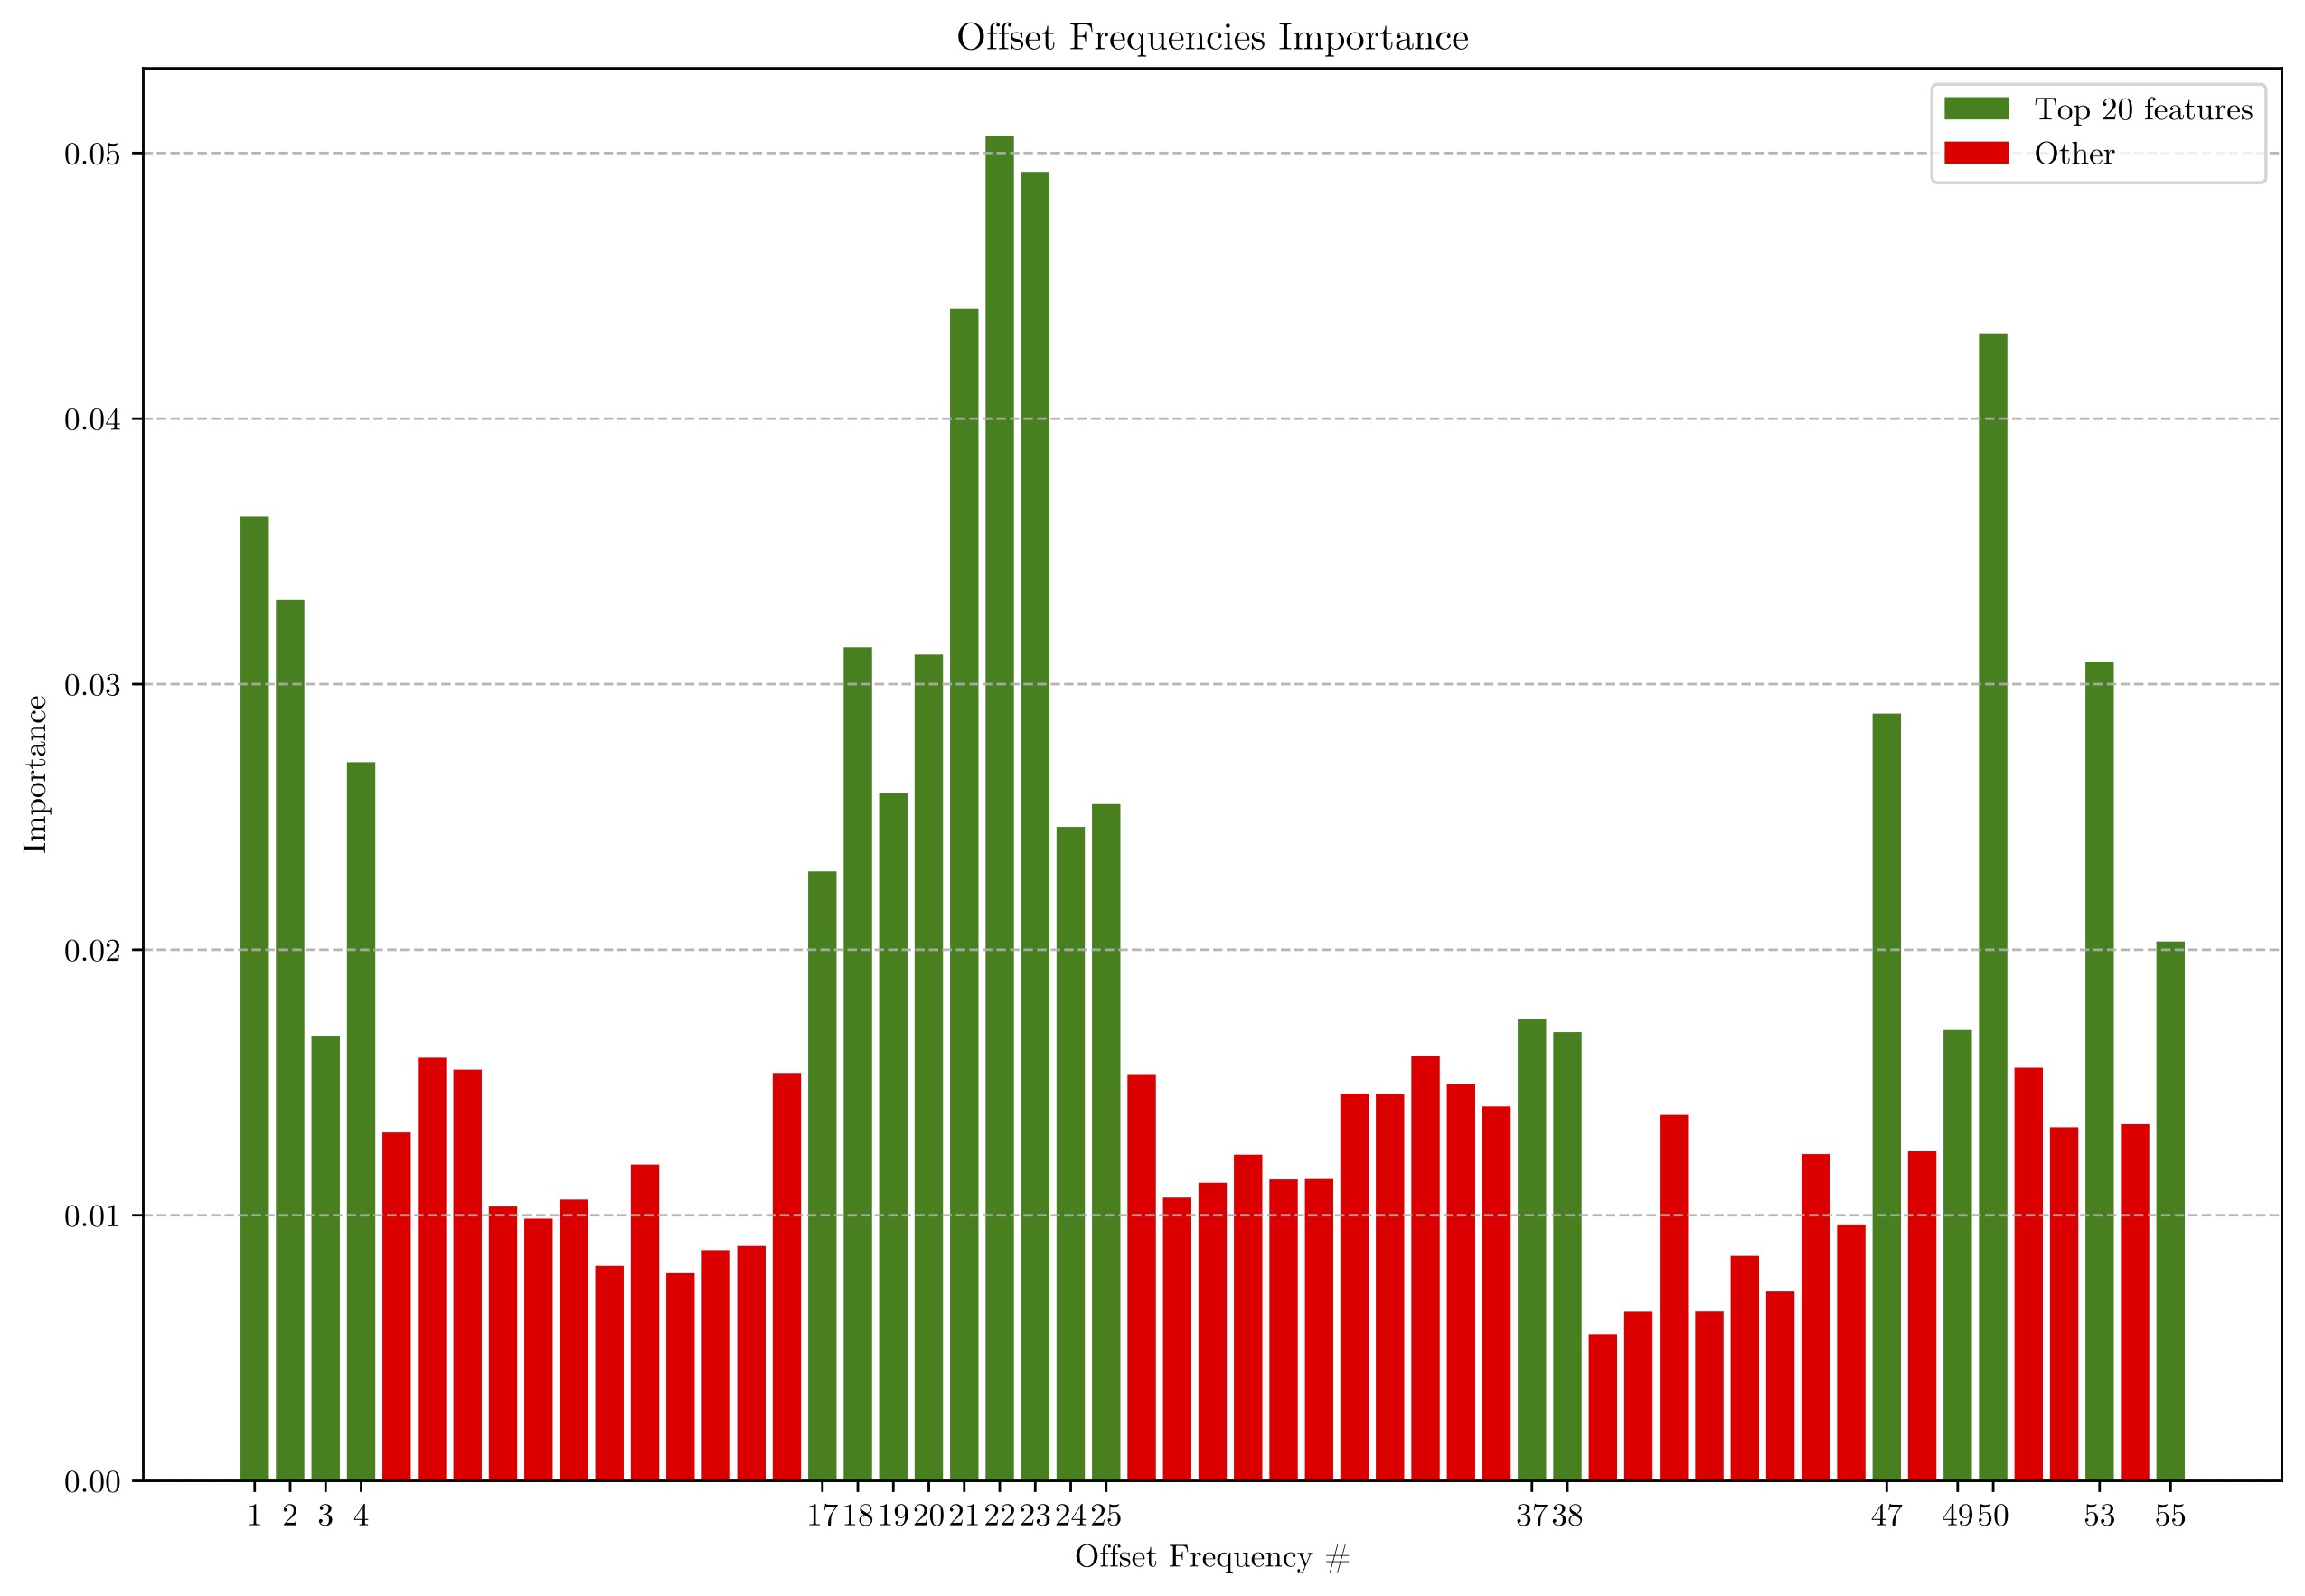
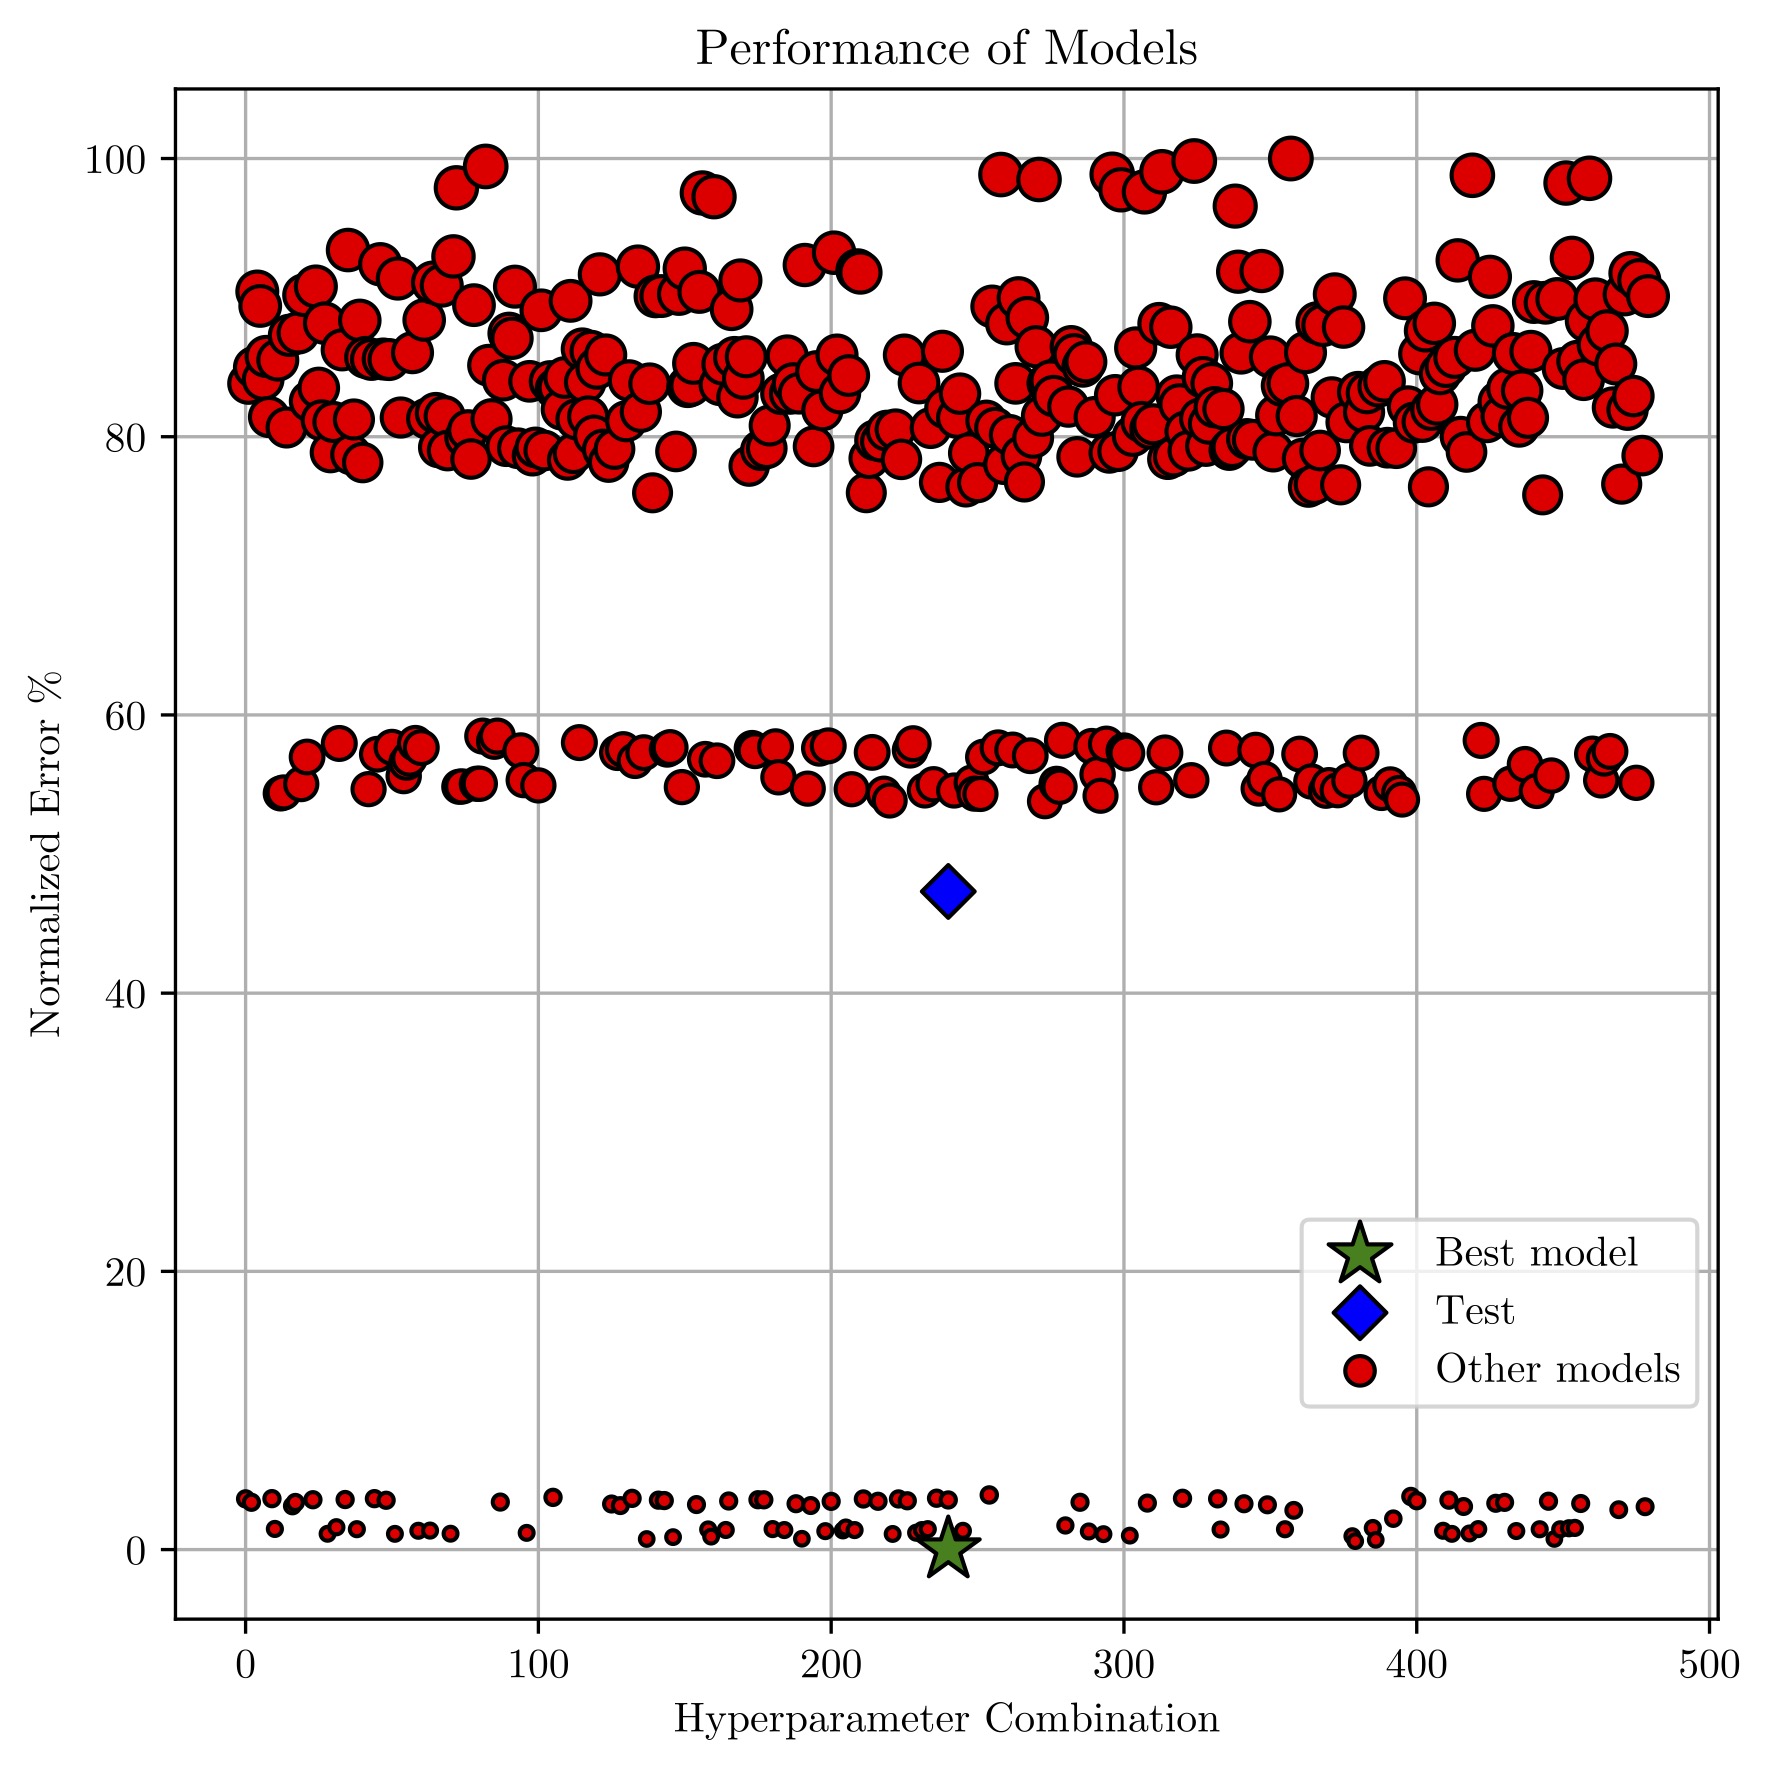
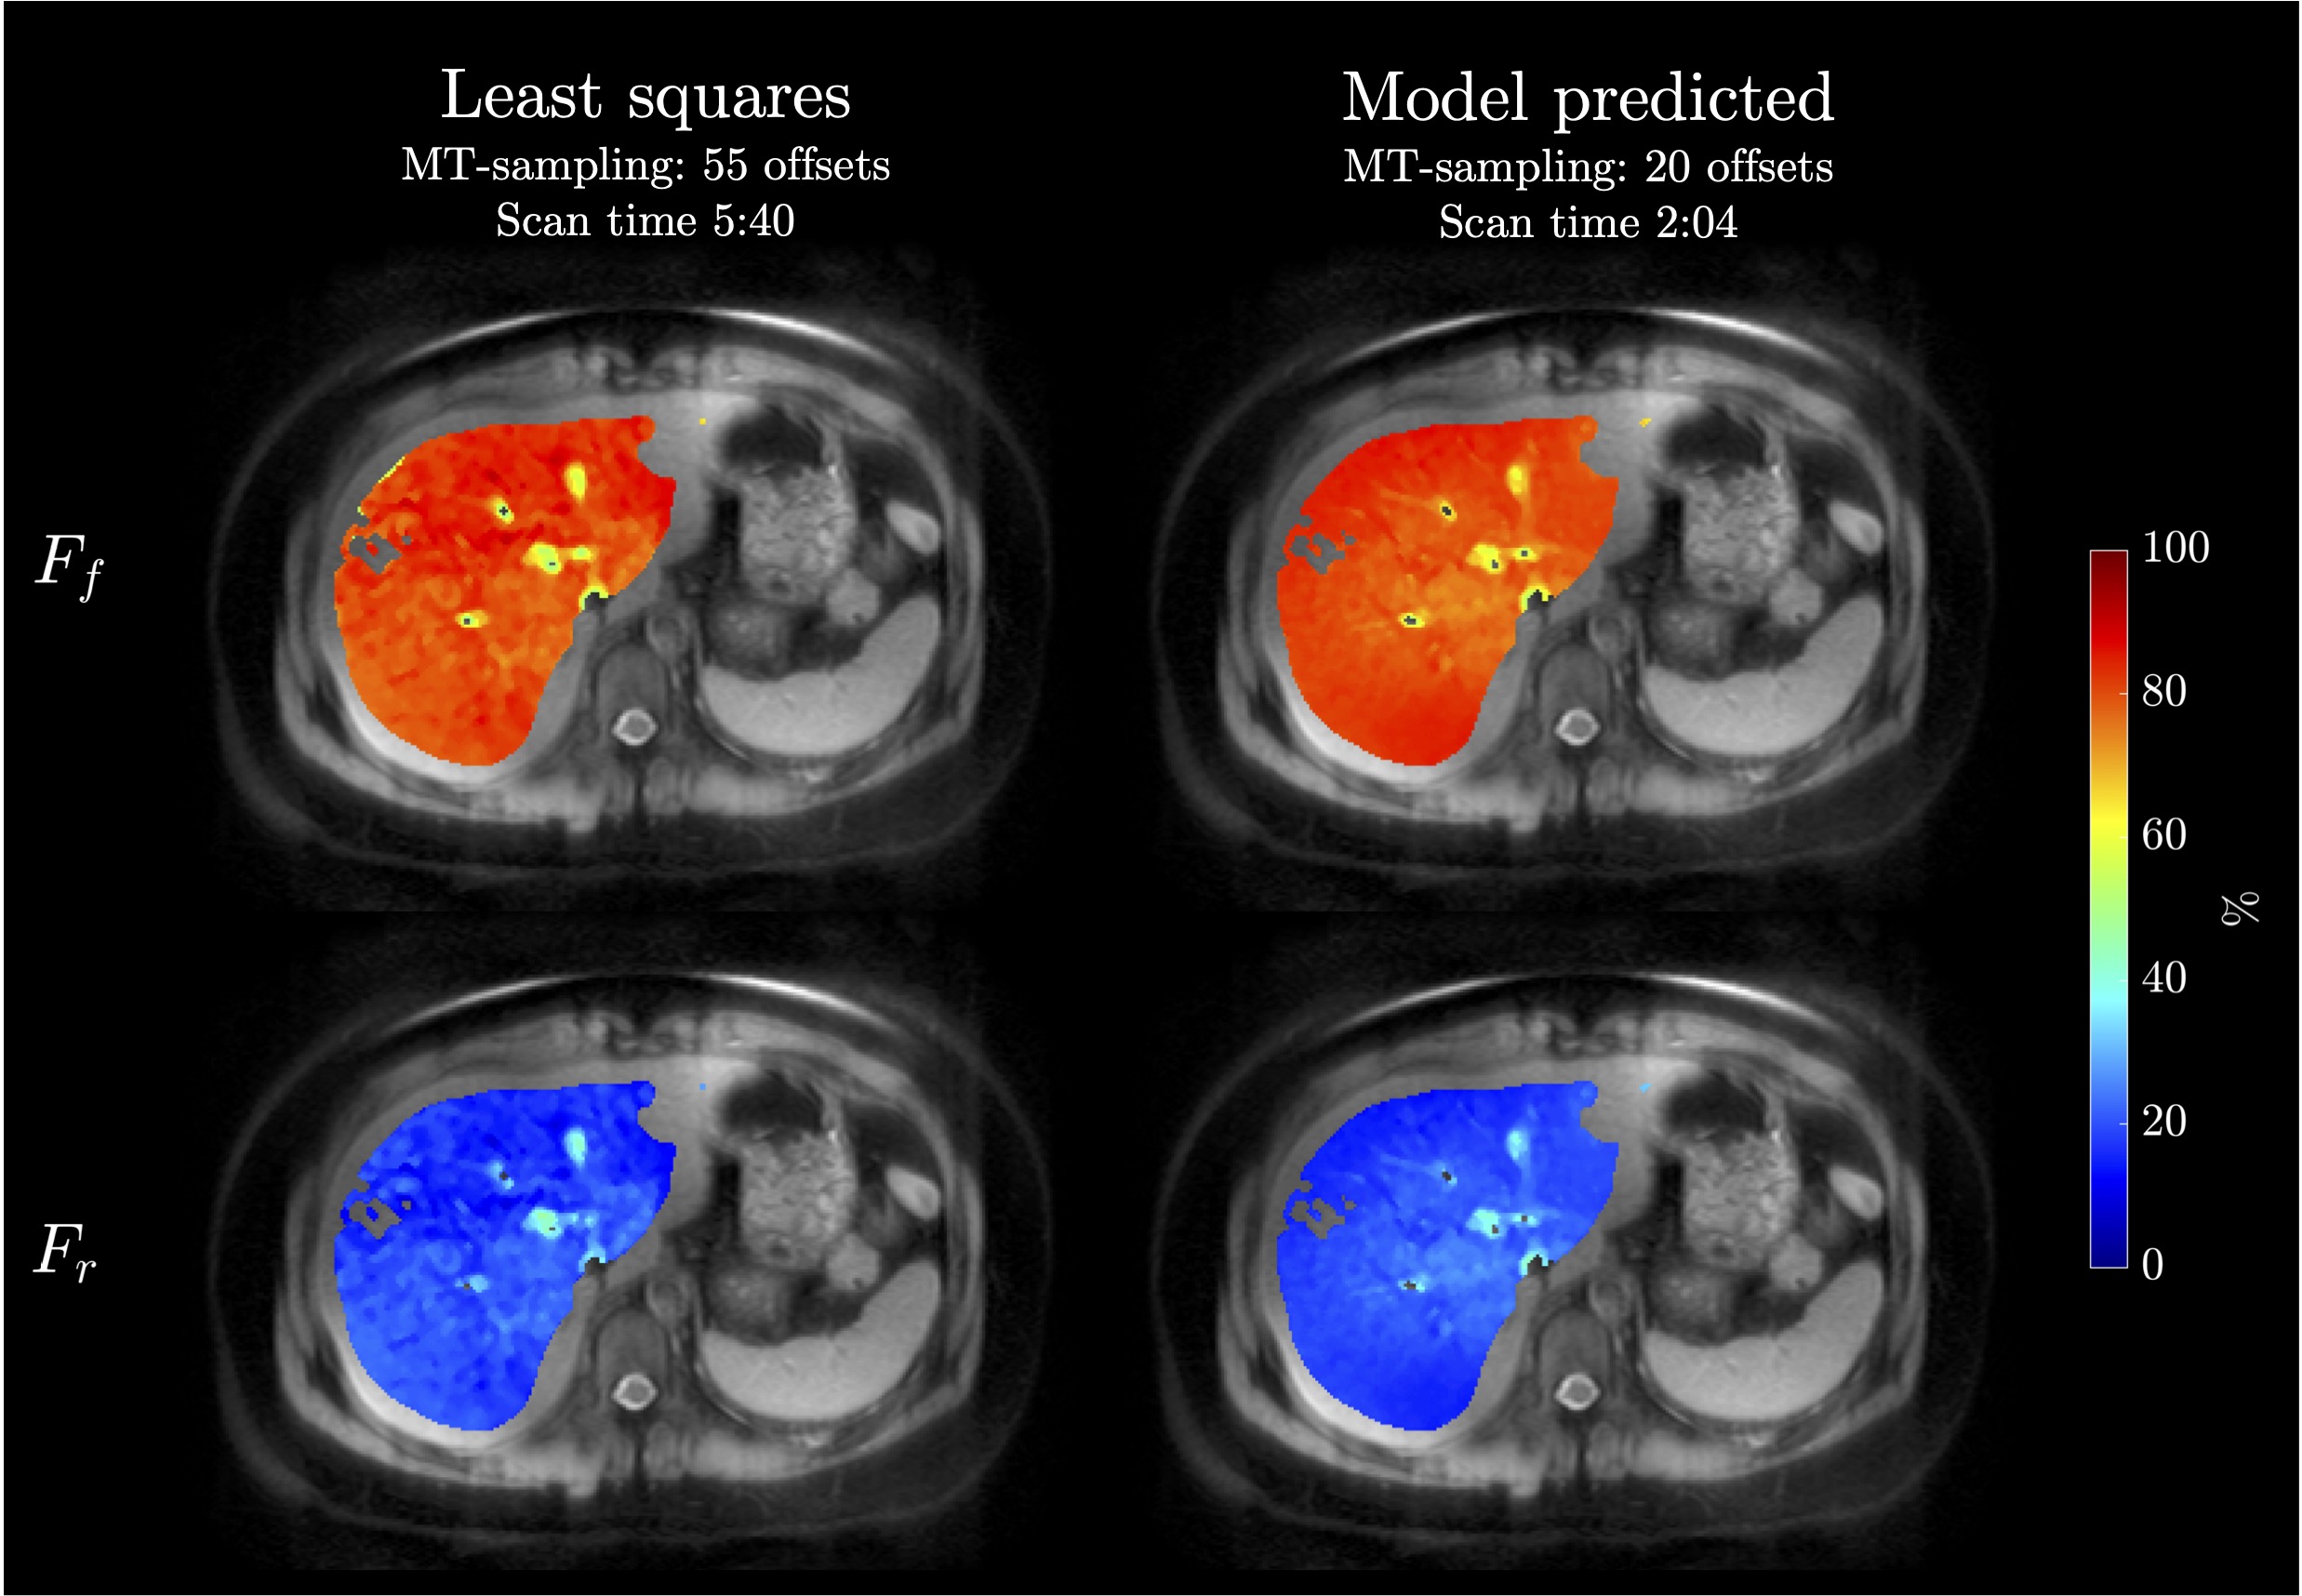
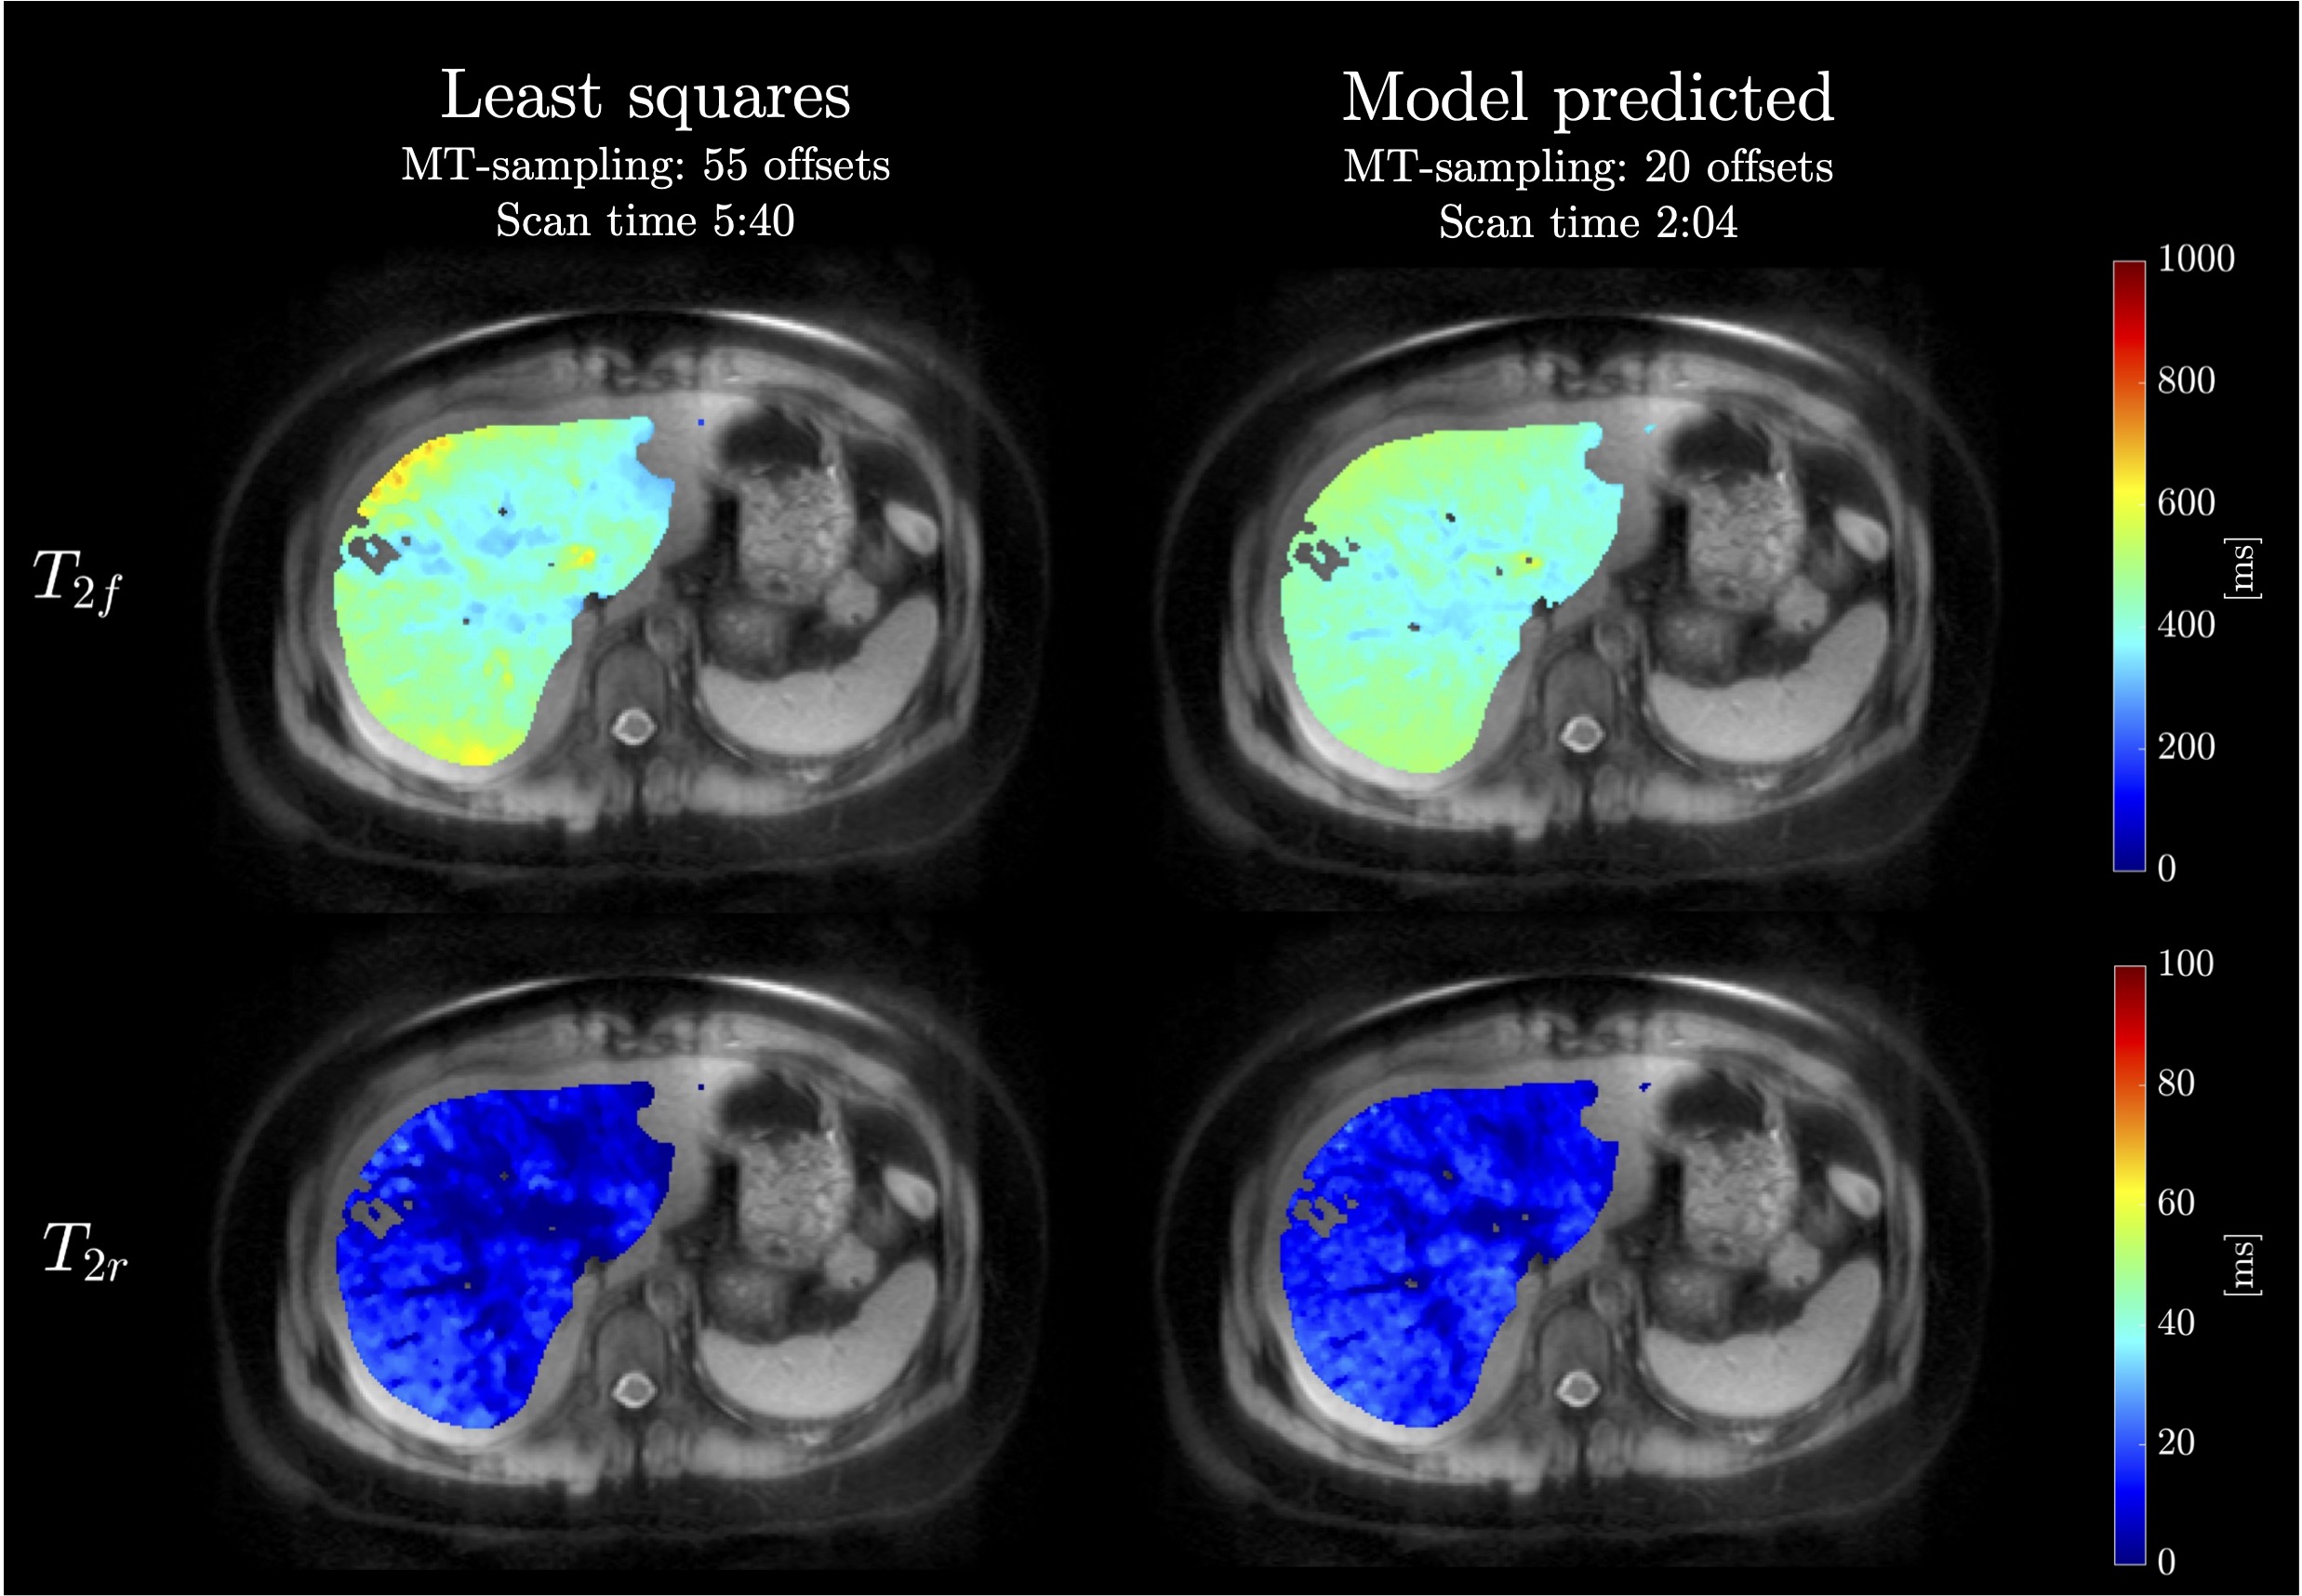
The offset frequencies used for the comprehensive Z-Spectrum sampling are presented in Table 1, with the top 20 frequencies (best RFR model) highlighted in bold. Figure 2 provides a bar chart detailing the importance of each offset frequency: the top 20 in green and the remaining frequencies in red. Figure 3 depicts the performance of the models from the grid search, with the optimal model from the training highlighted by a green star, the MAE from the best model for the reduced number of features is indicated with a blue diamond. Figures 4 illustrates the colormaps of free and restricted exchange proton fractions Ff, Fr as estimated from 55 offset frequencies acquisition using least mean squares and as predicted by the reduced RFR model. Corresponding colormaps for the apparent T2f and T2r are demonstrated in Figure 5.Discussion
The results of this study demonstrate the successful application of the Random Forest Regressor in optimizing the Z-spectrum analysis protons method. By efficiently narrowing down the offset frequencies for MT acquisition, a significant reduction in scan time can be achieved without compromising the accuracy of the predictions. The colormaps in Figures 4 and 5 highlight the RFR model's precision in predicting free and restricted exchange proton fractions (Ff and Fr), as well as the corresponding apparent exchange T2 values (T2f, T2r). These results are in good agreement with those achieved by the traditional least squares fit method, despite the latter requiring data from more than double the number of frequency offsets.Conclusions
The integration of Random Forest Regressor for Z-spectrum analysis optimization is an introductory yet promising advancement. Some limitations and potential improvements to consider are (i) the exclusive use of liver data, (ii) more precise tuning of hyperparameters, and (iii) utilizing the Gradient Boosting technique may enhance the results in future studies.Acknowledgements
This work was supported by a grant from Canon Medical Systems, Japan (35938).References
[1] Miyazaki M., et al., PLOS ONE. 10(3), (2015).
[2] Malis V., et al., in ISMRM. (2023).
[3] Ho T. K, in ICDAR. (1995).
[4] https://scikit-learn.org/
Figures