4463
Obtaining exchange rate maps using Multitasking SS-CEST1Bioengineering, University of California, Los Angeles (UCLA), Los Angeles, CA, United States, 2Biomedical Imaging Research Institute, Cedars Sinai Medical Center, Los Angeles, CA, United States
Synopsis
Keywords: Image Reconstruction, CEST & MT
Motivation: To make qCEST clinically feasible by reducing the imaging time
Goal(s): Multitasking steady-state (SS) approach was used to get 3D volume acquisition that reduced the imaging time per slice by a factor of 22 as compared to conventional qCEST.
Approach: 6 Yucatan minipigs were scanned at four time points post interverbal disk injury. The injury was done at the lower three lumbar discs. Conventional 2D qCEST and 3D Multitasking steady state CEST were performed.
Results: Scan time for conventional qCEST is 24 minutes/slice while the imaging time for Multitasking SS qCEST is 36 minutes for 32 slices, representing a factor of 22 improvement.
Impact: This study represents the initial step in validating an accelerated qCEST using Multitasking. The development of MRI-based pain assessment biomarkers in this model is crucial for advancing our understanding and treatment of lower back pain.
Introduction
Lower back pain is a prevalent health issue, with intervertebral disc (IVD) degeneration accounting for 26%-42% of cases [1]. Quantitative CEST (qCEST) offers a unique biomarker (exchange rate) serving as a proxy for tissue pH. Previous studies have emphasized the significance of exchange rate maps in distinguishing healthy and injured spinal discs [2]. However, current qCEST methods are time-consuming. In this work, we used a Multitasking steady-state (SS) approach [3) to obtain exchange rate maps using a 3D volume acquisition that reduced the imaging time per slice by a factor of 22 as compared to conventional qCEST. The exchange rate maps using SS Multitasking were validated by conventional qCEST in animals.Methods
Yucatan minipigs (n=6) were scanned at four time points post interverbal disk injury (Weeks 4, 8, 12 and 16). Baseline scans were performed before the surgery. The injury was done at the lower three lumbar discs while keeping the upper two intact.Conventional qCEST was done by repeating the CEST scans at four different B1 powers using a two-dimensional reduced field of view TSE CEST sequence (TR/TE=10500/10 ms, 2 averages, single shot). TSE CEST saturation module consisted of 39 Gaussian-shaped pulses, with a duration = 80 ms for each pulse and an interpulse delay = 80 ms (duty cycle = 50%, total saturation duration = 6240 ms) at saturation flip angles of 900, 1500, 2100, and 3000 [B1: 0.73, 1.22, 1.71, and 2.45 µT]; the Z-spectrum was acquired with 10 different saturation frequencies at ±1.6, ±1.3, ±1.0, ±0.7, and ±0.4 ppm. Total acquisition time was 24 minutes for one 2D slice of size 128 x 128.
For Multitasking SS-CEST: Pulsed saturation was applied in the CEST experiment (instead of the continuous wave acquisition) to achieve the steady state of the system. Detailed parameters are listed in [3]. Total acquisition time was 36 minutes to acquire 32 slices of size 256x256 at 59 offsets for 4 B1 powers. Eq. [1] was used to fit the exchange rate (k) from the qCEST data acquired at four different B1 powers [Flip Angles of 200,500,900 and 1000]. $$ \frac{1}{CEST_{ind}} \approx \frac{R_{1w}}{DC f_r k_{sw} c_1} + \frac{k_{sw}(R_{2s}+k_{sw})R_{1w}c_2^2}{DC f_r k_{sw}c_1}\frac{1}{\omega_1^2} \; (1)$$ where DC stands for duty cycle; $$$c_1$$$ and $$$c_2$$$ describe the shape of Gaussian saturation pulses (𝑐1=𝜎√2𝜋𝑡𝑝, 𝑐2=⁄𝑐1√√2; 𝜎 and 𝑡𝑝 are the width and length of the Gaussian pulse). here $$$\omega_1$$$ is defined as the average RF irradiation amplitude of one Gaussian pulse, i.e., $$$\omega_1$$$ = flip angle/pulse duration.
Results
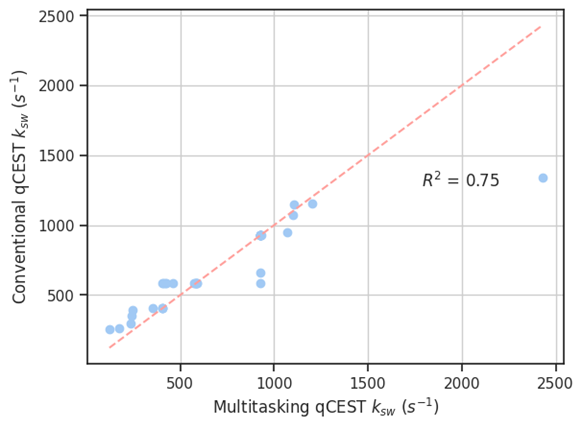
After slice matching for 6 pigs, exchange rate maps were obtained for both the reconstructed Multitasking CEST images and the conventional CEST images. Figure 1 presents the correlation plot across the entire dataset, yielding a correlation coefficient of 0.75. When separating the correlation by injured and healthy disks, coefficients of 0.81 and 0.74 were observed, respectively. Figure 2 shows the exchange rate values for injured and healthy discs from both methods. There are significant differences between the two groups of discs for both methods.Discussion
This study represents the initial step in validating an accelerated qCEST using Multitasking. We demonstrated that the exchange rate maps obtained using Multitasking SS CEST are consistent with those obtained using the conventional qCEST protocol. Scan time for conventional qCEST is 24 minutes/slice while the imaging time for Multitasking SS qCEST is 36 minutes for a 3D slab (32 slices), representing a factor of 22 improvement in imaging efficiency. Correlations are more robust for healthy disks compared to injured ones, attributed to the size of the region of interest (ROI) and partial volume effects from the surrounding tissue. The development of MRI-based pain assessment biomarkers in this model is crucial for advancing our understanding and treatment of lower back pain.Conclusion
Exchange rate maps obtained through 3D steady-state Multitasking CEST are akin to conventional qCEST, paving the way for further scan time reduction by exploiting data redundancy in the frequency offset and B1 dimension using the MR multitasking theory.Acknowledgements
No acknowledgement found.References
[1] Peng B.-G. Pathophysiology, Diagnosis, and Treatment of Discogenic Low Back Pain. World J. Orthop. 2013;4:42–52.
[2] Zhou, Z., Bez, M., Tawackoli, W., Giaconi, J., Sheyn, D., de Mel, S., Maya, M.M., Pressman, B.D., Gazit, Z., Pelled, G., Gazit, D., Li, D. (2016). Quantitative Chemical Exchange Saturation Transfer MRI of Intervertebral Disc in a Porcine Model. Published in "Magnetic Resonance in Medicine," 76(6), 1677–1683.
[3] Han P, Cheema K, Cao T, Lee HL, Han F, Wang N, Han H, Xie Y, Christodoulou AG, Li D. Free-breathing 3D CEST MRI of human liver at 3.0 T. Magn Reson Med. 2023 Feb;89(2):738-745
Figures