4461
Whole-cerebrum guanidino and amide CEST mapping at 3T by 3D EPI GRE and 3D stack-of-spiral GRE acquisitions1Biomedical Engineering, Johns Hopkins University, Baltimore, MD, United States, 2F.M. Kirby Research Center for Functional Brain Imaging, Kennedy Krieger Institute, Baltimore, MD, United States, 3Russell H. Morgan Department of Radiology and Radiological Science, Johns Hopkins University School of Medicine, Baltimore, MD, United States, 4The Sidney Kimmel Comprehensive Cancer Center, Johns Hopkins University, Baltimore, MD, United States
Synopsis
Keywords: CEST / APT / NOE, CEST & MT
Motivation: We are driven by the critical need to efficiently map guanidino and amide CEST in the human brain at 3T, enabling the investigation of brain creatine and protein while adhering to clinical scan time constraints.
Goal(s): Our aim is to validate the efficacy of 3D EPI GRE and 3D stack-of-spiral (3DSOS) GRE techniques for rapid guanidino and amide CEST mapping at 3T.
Approach: We optimized saturation parameters, conducted a comparative analysis of SNR and reproducibility, and demonstrated 3DSOS in a low-grade glioma patient.
Results: Both techniques yielded similar CEST signal intensities, with 3DSOS showing superior reproducibility.
Impact: While 3DEPI and 3DSOS yielded similar signal intensity in whole-cerebrum guanidino and amide CEST mappings at 3T, the latter is recommended for clinical application with its enhanced reproducibility and showed an increase of guanidino CEST in the tumor.
Purpose
CEST MRI is an emerging non-invasive technique for quantifying target proteins and metabolites by leveraging their exchangeable protons1-3. Recent studies have highlighted that the conventional CEST contrast at 3.5ppm by MTRasym, denoted as amide proton transfer (APT) signal2, 4, consists a mixture of amide CEST (amideCEST)2, 4, amideNOE5, 6, and amineCEST. Similarly, the Z-spectrum at 2ppm cotains creatine7-10 and protein arginine CEST6-8,21,23, summarized as guanidino CEST (GuanCEST). Previous studies have demonstrated that amideCEST and GuanCEST can be extracted at 3T using polynomial and Lorentzian function fitting (PLOF)5, 8, 12. However, the limited brain coverage and low signal strength hinder clinical application. Our goal is to enhance time-efficiency by optimizing the saturation scheme and ensuring stable Z-spectrum acquisition. Therefore, we compare the 3D stack-of-spiral (3DSOS) GRE14 with 3D EPI (3DEPI) GRE12, 13, single-slice turbo spin echo (TSE) and 3D gradient- and spin-echo (GRASE)11 methods. This comparative analysis, relatively unexplored in the CEST field, offers insights into the strengths and limitations of each approach.Methods
Twenty-two healthy volunteers (age: 39.9±15.9 years, 10 females) underwent scans on a 3T Philips Ingenia scanner (Philips Healthcare, Best, The Netherlands). One 28-year-old male undergoing treatment for low-grade glioma was scanned on another Philips 3T scanner with the same parameters. The saturation time (1, 2, 3, 4s) was optimized with a fixed pre-saturation delay of 3s, followed by optimizing the pre-saturation delay (3, 1.4s) with the selected saturation time, all utilizing 3DEPI. Other scanning parameters included: FOV=220×220×125mm3, resolution=3.5×3.5×5.0mm3, 25 slices, matrix size=64×64, TE/TR =5.2/11ms. The GuanCEST and amideCEST were obtained via PLOF with a frequency list of 69 offsets11. Time efficiency (η) was evaluated for optimized saturation time, calculated as CEST divided by the square root of time per offset. TSE was also scanned for reference. 3DSOS14 featured a single-shot spiral-out readout, while GRASE covered the middle 13 slices within similar timeframe11, sharing the same 3DEPI geometry. Temporal signal-to-noise ratio (tSNR) was compared for 3DSOS, 3DEPI and GRASE with B1 off, calculated as the mean of 20 repetitions divided by their standard deviation. 3DSOS was compared with 3DEPI for whole-cerebrum GuanCEST and amideCEST in terms of signal intensity and reproducibility. Reproducibility was assessed using Pearson’s correlation coefficient (r), intraclass coefficient of correlation (ICC)15, 16 and within-subject coefficient of variance (wsCV)17 between the measurements before (1st) and after (2nd) a water break. An ICC between 0.4 and 0.75 was considered as “good”, and above 0.75 as “excellent”18, 19. T1 weighted magnetization prepared rapid gradient echo (MPRAGE) images were acquired for brain segmentation20, and Riccian noise removal and motion correction were applied21. T1 maps for PLOF analysis were obtained by the dual flip angle (DFA) method22, 23.Results and Discussion
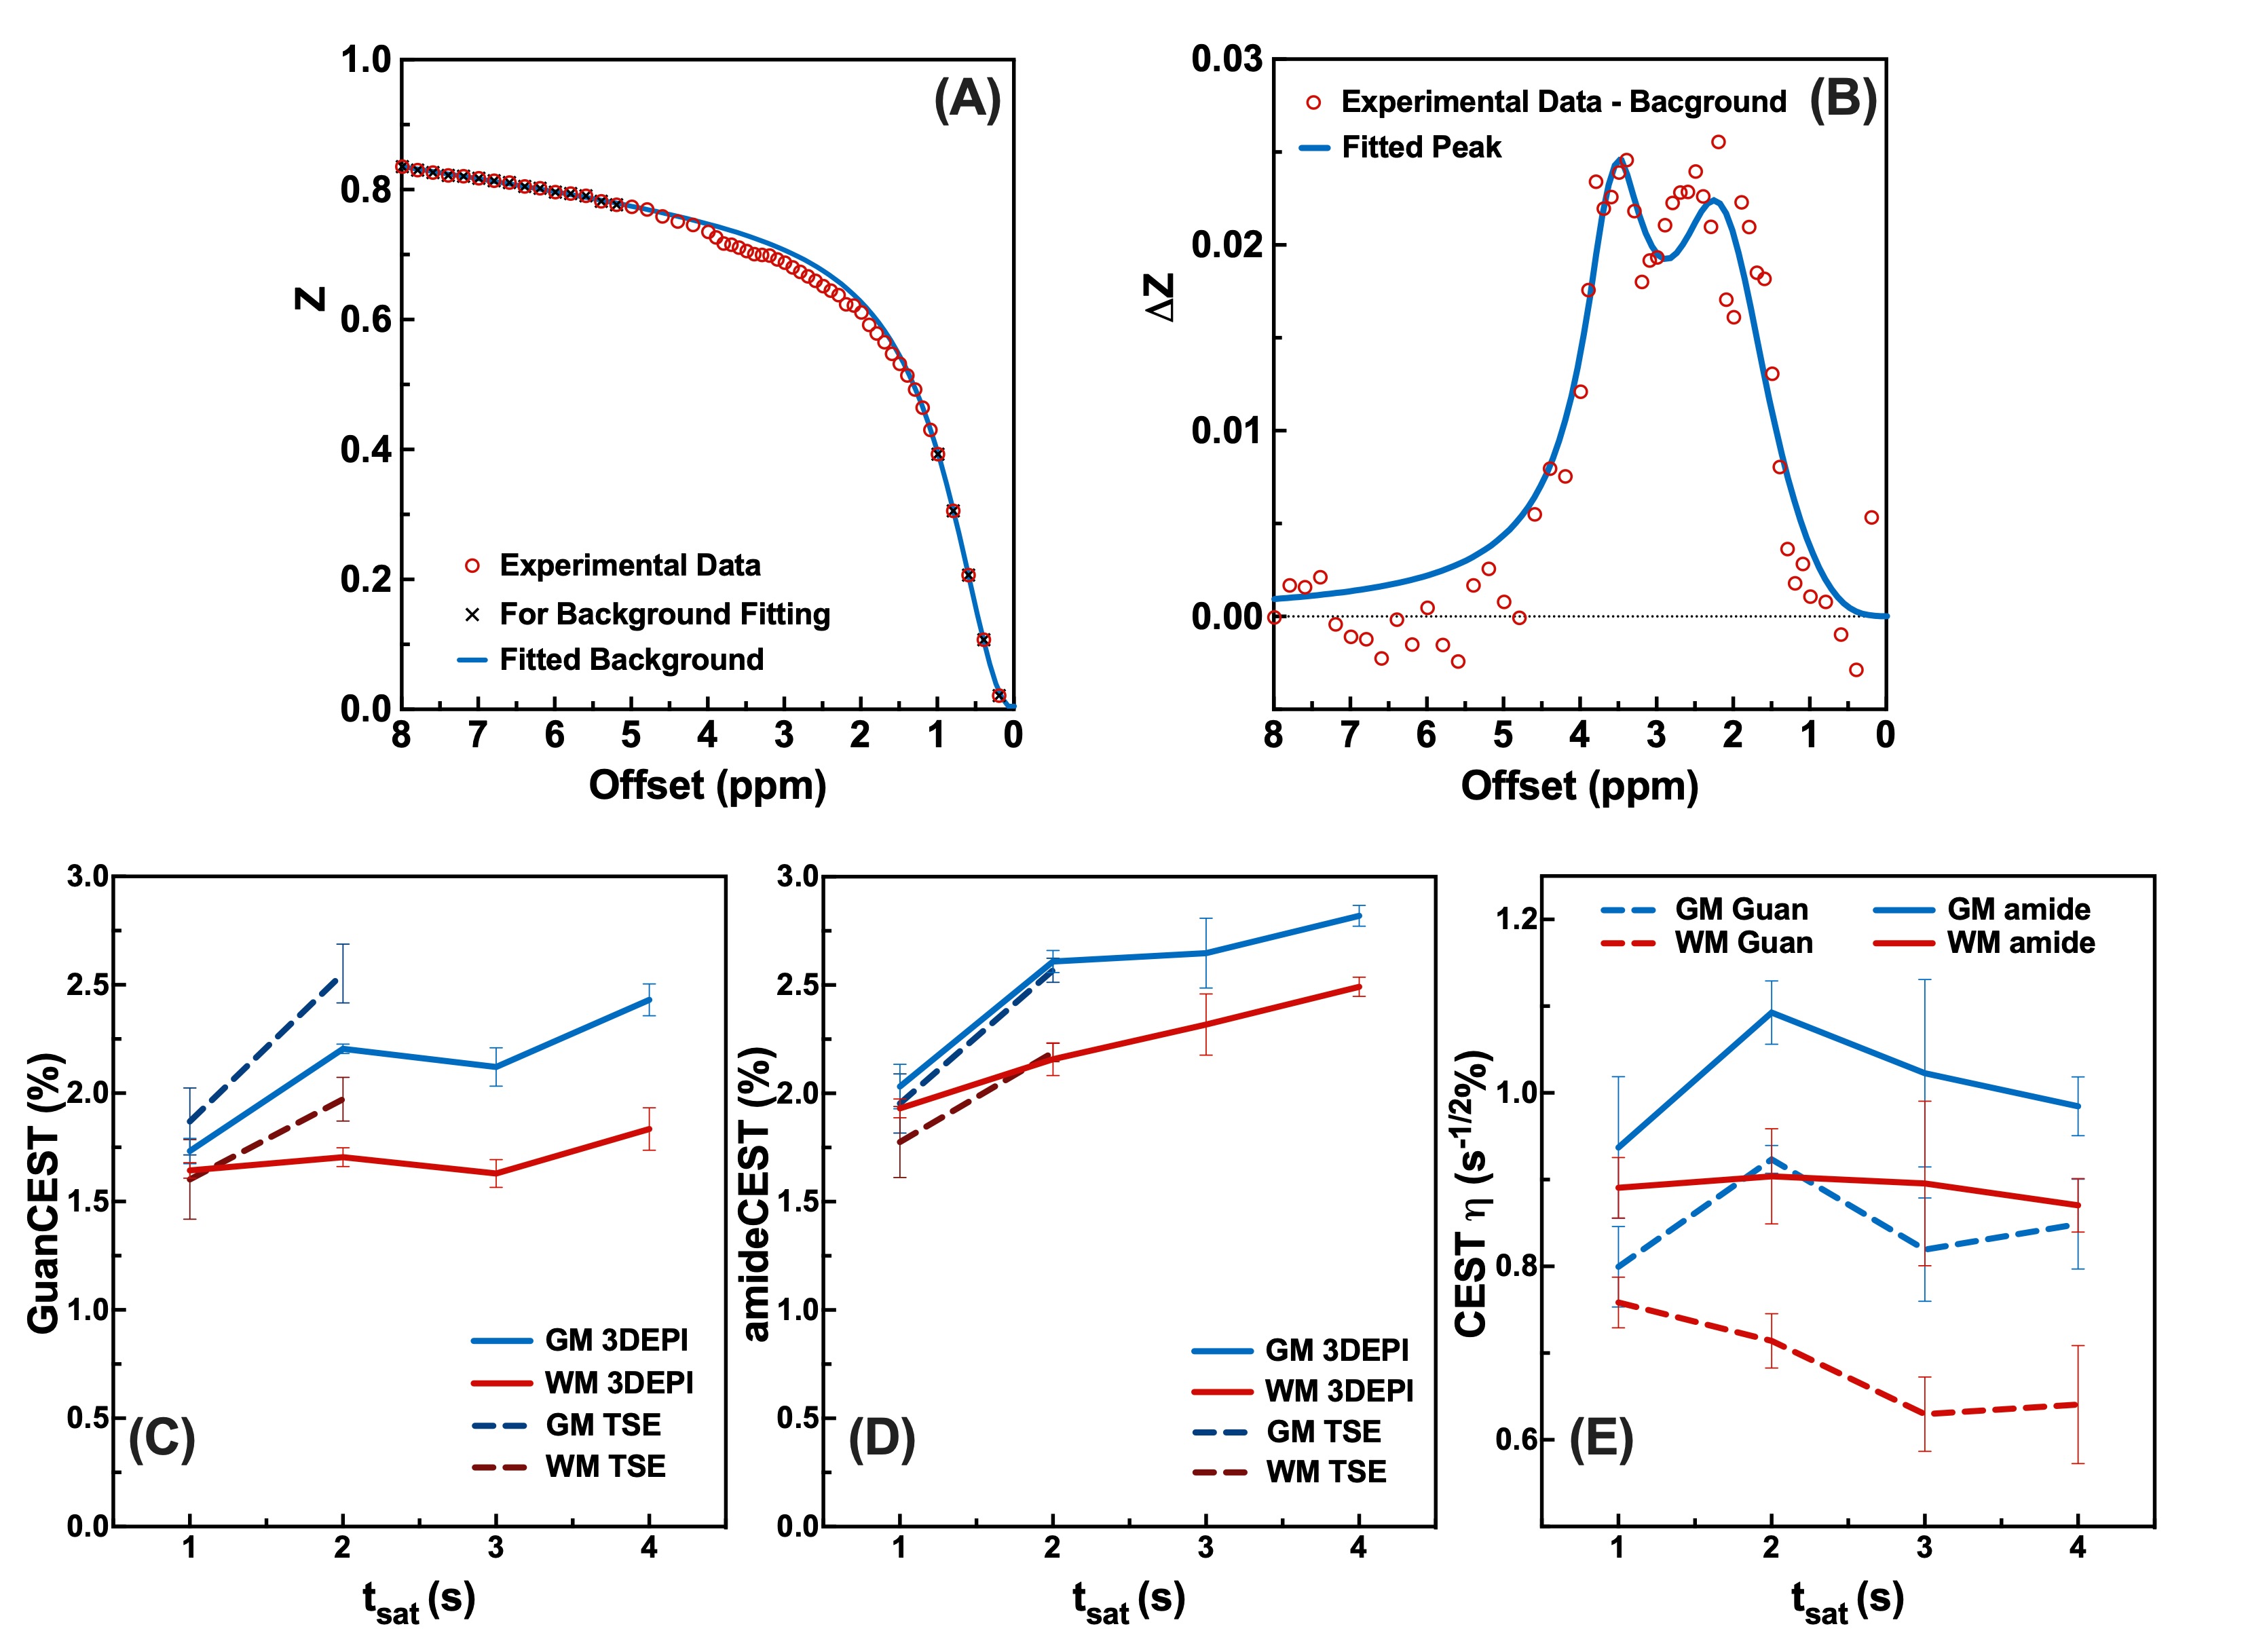
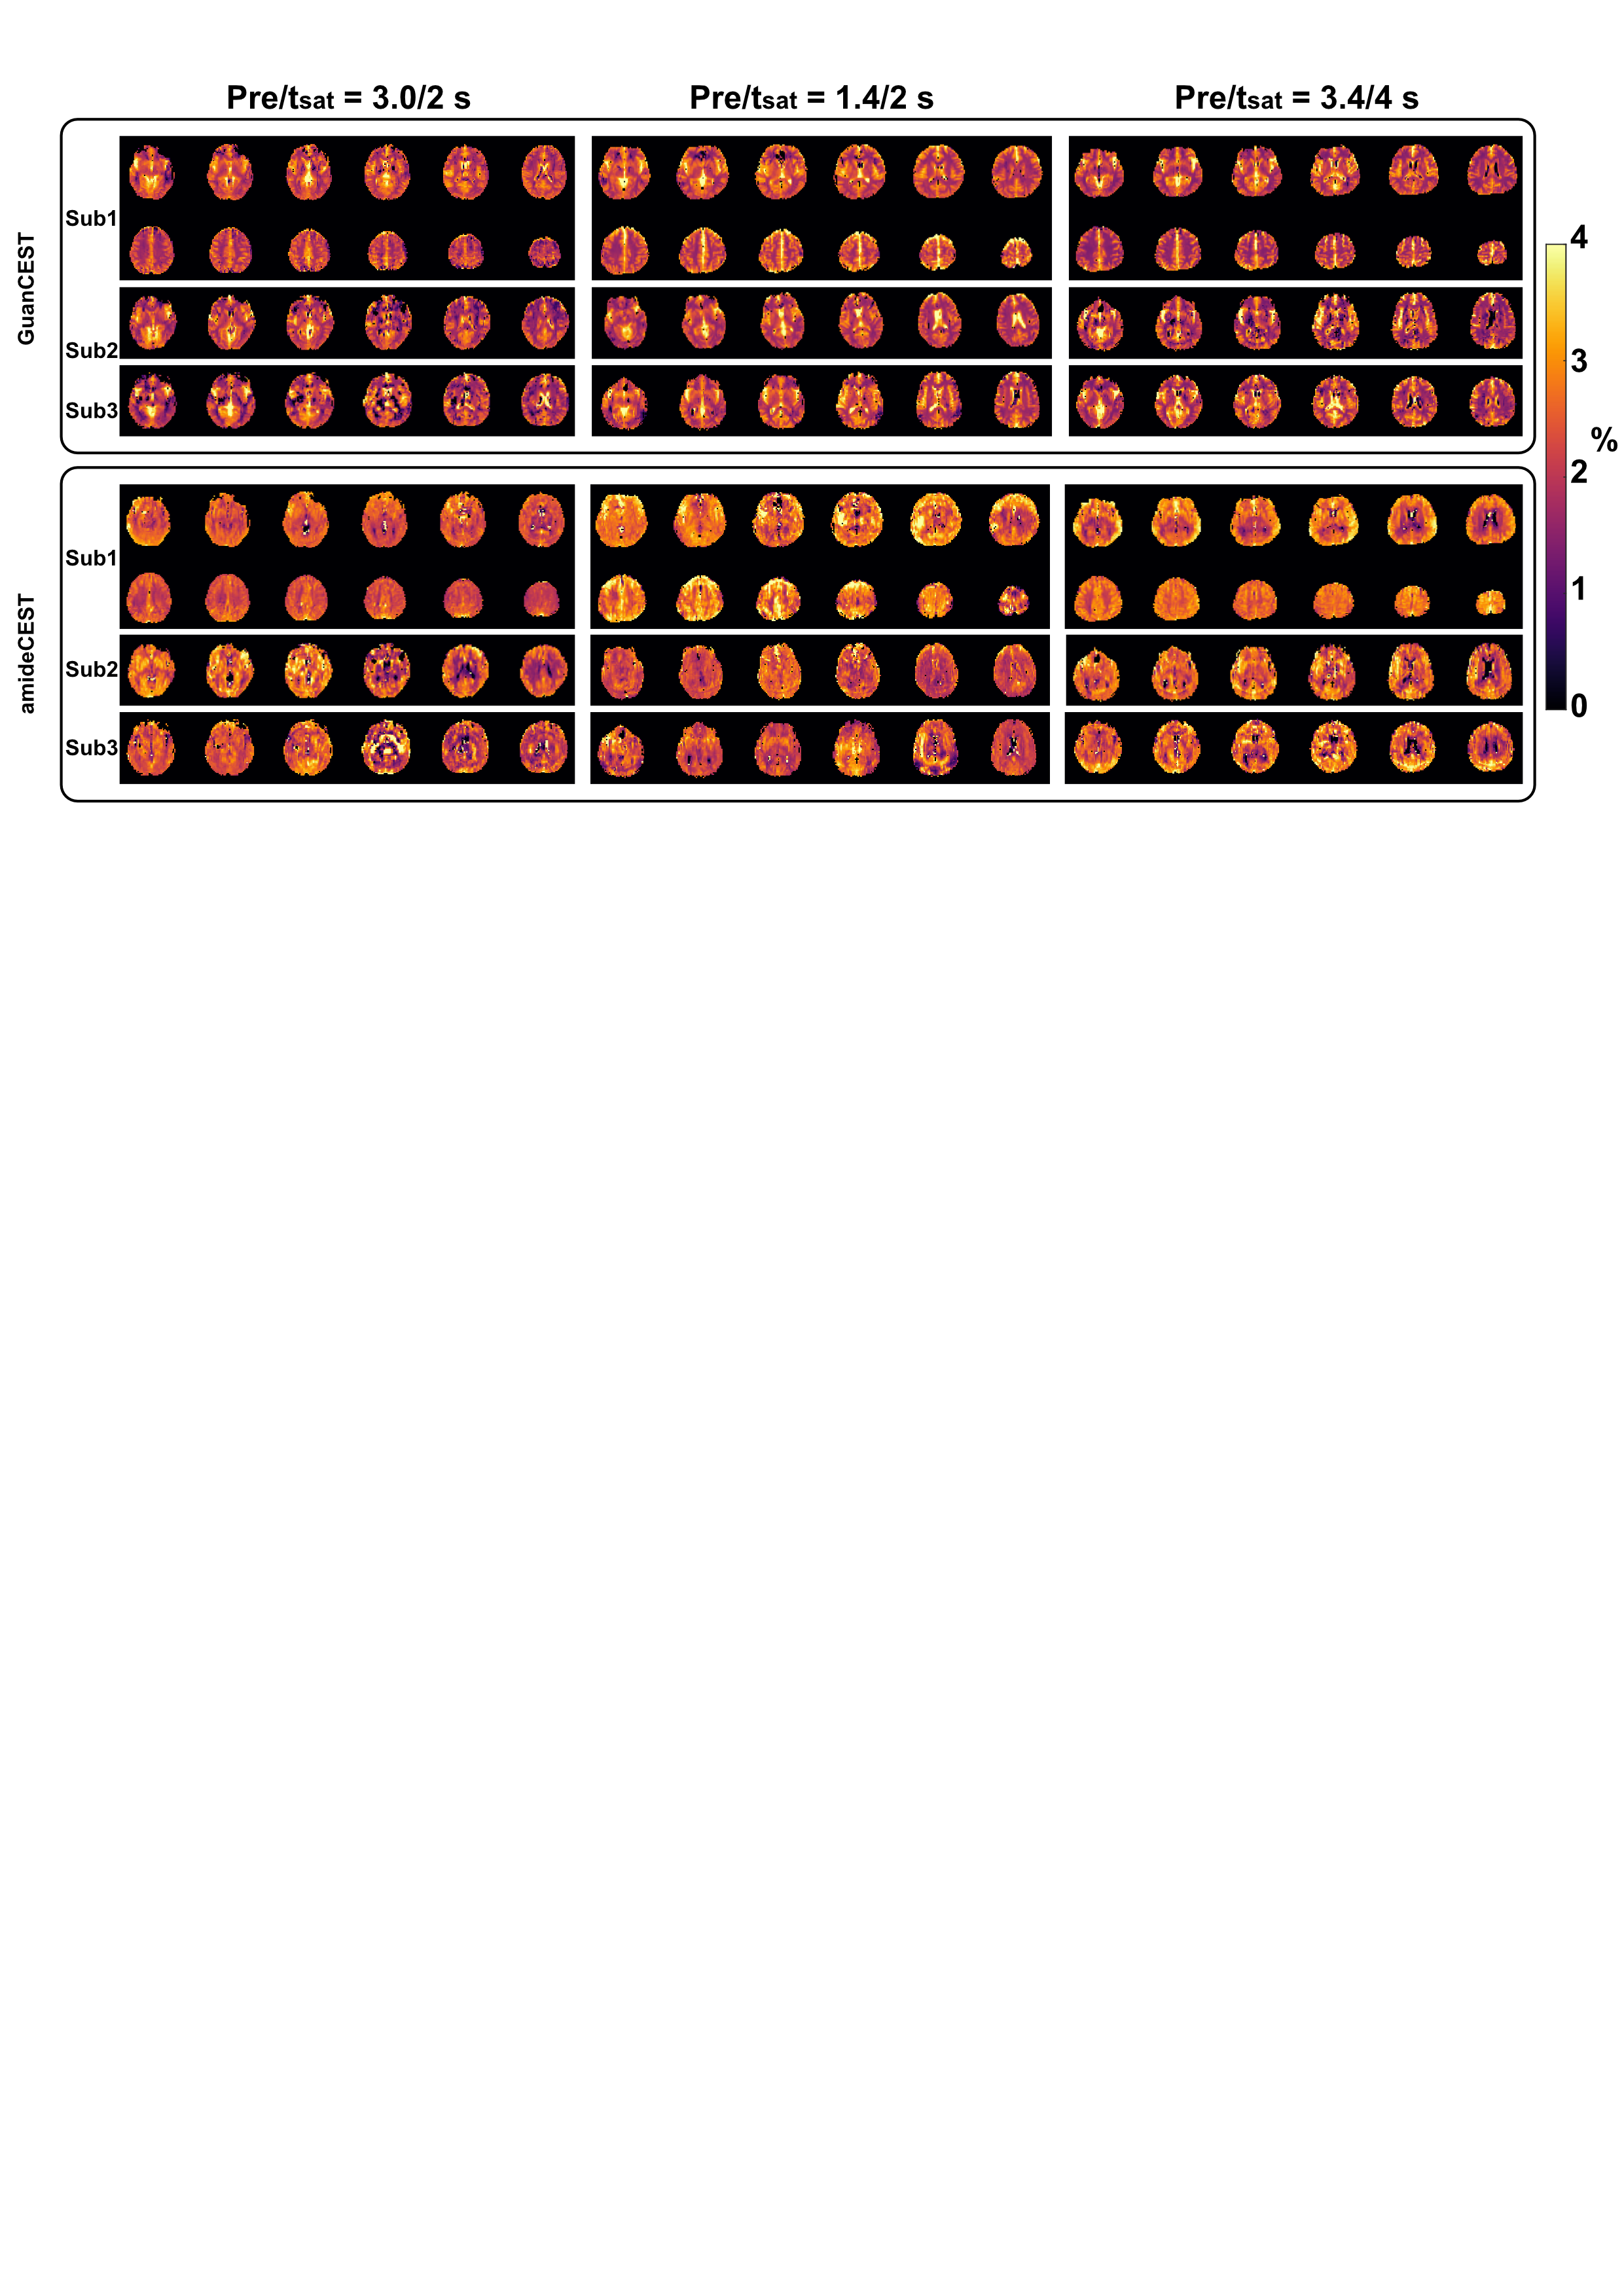
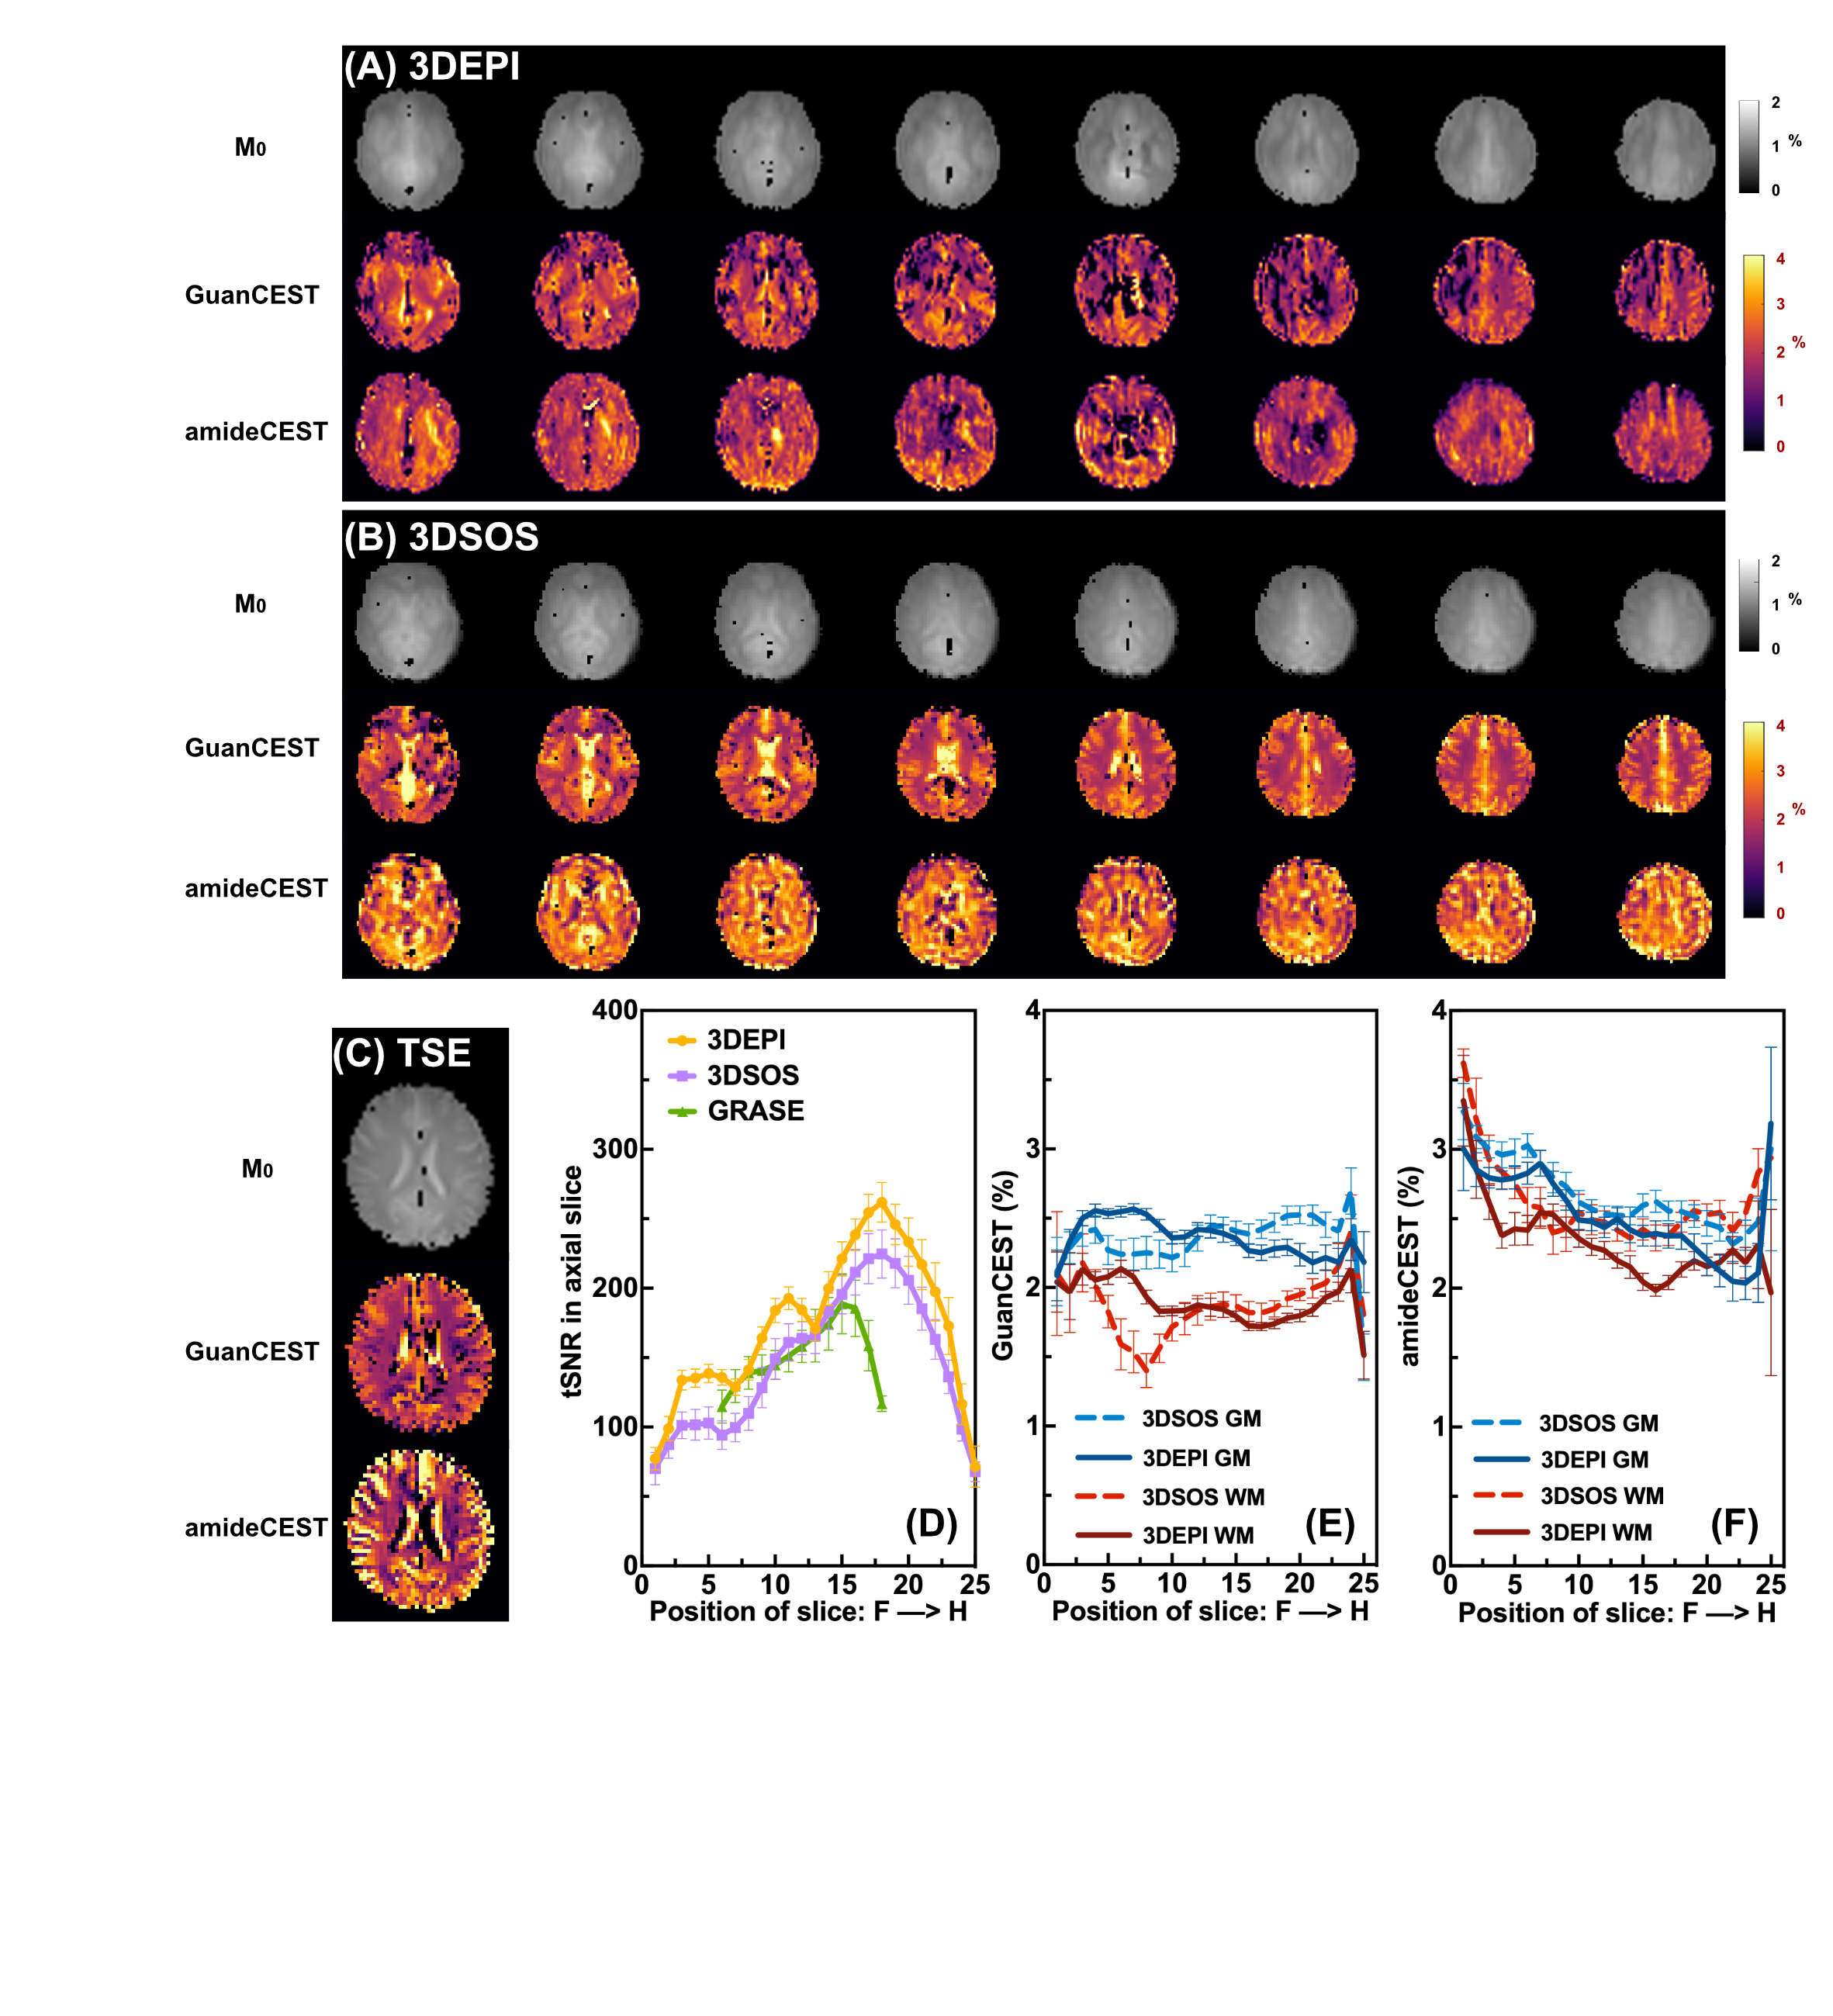
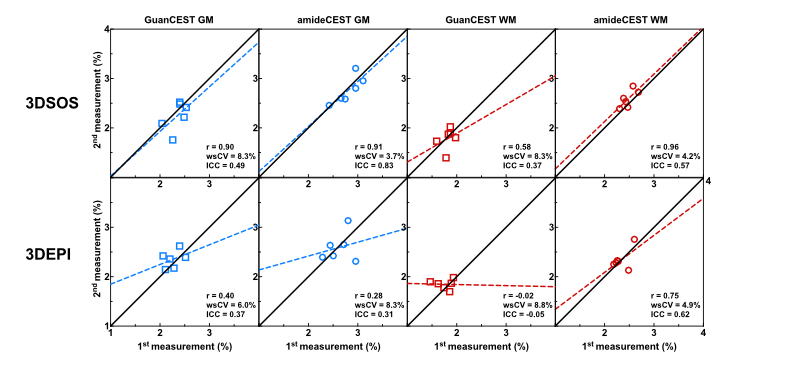
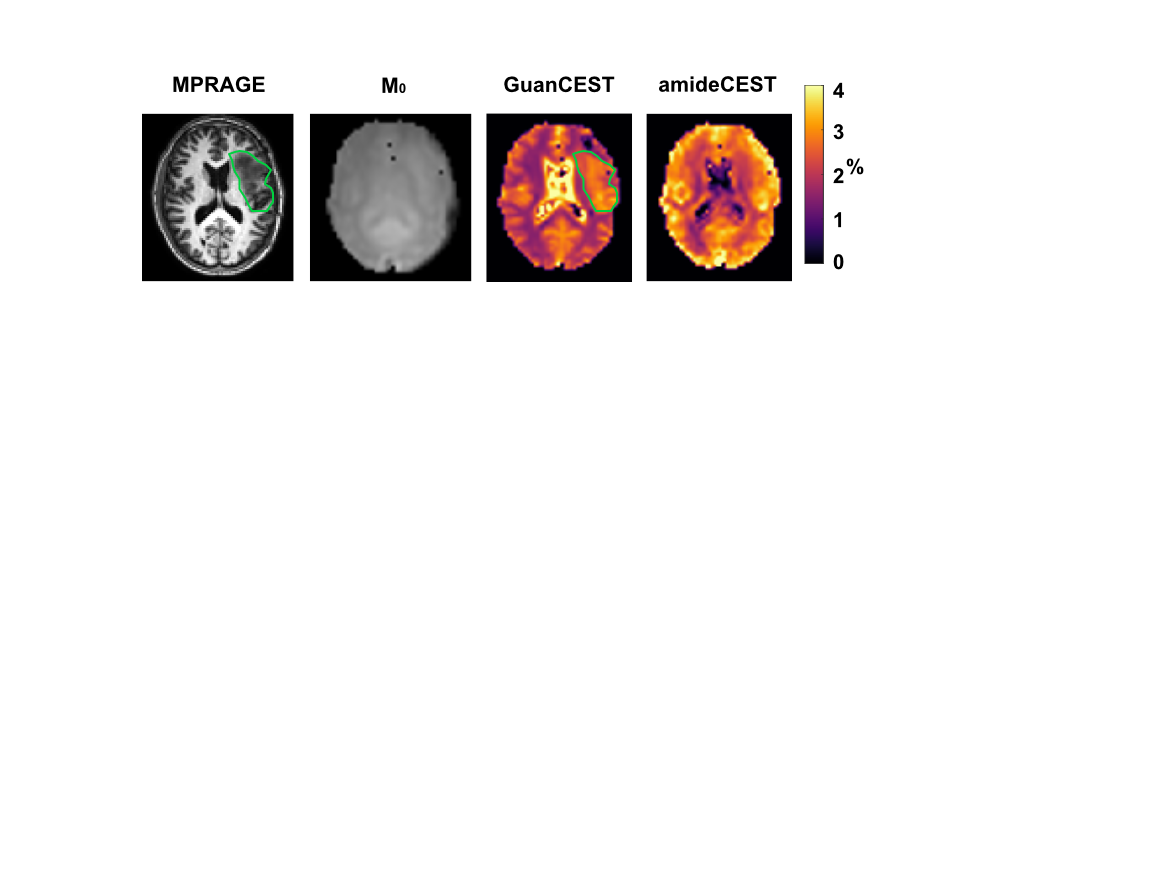
The normalized and denoised Z/ΔZ-spectrum is plotted in Fig. 1A/B, demonstrating how PLOF extracts GuanCEST at 2 ppm and amideCEST at 3.5 ppm simultaneously. Both CEST contrasts increase as the saturation time increases (Fig. 1C&D), but the time efficiency peaks at around 2s (Fig. 1E), thus the optimized. The signal intensity of the pre-saturation delay of 1.4s is higher than that of 3s, also with a stronger contrast between GM and WM, while a saturation time of 4s with the shortest pre-saturation delay (3.4s) shows no significant enhancement in CEST contrasts (Fig. 2). A restless subject shows 3DEPI (Fig. 3A) is vulnerable to motion, while 3DSOS (Fig. 3B) is more robust with higher signal intensity, and TSE (Fig. 3C) also shows strong contrast but only for a single slice. 3DEPI exhibits larger tSNR (Fig. 3D) but similar GuanCEST (Fig. 3E) and smaller amideCEST (Fig. 3F) than that of 3DSOS. Limited slice coverage of GRASE/TSE precludes itself from further test-retest comparison. 3DSOS exceeded 3DEPI with smaller wsCV and larger ICC in both GM and WM for GuanCEST (Fig. 4), demonstrating higher reproducibility for the potential clinical transition. The GuanCEST map from 3DSOS shows stronger signal in the same region as the tumor in the MPRAGE image (Fig. 5), while M0 and amideCEST show no sign. The increase of GuanCEST may be explained by the change of pH and creatine metabolism in the tumor.Conclusion
We achieved the whole-cerebrum GuanCEST and amideCEST mappings in the human brain at 3T, and the side-by-side comparison of 3DSOS and 3DEPI in CEST for the first time. 3DSOS with optimized saturation and pre-saturation delay time of 2/1.4s is recommended for clinical use due to higher tSNR efficiency and reproducibility.Acknowledgements
We thank Mr. Joseph S. Gillen, Mrs. Terri Lee, Brawner, Ms. Kathleen A. Kahl, and Ms. Ivana Kusevic for experimental assistance. The National Institutes of Health supported this project through grants from the P41EB031771, R01HL149742, R01AG080104, R01HL63030, and R21AG074978.References
1. Ward KM, Aletras AH, Balaban RS. A New Class of Contrast Agents for MRI Based on Proton Chemical Exchange Dependent Saturation Transfer (CEST). J. Magn. Reson. 2000; 143(1):79-87.
2. Zhou J, Payen JF, Wilson DA, et al. Using the amide proton signals of intracellular proteins and peptides to detect pH effects in MRI. Nat. Med. 2003; 9(8):1085-90.
3. van Zijl PCM, Yadav NN. Chemical exchange saturation transfer (CEST): What is in a name and what isn't? Magn. Reson. Med. 2011; 65(4):927-48.
4. Zhou J, Lal B, Wilson DA, et al. Amide proton transfer (APT) contrast for imaging of brain tumors. Magn. Reson. Med. 2003; 50(6):1120-6.
5. Sui R, Chen L, Li Y, et al. Whole-brain amide CEST imaging at 3T with a steady-state radial MRI acquisition. Magn. Reson. Med. 2021; 86(2):893-906.
6. Jin T, Kim SG. Role of chemical exchange on the relayed nuclear Overhauser enhancement signal in saturation transfer MRI. Magn Reson Med. 2021; 87(1):365-76.
7. Chung JJ, Jin T, Lee JH, Kim SG. Chemical exchange saturation transfer imaging of phosphocreatine in the muscle. Magn Reson Med. 2019; 81(6):3476-87.
8. Chen L, Zeng H, Xu X, et al. Investigation of the contribution of total creatine to the CEST Z-spectrum of brain using a knockout mouse model. NMR Biomed. 2017; 30(12):e3834.
9. Zhang Z, Wang K, Park S, et al. The exchange rate of creatine CEST in mouse brain. Magn Reson Med. 2023; 90(2): 373-384.
10. Cai K, Singh A, Poptani H, et al. CEST signal at 2ppm (CEST@2ppm) from Z-spectral fitting correlates with creatine distribution in brain tumor. NMR Biomed. 2015; 28(1):1-8.
11. Wang K, Park S, Kamson DO, et al. Guanidinium and amide CEST mapping of human brain by high spectral resolution CEST at 3T. Magn Reson Med. 2023; 89(1):177-91.
12. Akbey S, Ehses P, Stirnberg R, et al. Whole-brain snapshot CEST imaging at 7 T using 3D-EPI. Magn Reson Med. 2019; 82(5):1741-52.
13. Mueller S, Stirnberg R, Akbey S, et al. Whole brain snapshot CEST at 3T using 3D-EPI: Aiming for speed, volume, and homogeneity. Magn Reson Med. 2020; 84(5):2469-83.
14. Zhu D, Xu F, Liu D, et al. Evaluation of 3D stack‐of‐spiral turbo FLASH acquisitions for pseudo‐continuous and velocity‐selective ASL–derived brain perfusion mapping. Magnetic resonance in medicine. 2023; 90(3):939-949.
15. McGraw KO, Wong SP. Forming inferences about some intraclass correlation coefficients. Psychological methods. 1996; 1(1):30.
16. Shrout PE, Fleiss JL. Intraclass correlations: uses in assessing rater reliability. Psychological bulletin. 1979; 86(2):420.
17. Bland JM, Altman DG. Statistics Notes: Measurement error proportional to the mean. BMJ. 1996; 313(7049):106.
18. Matheson GJ. We need to talk about reliability: making better use of test-retest studies for study design and interpretation. PeerJ. 2019; 7:e6918.
19. Fleiss JL. Design and analysis of clinical experiments: John Wiley & Sons; 2011.
20. Xu F, Liu D, Zhu D, et al. Test-retest reliability of 3D velocity-selective arterial spin labeling for detecting normal variations of cerebral blood flow. Neuroimage. 2023; 271:120039.
21. Wang K, Huang J, Ju L, et al. Creatine mapping of the brain at 3T by CEST MRI. Magnetic Resonance in Medicine. 2023; 1-10
22. Deoni SC, Rutt BK, Peters TM. Rapid combined T1 and T2 mapping using gradient recalled acquisition in the steady state. Magn Reson Med. 2003; 49(3):515-26.
23. Helms G, Dathe H, Dechent P. Quantitative FLASH MRI at 3T using a rational approximation of the Ernst equation. Magn Reson Med. 2008; 59(3):667-72.
Figures