4459
Comparison between a new quantitative APT parameter APT_T1 by solving Bloch equation of multiple pool model and MTR_Rex1GE HealthCare, Hino, Japan, 2Jisenkai Brain Imaging Research Center, Nagano, Japan
Synopsis
Keywords: CEST / APT / NOE, CEST & MT, NOE
Motivation: Quantitative parameter is required for APT.
Goal(s): Comparing a new quantitative APT parameter APT_T1 (the ratio of APT transfer rate to longitudinal relaxation rate) with MTR_Rex
Approach: APT_T1 was calculated by solving the Bloch equation of multiple pool model. APT_T1 was compared with MTR_Rex in numerical simulation and a clinical case.
Results: MTR_asym was influenced by rNOE and differed from MTR_Rex. On the other hand, although calculation methods of APT_T1 and MTR_Rex were different, APT_T1 approximated MTR_Rex under the condition with strong CEST RF. APT_T1 and MTR_Rex can be used as complementary quantitative APT parameters.
Impact: A new quantitative APT parameter APT_T1 was calculated by solving Bloch equation of multiple pool model. APT_T1 approximated MTR_Rex under the condition with strong and long CEST RF with 100% duty cycle.
INTRODUCTION
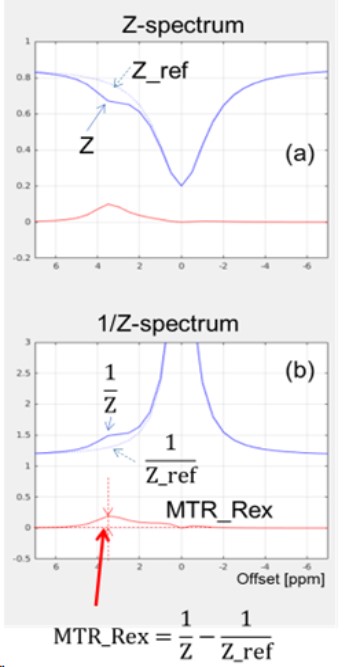
For Chemical Exchange Saturation Transfer (CEST), Magnetization Transfer Ratio (MTR) asymmetry (MTR_asym) at +/-3.5ppm is often used to visualize Amide Proton Transfer (APT). However, relayed Nuclear Overhauser Effect (rNOE) signal at -3.5ppm influences MTR_asym. MTR_asym value changes based on CEST RF B1 amplitude. Therefor it is not a quantitative APT parameter. One of the quantitative APT parameters is MTR EXchange-dependent Relaxation (MTR_Rex) [1]. MTR_Rex is the difference between the inverse of measured Z and the inverse of Z_ref. But Z_ref needs to be calculated by Z-spectrum fitting.In this study, a new quantitative APT parameter APT_T1 was calculated by solving the Bloch equation of multiple pool model of CEST in the steady state. APT_T1 is the product of f, k and T1, where f is concentration fraction of APT pool, k is the transfer rate from APT pool to free water pool, and T1 is the longitudinal relaxation time of free water pool. The product of f and k is the transfer rate from free water pool to APT pool. The 1/T1 is T1 relaxation rate. Therefore, APT_T1 is the ratio of APT transfer rate to T1 relaxation rate, and the meaning of APT_T1 is simple and clear. On the other hand, the meaning of MTR_Rex is complex. However, by solving the equations in [1] under the condition with strong and long CEST RF with 100% duty cycle, APT_T1 approximates MTR_Rex. In this study, APT_T1 was compared with MTR_Rex by numerical simulation and one clinical case.
METHODS
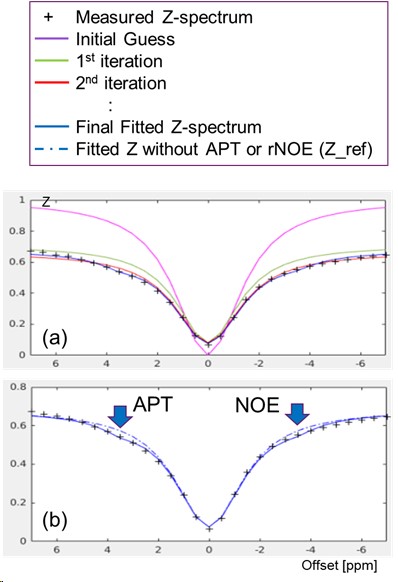
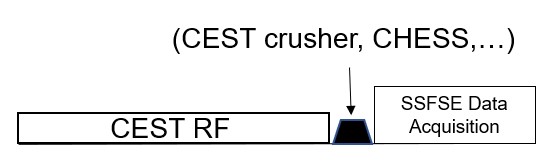
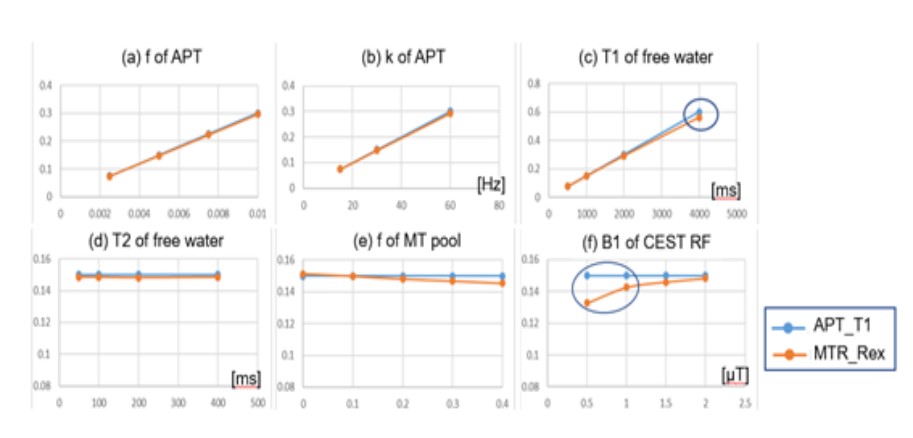
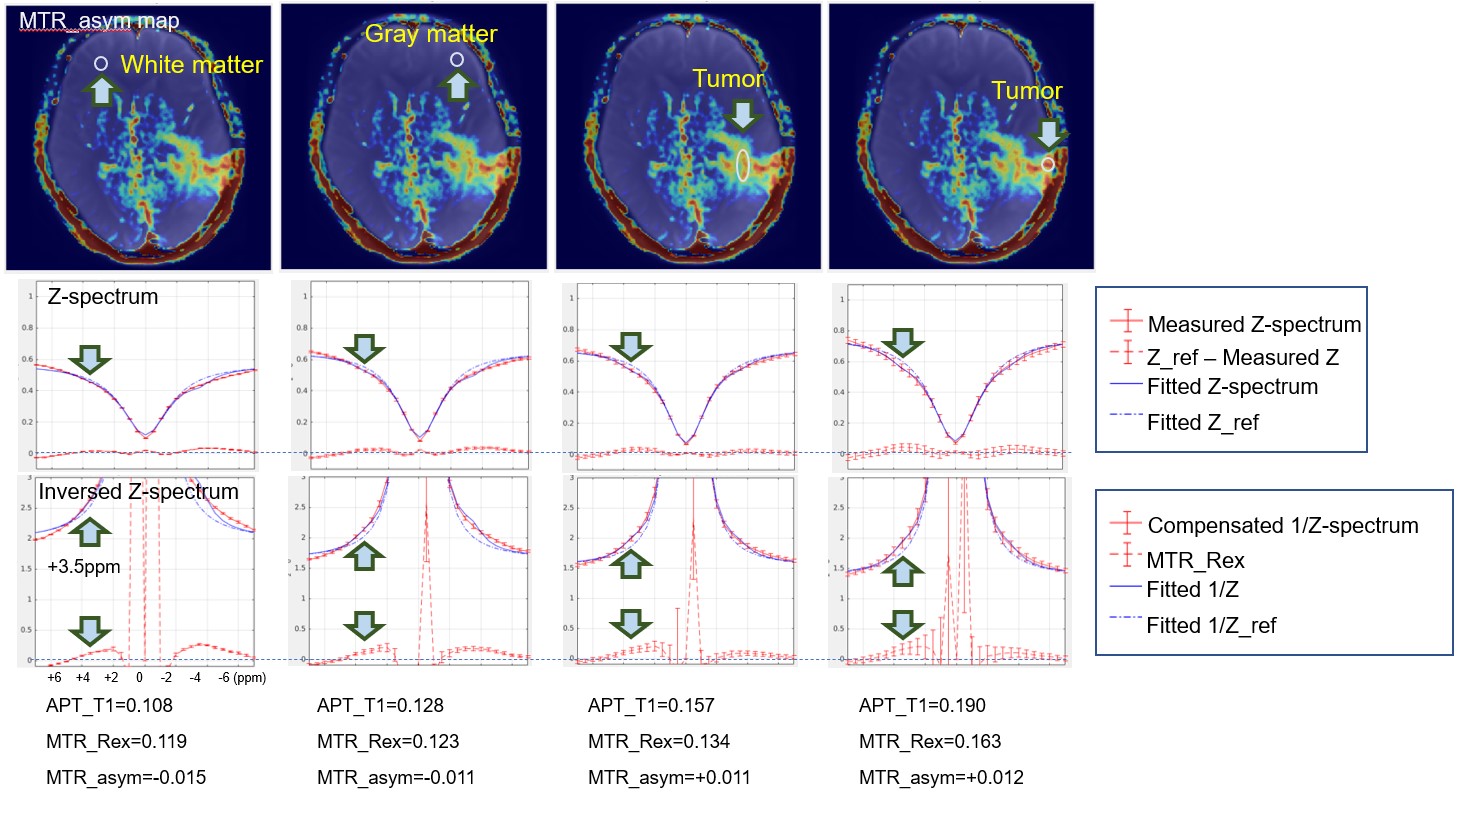
APT_T1 was calculated by solving four pool (free water pool, binding water MT pool, APT pool and rNOE pool) model Bloch equation. The f of each pool and T2 of free water pool were solved by successive approximation of non-linear least square method (Fig 1). The unknown parameters were included in Bloch equation, and literature values [2] were used for them. APT_T1 was calculated by multiplying f, k and T1. Z_ref was calculated by reusing the fitted parameters of free water and MT pool. Then MTR_Rex was calculated (Fig 2). The grand truth of CEST parameter is unknown in clinical cases. Therefore, stability of APT_T1 and MTR_Rex was simulated numerically. The common parameters were as follows; f of APT = 0.005, k of APT = 30[Hz], T1 of free water pool = 1000[ms], T2 of free water pool = 200ms, f of MT pool = 0.2, CEST RF B1 = 2μT, APT_T1 = MTR_Rex = 0.15. Then the common parameters were fixed except for one modified parameter, and the sensitivity of APT_T1 and MTR_Rex to that modified parameter was calculated. Z-spectrum of one patient subject was acquired under IRB approval. B0 field was 3T (GE SIGNA Pioneer). Pulse sequence is in Fig 3. CEST RF was the continuous wave with B1=2μT, duration=2sec and duty cycle=100%. Between CEST RF and data acquisition, there was a waiting time of CHESS pulse. APT_T1 and MTR_Rex were calculated by compensating the T1 recovery of this waiting time for clinical cases. The APT_T1, MTR_Rex and MTR_asym were calculated at white matter, gray matter, and tumor.RESULTS
Stability of APT_T1 and MTR_Rex by numerical simulation is in Fig 4. Both APT_T1 and MTR_Rex were proportional to f of APT, k of APT and T1 of free water. They were insensitive to T2 of free water and f of MT. They were within 5% difference for strong B1 (2.0 and 1.5μT), but difference became large for weak B1 (1.0 and 0.5μT). Brain tumor patient results are in Fig 5. APT_T1 approximated MTR_Rex within 15% difference. But MTR_asym differed from MTR_Rex.DISCUSSION
MTR_asym was influenced by rNOE in the clinical case, and it differed from MTR_Rex. On the other hand, APT_T1 and MTR_Rex were similar in both simulation and a clinical results except for weak B1 cases, although calculation methods of them were different. This is because APT_T1 approximates MTR_Rex under strong B1 condition. MTR_Rex was used as a quantitative APT parameter, but there was no other standard method to be compared with it. This study shows that APT_T1 and MTR_Rex can be used complementary. Although this study required strong and long CEST RF with 100% duty cycle, it was achievable for clinical 3T scanner.CONCLUSION
This study shows that APT_T1 and MTR_Rex can be used as complementary quantitative APT parameters under the condition with strong and long CEST RF with 100% duty cycle.Acknowledgements
No acknowledgement found.References
[1] Moritz Zaiss, et al., Inverse Z-spectrum analysis for spillover-, MT-, and T1-corrected steady-state pulsed CEST-MRI - application to pH-weighted MRI of acute stroke, NMR Biomed. 2014 March; 27(3): 240-252. doi:10.1002/nbm.3054 [2]
[2] Moritz Zaiss, et al., Chemical exchange saturation transfer (CEST) and MR Z-spectroscopy in vivo: a review of theoretical approaches and methods, Phys. Med. Biol. 58 (2013) R221–R269 doi:10.1088/0031-9155/58/22/R221
Figures