4458
A reassessment of quasi-steady-state enhanced T1 normalization in quantitative CEST analysis1Emory University, Atlanta, GA, United States
Synopsis
Keywords: CEST / APT / NOE, Tumor
Motivation: Correction of T1 contribution in quantitative CEST MRI often assumes an equilibrium CEST signal. However, most CEST scans were not and will unlikely to be performed under equilibrium conditions.
Goal(s): To investigate T1 correction and improve CEST quantification using CEST scans under practical scan (non-equilibrium) protocols.
Approach: We performed numerical simulation and in vivo experiments to evaluate T1 correction without and with quasi-steady-state analysis.
Results: Our study demonstrated that QUASS postprocessing enhances the accuracy of T1 correction with the AREX metric independent of the RF saturation time, relaxation delay, and T1.
Impact: Our study provides a practical qCEST solution that lays the foundation for future clinical translation to improve the quantification and specificity of CEST imaging.
INTRODUCTION
APTw MRI exhibits increased signal with glioma grades, even in non-enhancing brain tumors (1-3). Despite these promising results, the recent consensus white paper highlighted some challenges (4). There has been an increasing interest in transforming CESTw MRI towards more specific measurements of the underlying CEST system (5). However, most CEST scans have not been performed under the equilibrium condition (6). Recently, quasi-steady-state (QUASS) CEST reconstruction has been developed to reconstruct the desired equilibrium CEST results in postprocessing (7). Hence, the feasibility and accuracy of T1 normalization in CEST imaging should be revisited with the new QUASS analysis.Methods
We conducted a Bloch-McConnell numerical simulation in MATLAB. The bulk water T1 was varied from 1 to 2 s with intervals of 0.1 s with a representative T2 of 50 ms, and 1 s and 15 ms for the amide protons, respectively. We varied the amide fraction concentration from 0.1:1000 to 2:1000 in 16 steps at an exchange rate of 50 s-1. A CW RF saturation time and relaxation delay were concurrently varied from 1, 2, 4, and 10 s for B1 of 0.5, 0.75, 1, 1.5, and 2 μT at 4.7T. In vivo scans were conducted according to the local IACUC approval on D74-rat glioma rat models. We obtained a Z-spectrum between ±6 ppm with intervals of 0.25 ppm (B1= 0.75 µT) using a multi-slice single-shot CEST EPI (8). In addition, T1-weighted, T2-weighted, and diffusion-weighted images were obtained.RESULTS/DISCUSSION
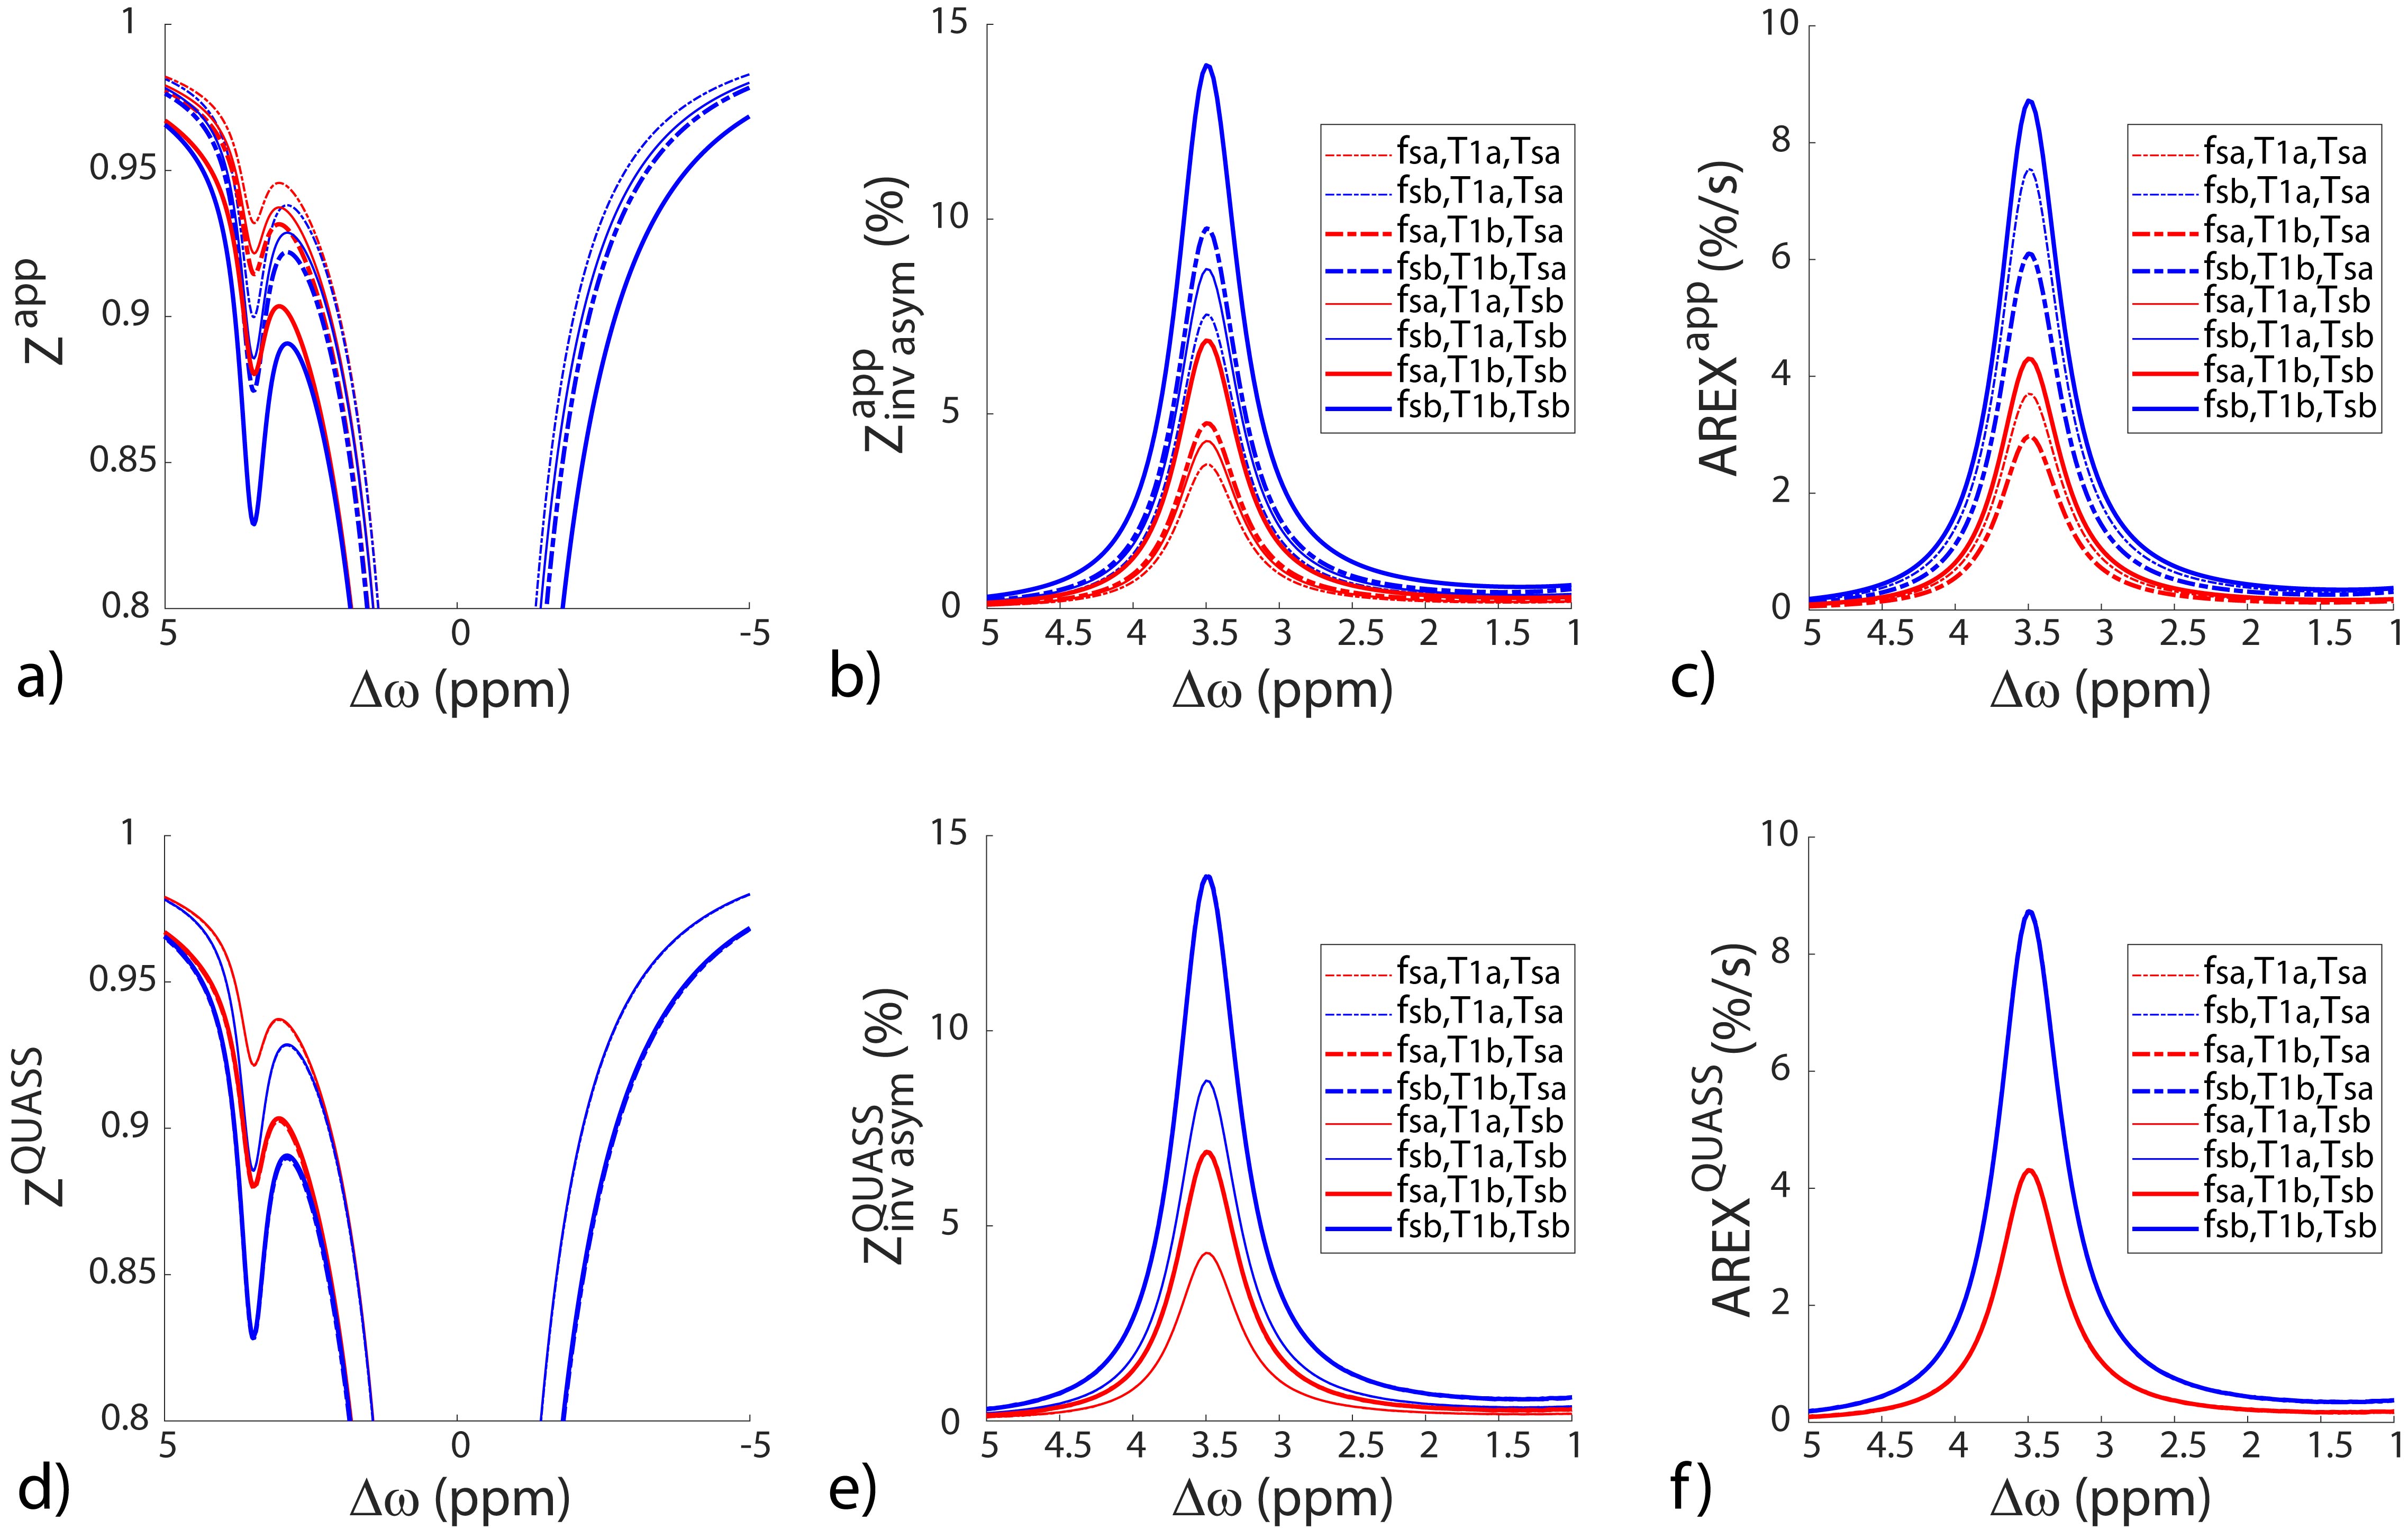
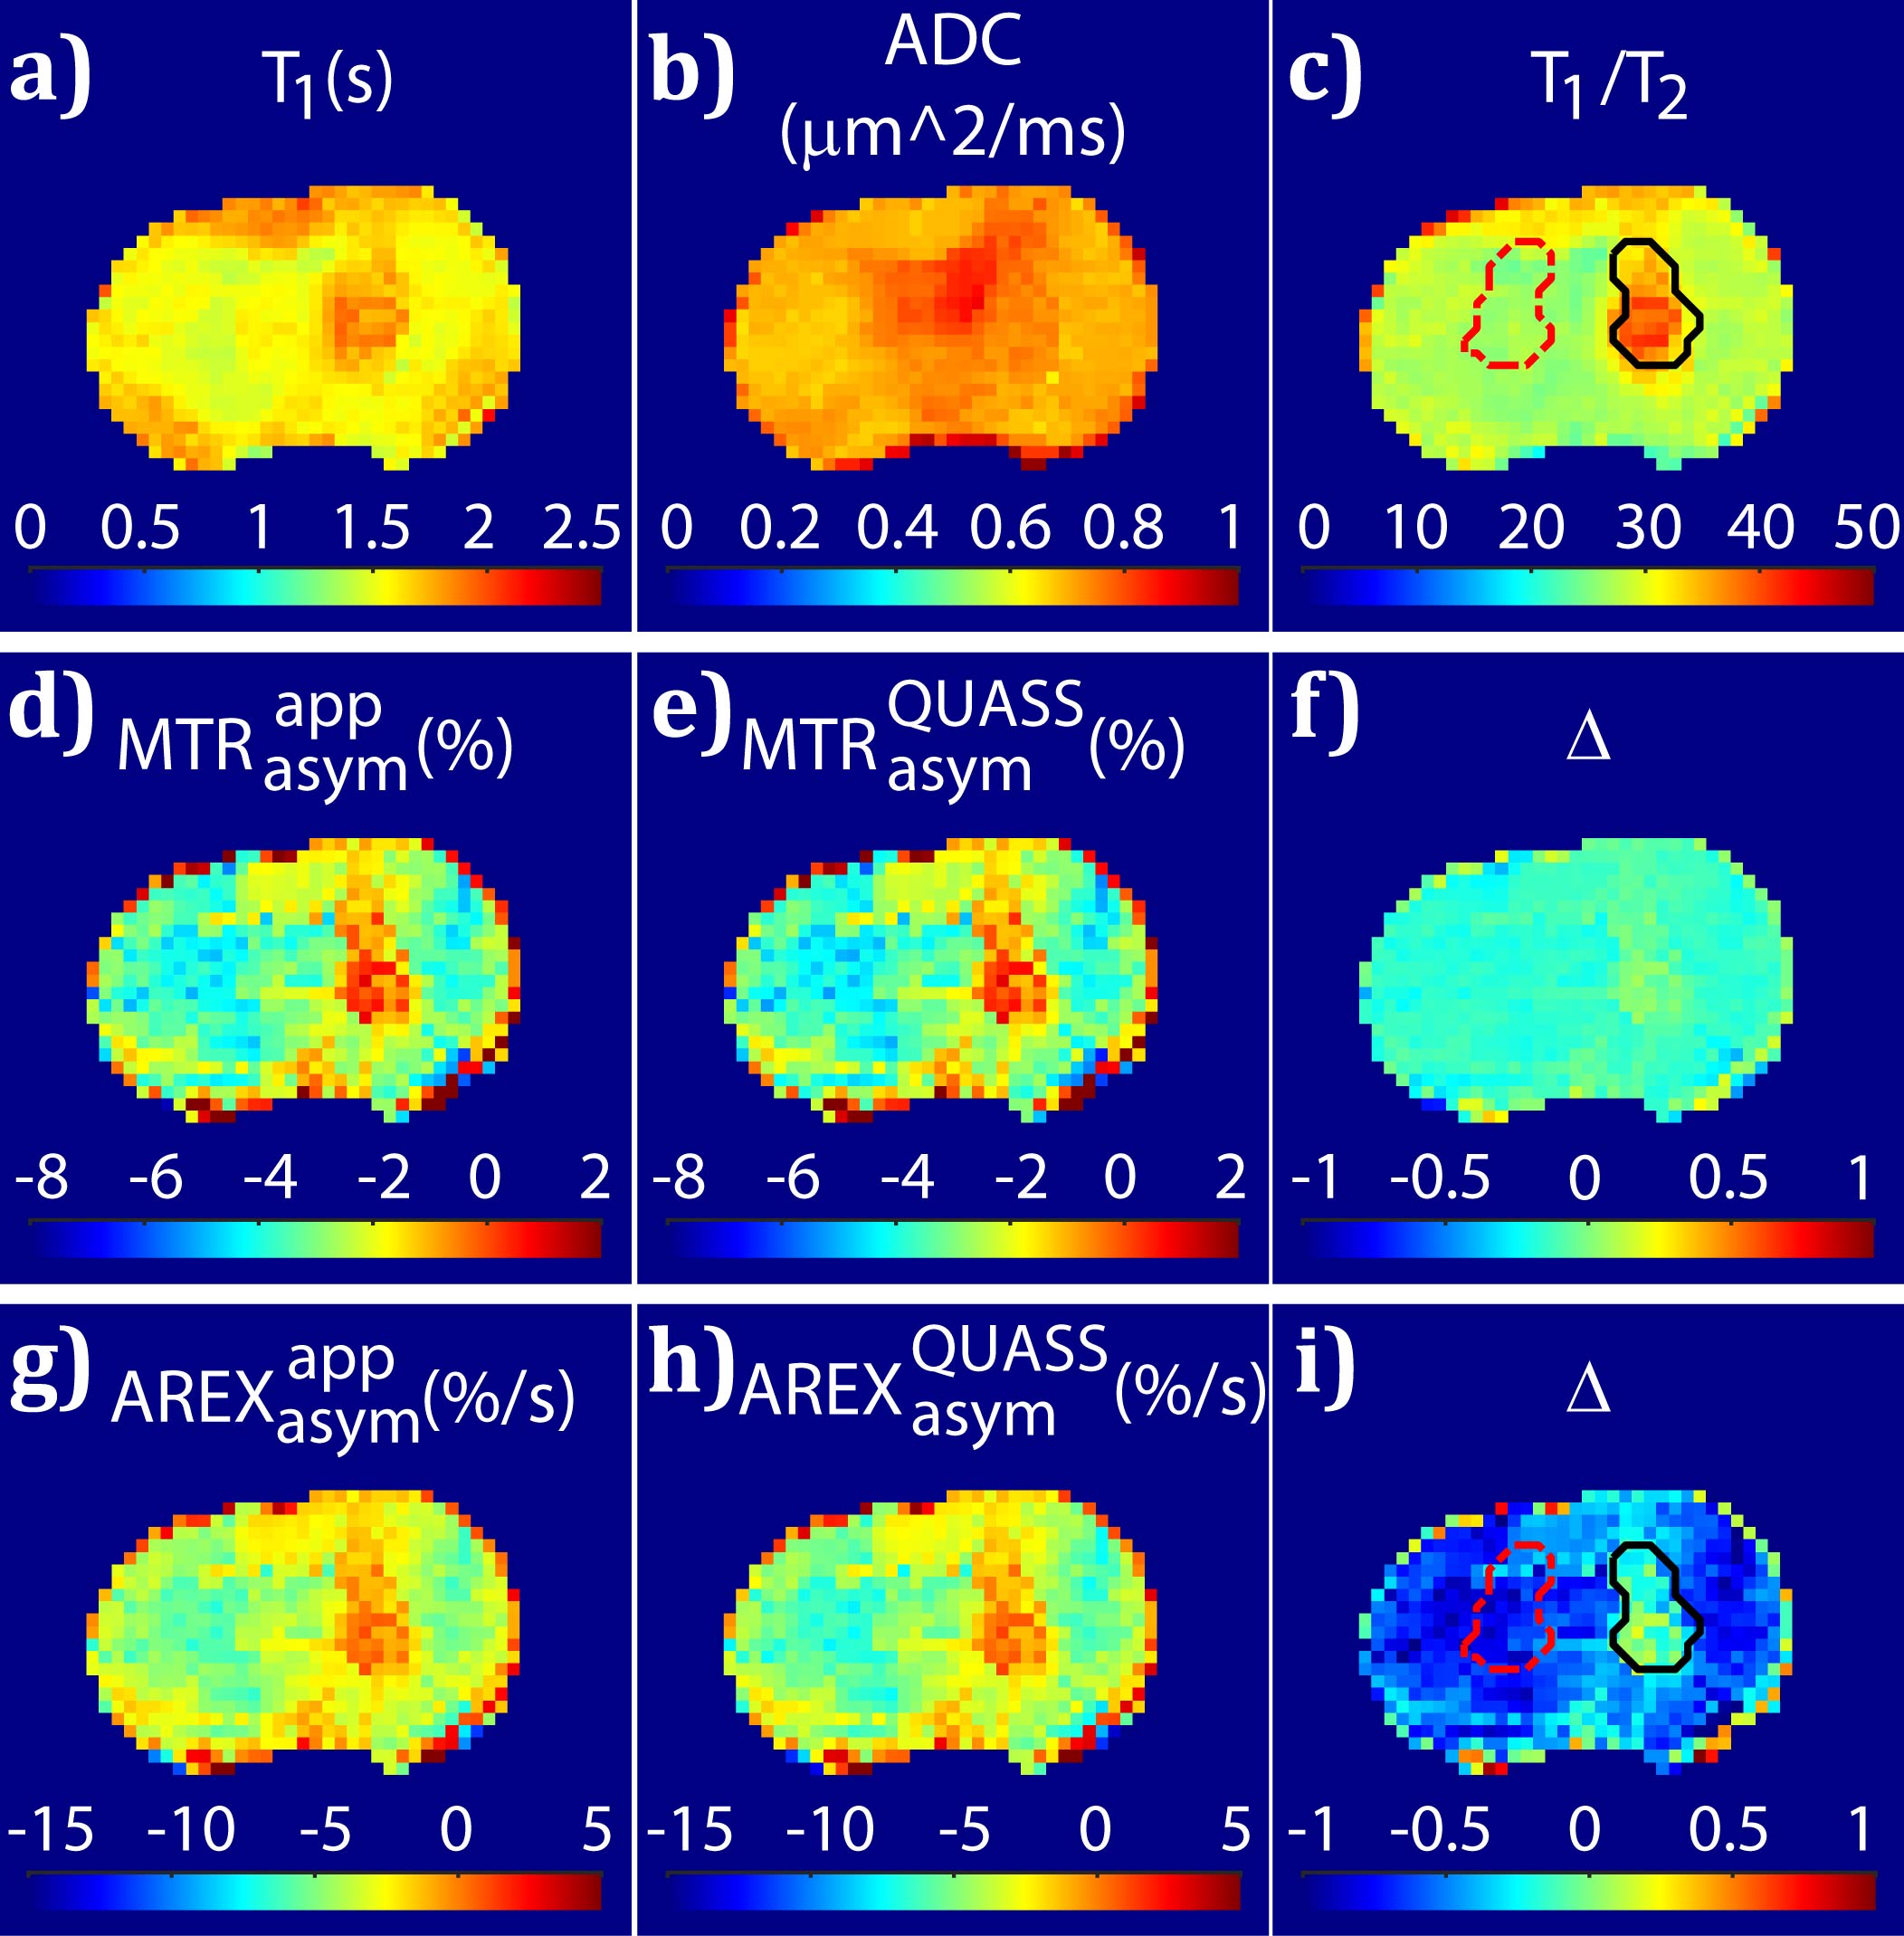
Z-spectra from two representative labile proton fraction ratios (0.1% (red) and 0.2% (blue)), each with two T1 values (i.e., 1 s (fine line) and 1.6 s (bold)) and two RF saturation times (i.e., 2 s (dash-dotted line) and 10 s (solid)). Figs. 1a and 1b show 8 distinct Z- and asymmetry- spectra due to permutation of the fraction ratio, T1 and Ts. Fig. 1c shows 6 different apparent AREX asymmetry spectra. In comparison, the QUASS corrected the impacts of different saturation times, so the dash-dotted lines (Ts=2s) coincided with that of long saturation times (Ts=10 s) in solid lines (Fig. 1d). The inverse asymmetry analysis shows four distinct asymmetry spectra for the two representative labile portion fraction ratio and two T1 values (Fig. 1e). QUASS AREX is sensitive only to the labile proton ratio, not Ts and T1, so only two spectra were shown, one for each labile proton concentration (Fig. 1f). Fig. 2 shows multi-parametric images of a representative rodent brain tumor model. T1 in the tumor (1.8±0.1 s) increased significantly from the normal ROI (1.5±0.1 s). The diffusion map showed a diffusive ADC increase without a clear margin (Fig. 2b). The T1 over T2 parametric MRI depicted a relatively uniform background, with the tumor mass appearing hyperintense (Fig. 2c). The MTR asymmetry map was calculated at 3.5 ppm, from the routine (Fig. 2d) and QUASS CEST MRI (Fig. 2e), with their difference shown in Fig. 2f. Whereas the QUASS MTRasym was not different from the apparent MTRasym for the tumor mass, it was significantly different in the contralateral normal ROI (-3.3 ± 0.9% (QUASS) vs. -3.2 ± 0.9% (apparent)). Although the magnitude of the tumor and normal contrast between apparent and QUASS MTRasym was small, it was statistically different (2.8 ± 0.8% (QUASS) vs. 2.7 ± 0.8% (apparent)). In comparison, the AREX metric was calculated from the routine (Fig. 2g) and QUASS CEST MRI (Fig. 2h), with their difference shown in Fig. 2i. The difference map clearly showed a difference between the tumor mass and the contralateral normal region of interest. Although the QUASS AREX was not different from the apparent AREX in the tumor mass (-0.6 ± 0.7% vs. -0.5 ± 0.7%), the difference in the contralateral normal region (-4.9 ± 1.4% vs. -4.3 ± 1.3%) was significant. It helps to discuss the intricate relationship between the CEST signal and T1. Because the T1 increase in the tumor is over 20%, the development of QUASS-boosted AREX is helpful in correcting the confounding T1 effect in APTw tumor imaging. Another important factor to consider is that CEST MRI benefits from ultra-high field applications because of the improved spectral resolution. Such cross-field studies also raise the question of T1 contribution.CONCLUSION
Our study demonstrated that QUASS postprocessing enhances the accuracy of T1 correction with the AREX metric, which is useful for typical CEST scans performed under non-equilibrium conditions. QUASS AREX provides CEST quantification independent of the RF saturation time, relaxation delay, and T1. In vivo QUASS AREX also documented significantly enhanced magnitude of change in tumor mass, normal tissue, and their difference.Acknowledgements
We thank Dr. Julia Fulci for providing the animal models, as well as Dr. Enfeng Wang and Jerry Chung for technical assistance in data collection at Massachusetts General Hospital. The study was supported in part by the Emory University Synergy Award.References
1. Togao O, Hiwatashi A, Yamashita K, Kikuchi K, Keupp J, Yoshimoto K, Kuga D, Yoneyama M, Suzuki SO, Iwaki T, Takahashi M, Iihara K, Honda H. Grading diffuse gliomas without intense contrast enhancement by amide proton transfer MR imaging: comparisons with diffusion- and perfusion-weighted imaging. Eur Radiol 2017;27(2):578-588. 2. Paech D, Dreher C, Regnery S, Meissner JE, Goerke S, Windschuh J, Oberhollenzer J, Schultheiss M, Deike-Hofmann K, Bickelhaupt S, Radbruch A, Zaiss M, Unterberg A, Wick W, Bendszus M, Bachert P, Ladd ME, Schlemmer HP. Relaxation-compensated amide proton transfer (APT) MRI signal intensity is associated with survival and progression in high-grade glioma patients. Eur Radiol 2019;29(9):4957-4967. 3. Suh CH, Park JE, Jung SC, Choi CG, Kim SJ, Kim HS. Amide proton transfer-weighted MRI in distinguishing high- and low-grade gliomas: a systematic review and meta-analysis. Neuroradiology 2019;61(5):525-534. 4. Zhou J, Zaiss M, Knutsson L, Sun PZ, Ahn SS, Aime S, Bachert P, Blakeley JO, Cai K, Chappell MA, Chen M, Gochberg DF, Goerke S, Heo HY, Jiang S, Jin T, Kim SG, Laterra J, Paech D, Pagel MD, Park JE, Reddy R, Sakata A, Sartoretti-Schefer S, Sherry AD, Smith SA, Stanisz GJ, Sundgren PC, Togao O, Vandsburger M, Wen Z, Wu Y, Zhang Y, Zhu W, Zu Z, van Zijl PCM. Review and consensus recommendations on clinical APT-weighted imaging approaches at 3T: Application to brain tumors. Magn Reson Med 2022;88(2):546-574. 5. Zaiss M, Windschuh J, Paech D, Meissner JE, Burth S, Schmitt B, Kickingereder P, Wiestler B, Wick W, Bendszus M, Schlemmer HP, Ladd ME, Bachert P, Radbruch A. Relaxation-compensated CEST-MRI of the human brain at 7T: Unbiased insight into NOE and amide signal changes in human glioblastoma. NeuroImage 2015;112:180-188. 6. Zhou J, Heo H-Y, Knutsson L, van Zijl PCM, Jiang S. APT-weighted MRI: Techniques, current neuro applications, and challenging issues. Journal of Magnetic Resonance Imaging 2019;50(2):347-364. 7. Sun PZ. Quasi-steady state chemical exchange saturation transfer (QUASS CEST) analysis-correction of the finite relaxation delay and saturation time for robust CEST measurement. Magn Reson Med 2021;85(6):3281-3289. 8. Sun PZ, Cheung JS, Wang E, Benner T, Sorensen AG. Fast multislice pH-weighted chemical exchange saturation transfer (CEST) MRI with Unevenly segmented RF irradiation. Magn Reson Med 2011;65(2):588-594. 9. Wu L, Jiang L, Sun PZ. Investigating the origin of pH-sensitive magnetization transfer ratio asymmetry MRI contrast during the acute stroke: Correction of T(1) change reveals the dominant amide proton transfer MRI signal. Magn Reson Med 2020;84(5):2702-2712.Figures