4457
B1 inhomogeneity corrected APT MRI based on direct saturation removed omega plot model at 5 T1Paul C. Lauterbur Research Center for Biomedical Imaging, Shenzhen Institute of Advanced Technology, Chinese Academy of Sciences, Shenzhen, Guangdong, China
Synopsis
Keywords: CEST / APT / NOE, CEST & MT
Motivation: B1 inhomogeneity correction is critical in CEST MRI. Reliable correction methods are desired.
Goal(s): This study developed a B1 inhomogeneity correction method based on a direct saturation removed omega plot model and tested its performance in human brain APTw imaging at 5 T.
Approach: Four healthy volunteers were scanned under four B1 levels. Corrected signal at nominal B1 was calculated from the omega plot model determined from either two or four B1 levels.
Results: B1 inhomogeneity-induced artifact was shown on uncorrected APTw images, which was effectively mitigated after correction. Comparably homogeneous APTw maps were obtained between two and four B1 levels.
Impact: The proposed method enables reliable B1 inhomogeneity correction from at least two B1 levels, providing an efficient way to improve quantitative CEST MRI, especially on high-field scanners.
Introduction
Amide proton transfer (APT) imaging can generate image contrast based endogeneous mobile proteins and peptides in tissues [1, 2]. Its contrast strongly depends on RF irradiation B1 level [3, 4]. Spatial variations of B1 would impair APT measurements, especially at high-field scanners [5]. Conventional B1 inhomogeneity correction methods depend on interpolation parameters or calibration curves, making reliable correction challenging [6, 7]. Recently, a direct saturation (DS) removed omega plot model showed a linear relationship between residual spectral signals and 1/B12 [8]. This study utilized the model to correct B1 inhomogeneity for improved APT MRI at 5 T.Materials and Methods
MRI study: The local institutional review board approved the study. Four healthy volunteers (27.8±3.5 years) were prospectively recruited. Written informed consent was obtained from all subjects. The MR study was conducted on a 5 T scanner (uMR Jupiter, Shanghai UIH, China) using a 48-channel head coil. Z spectra were acquired from -5 to 5 ppm with intervals of 0.2 ppm using a fat-suppressed FSE image readout (TR/saturation time/TE=6000 ms/3000 ms/6.72 ms, four nominal B1,nom levels=0.75, 1, 1.5 and 2 μT, FOV=200 x 200 mm2, in-plane resolution=2.08 x 2.08 mm2, and NEX=1) in addition to a reference scan with the frequency offset at 100 ppm. A WASSR map was collected with B1=0.2 μT (TR/saturation time=1500 ms/300 ms, frequency offsets between ±0.5 ppm with intervals of 0.05 ppm). Relative spatial distribution of B1 (B1,rel) field was mapped using a pre-conditioning RF pulse with TurboFLASH readout [9] (TR/TE=3.6 ms/1.8 ms, flip angle=70◦, NEX=1) applied at the same slice of APT imaging with identical FOV and spatial resolution.Data analysis: B1,rel map was calculated as described previously [9]. Saturated scans (S) were normalized by the unsaturated scan (S0), interpolated and corrected for B0 inhomogeneity using the WASSR approach [10, 11]. Z spectrum ranging from -5 to 1 ppm was used to fit DS, MT and NOE effects by a three-pool Lorentzian model. Residual spectrum (ΔZ) was obtained by removing DS contributions from respective Z spectrum. The actual irradiation amplitude B1 was the modulation of nominal B1,nom with the B1,rel map (i.e., $$$B_{1}=B_{1,nom}\cdot B_{1,rel}$$$), and its correlation with experimentally measured residual spectral signal (ΔZ(Δω)meas) followed $$$\frac{1}{\triangle Z(\triangle\omega)^{meas}}=C_{0}+C_{1}\cdot\frac{1}{\left(B_{1,nom}\cdot B_{1,rel}\right)^{2}}$$$. With C0 and C1 fitted from measured data, the corrected residual spectra signal (ΔZ(Δω)corr) could be determined from $$$\frac{1}{\triangle Z(\triangle\omega)^{corr}}=C_{0}+C_{1}\cdot\frac{1}{B_{1,nom}^{2}}$$$. ΔZ(Δω)corr at two representative B1,nom of 1.0 and 1.5 μT were calculated from either all four B1 levels or two B1 levels with two different B1 combinations. White matter (WM) was segmented by thresholding S0 and then was equally divided into four ROIs with thresholds of 25th, 50th, 75th and 100th percentiles of the B1,rel map. APT weighted (APTw) signals were quantified as $$$\triangle Z\left(3.5\ ppm\right)-\triangle Z\left(-3.5\ ppm\right)$$$. All values were reported as mean±standard deviation (SD).
Results
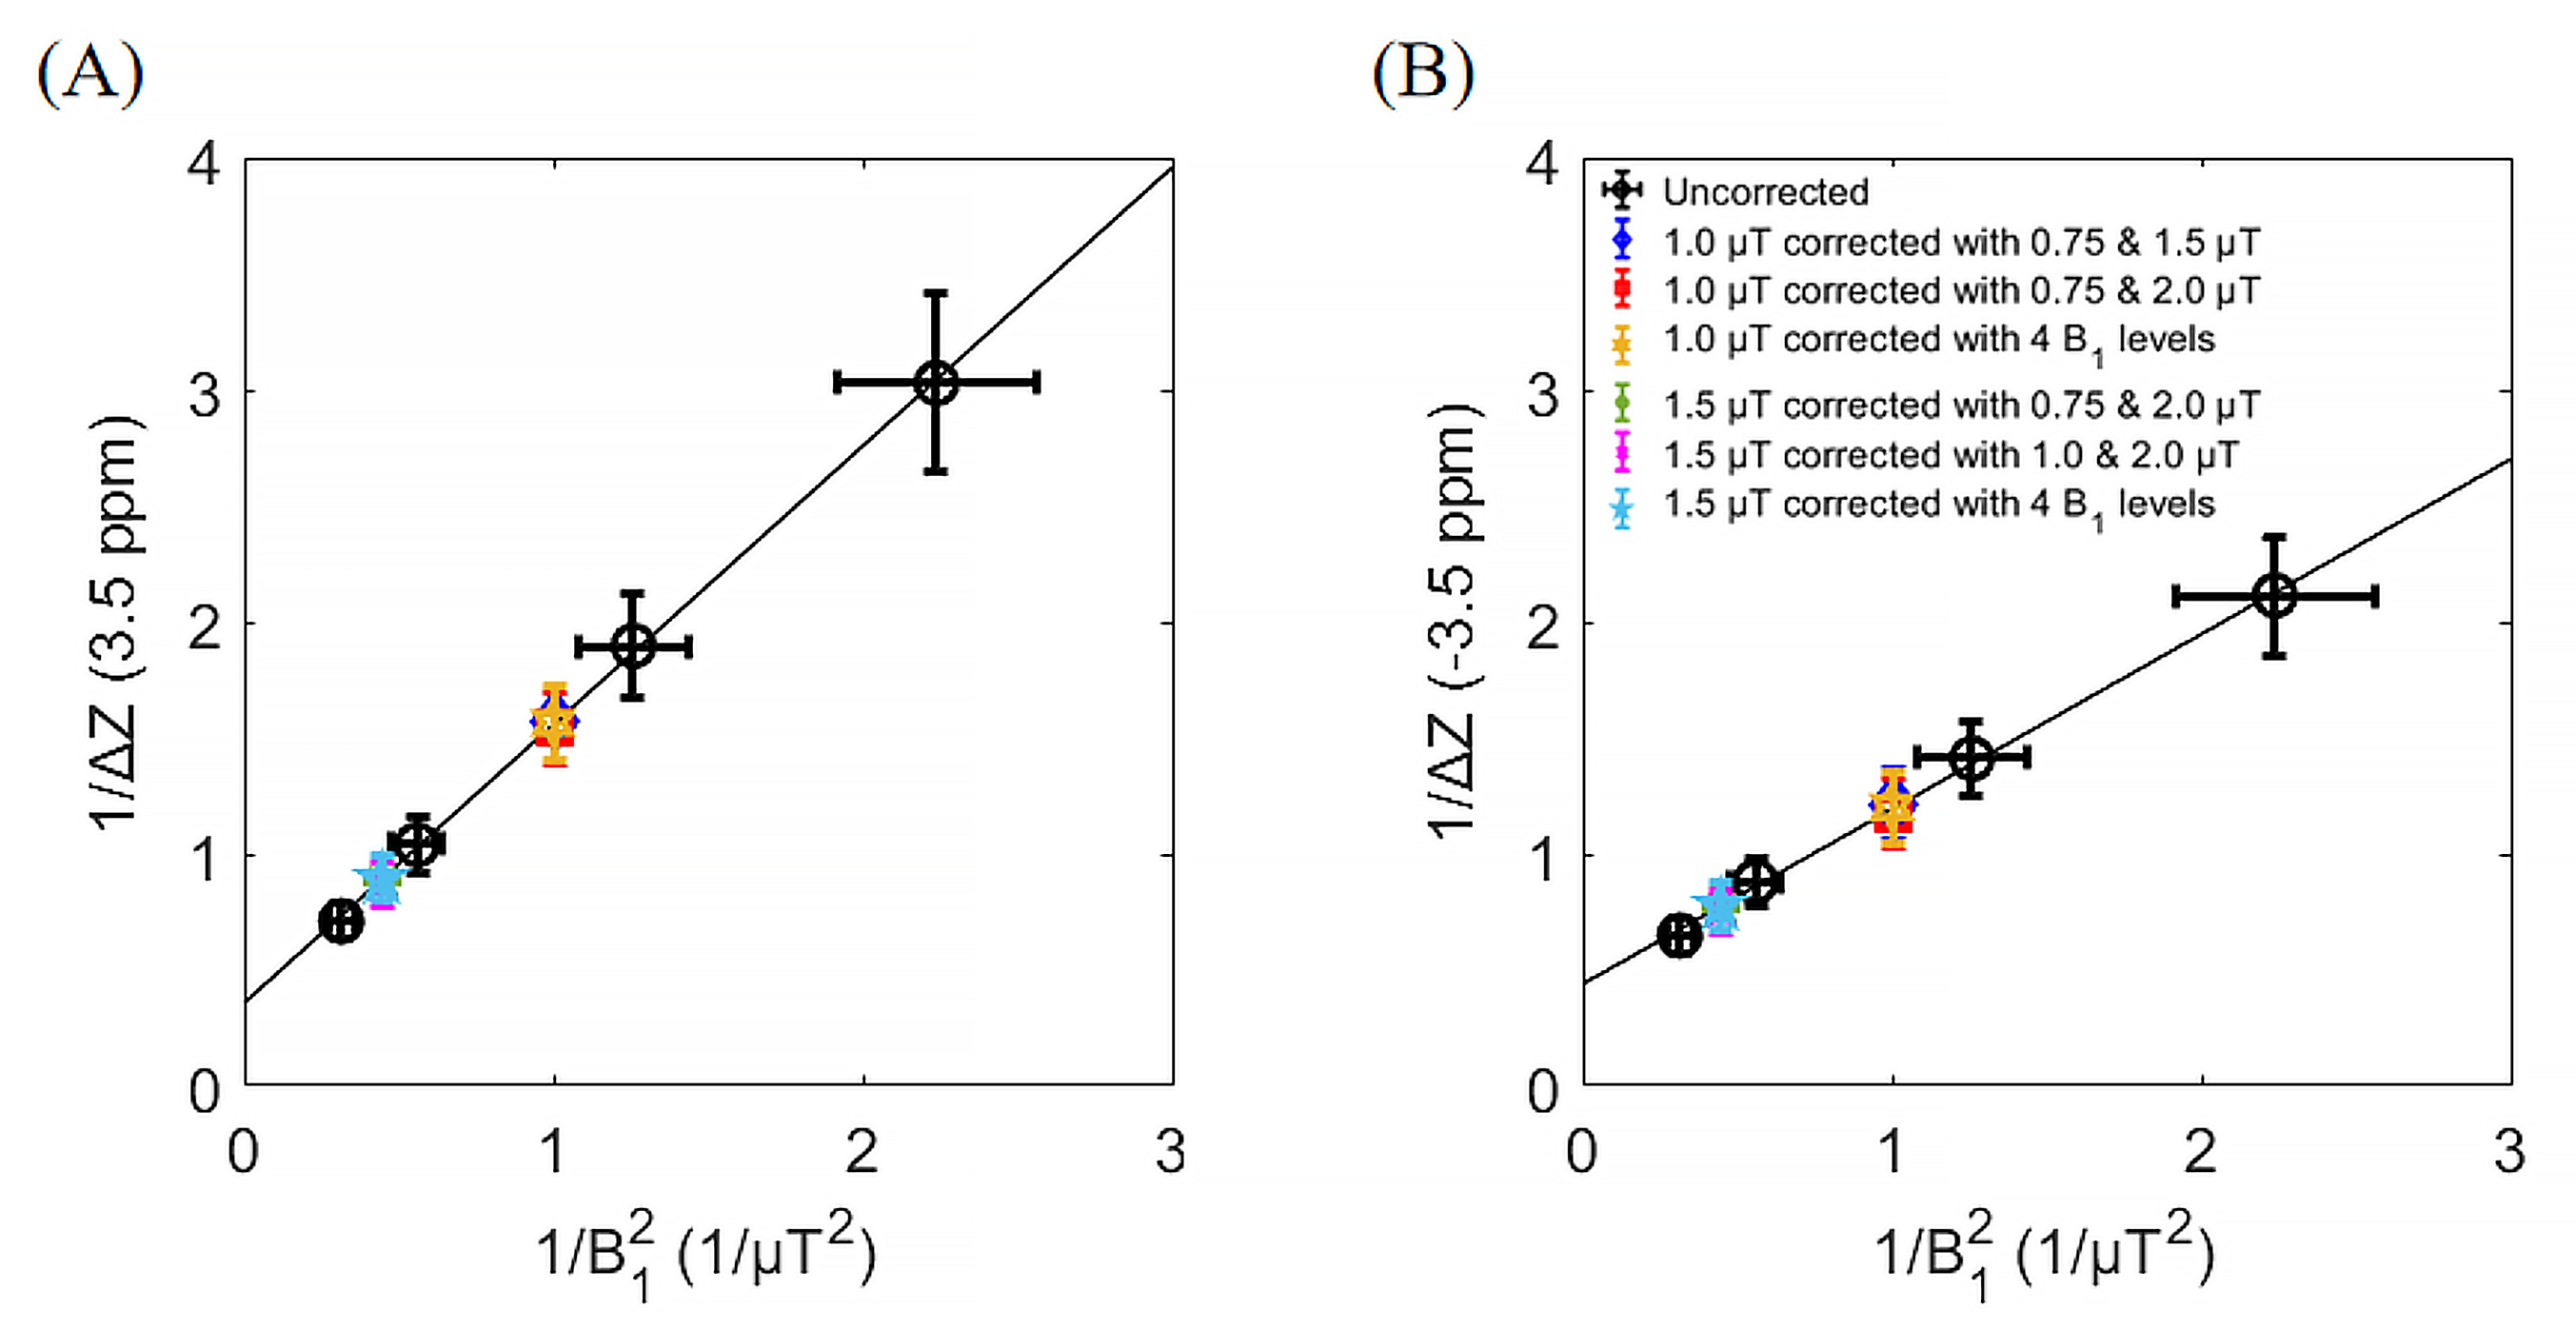
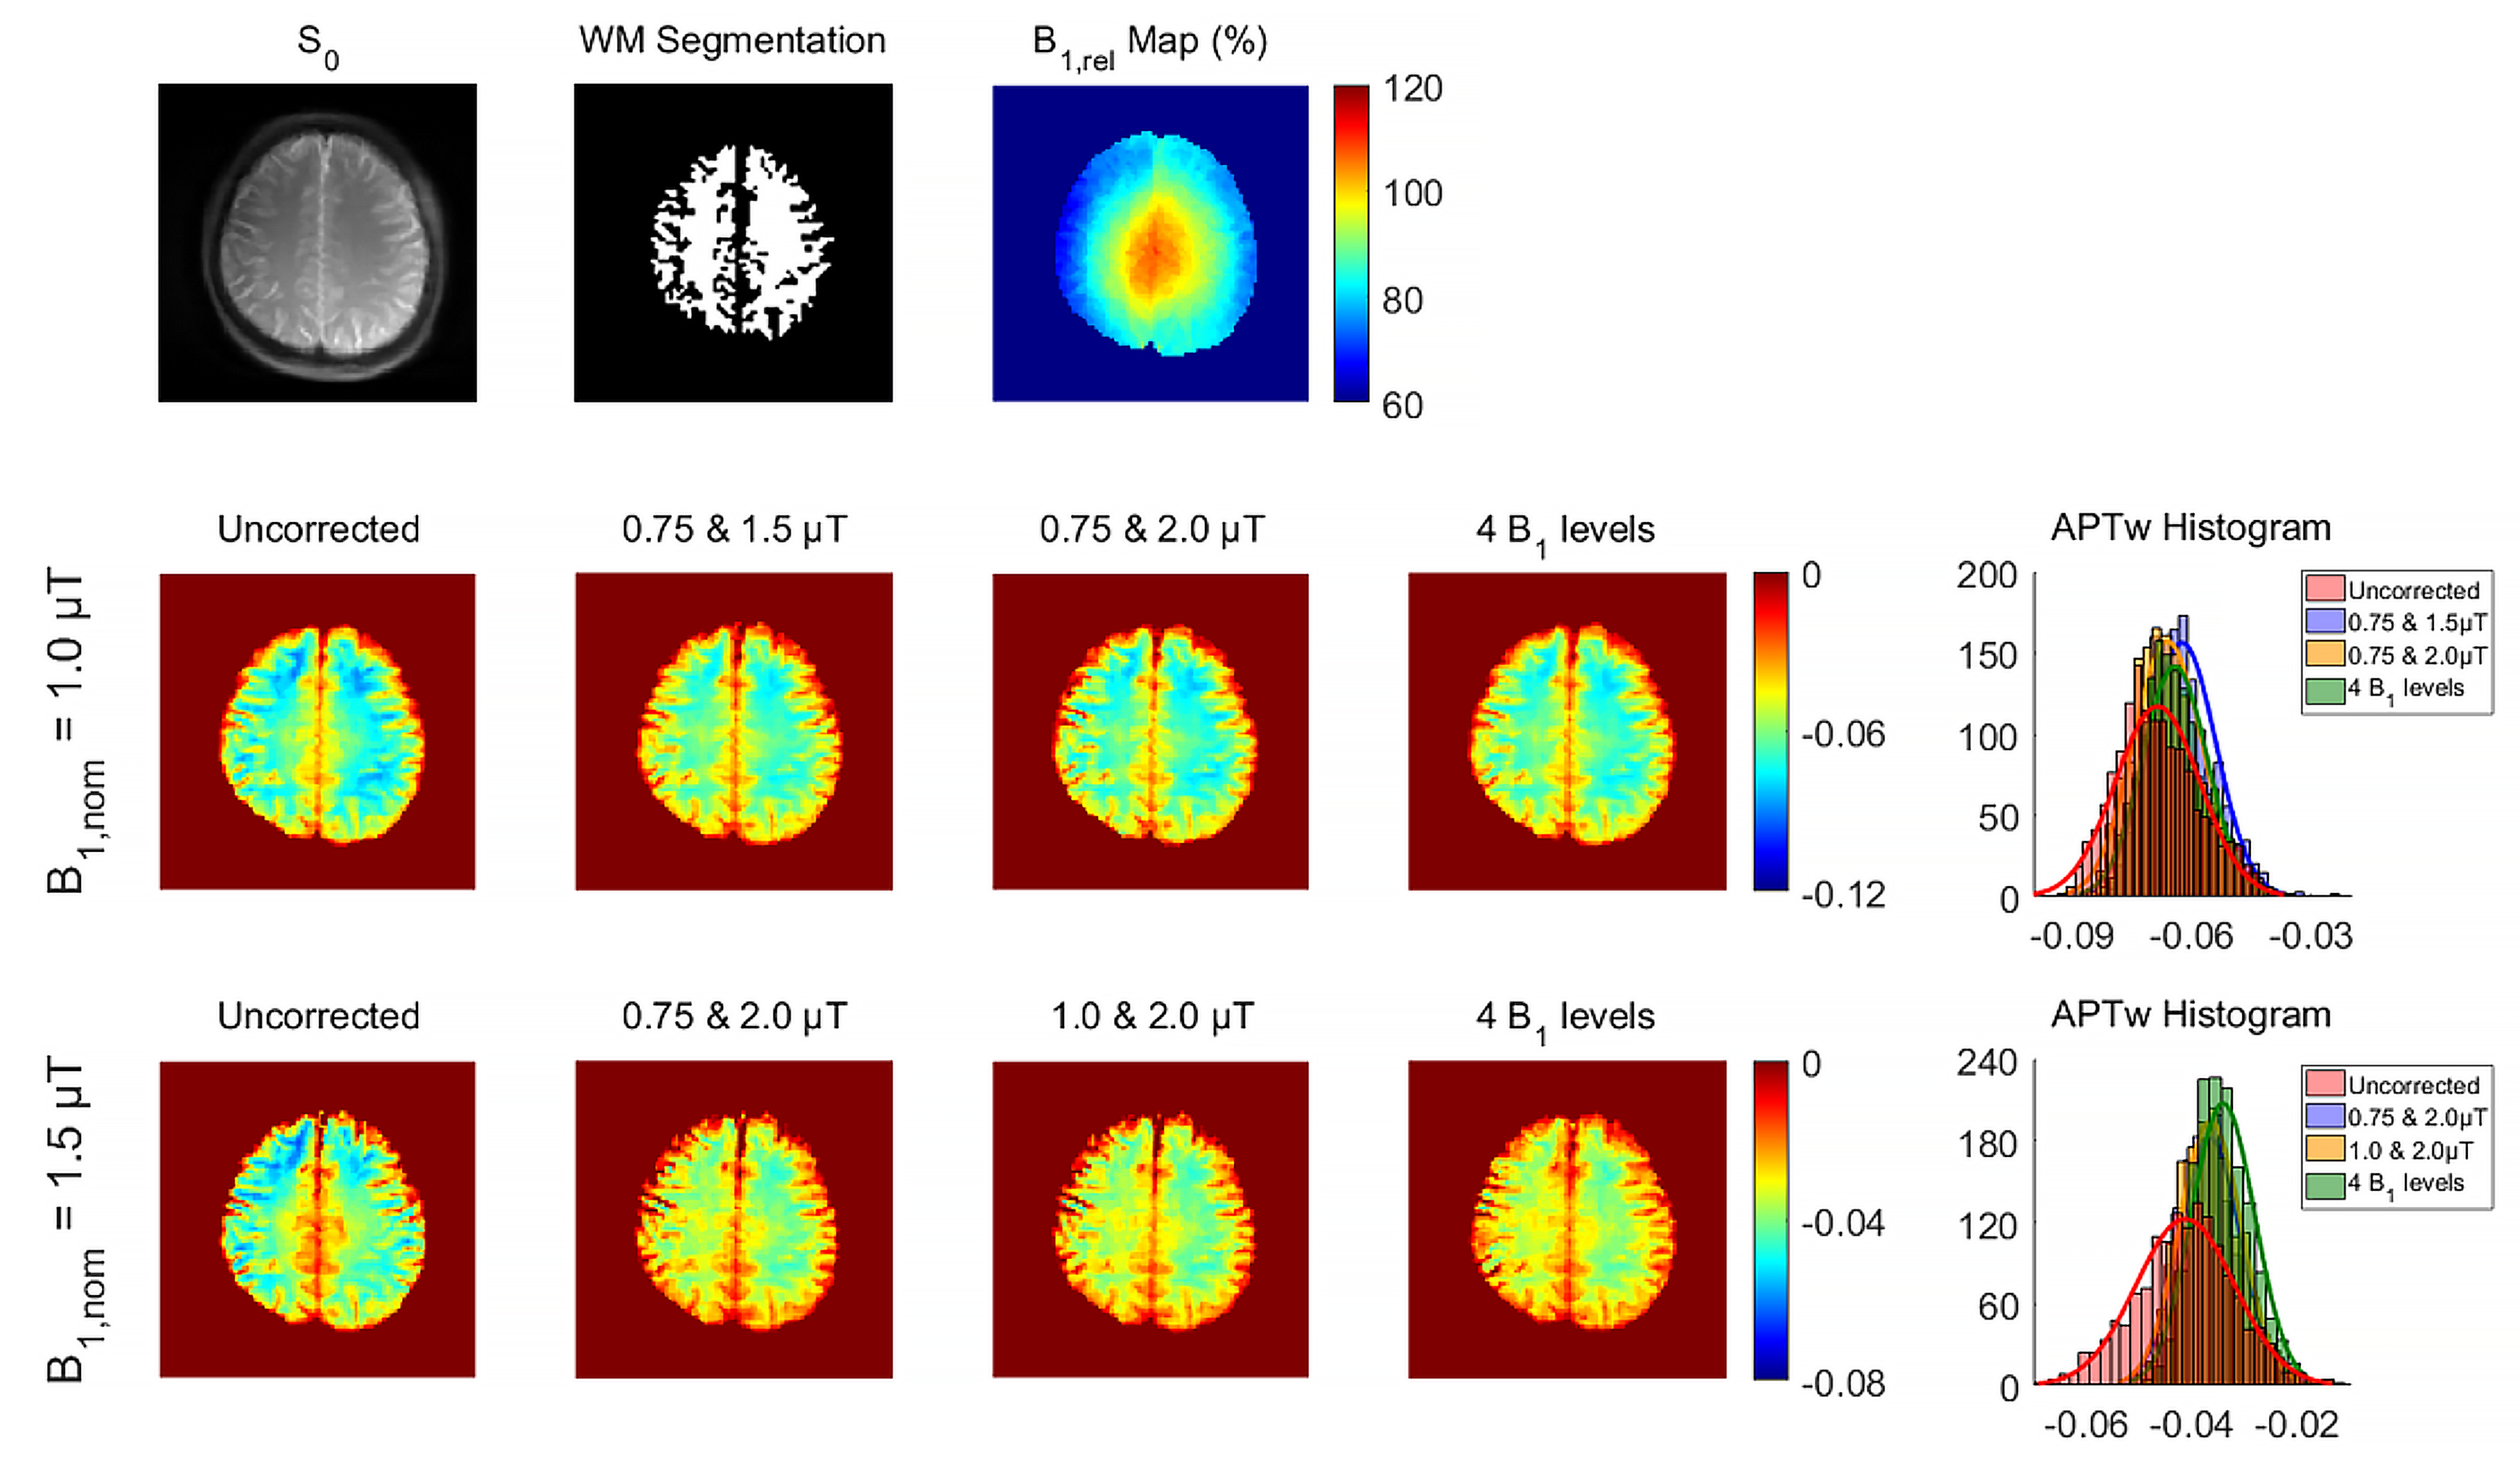
The inverse of residual spectral signals and 1/B12 exhibited linear relationship at 3.5 ppm and -3.5 ppm (Figure 1), as expected. Residual spectral signals corrected from two and all four B1 levels overlapped well at both B1,nom of 1.0 and 1.5 μT.Figure 2 displays multiparametric images of a representative healthy volunteer. Remarkable inhomogeneity was observed in the B1,rel map of WM, resulting in obvious artifact on the uncorrected APTw maps. Such artifact was substantially mitigated after B1 inhomogeneity correction. The histogram width of the corrected APTw signals decreased apparently, indicating substantially increased intra-tissue homogeneity. Moreover, comparable APTw images were observed among the three correction strategies.
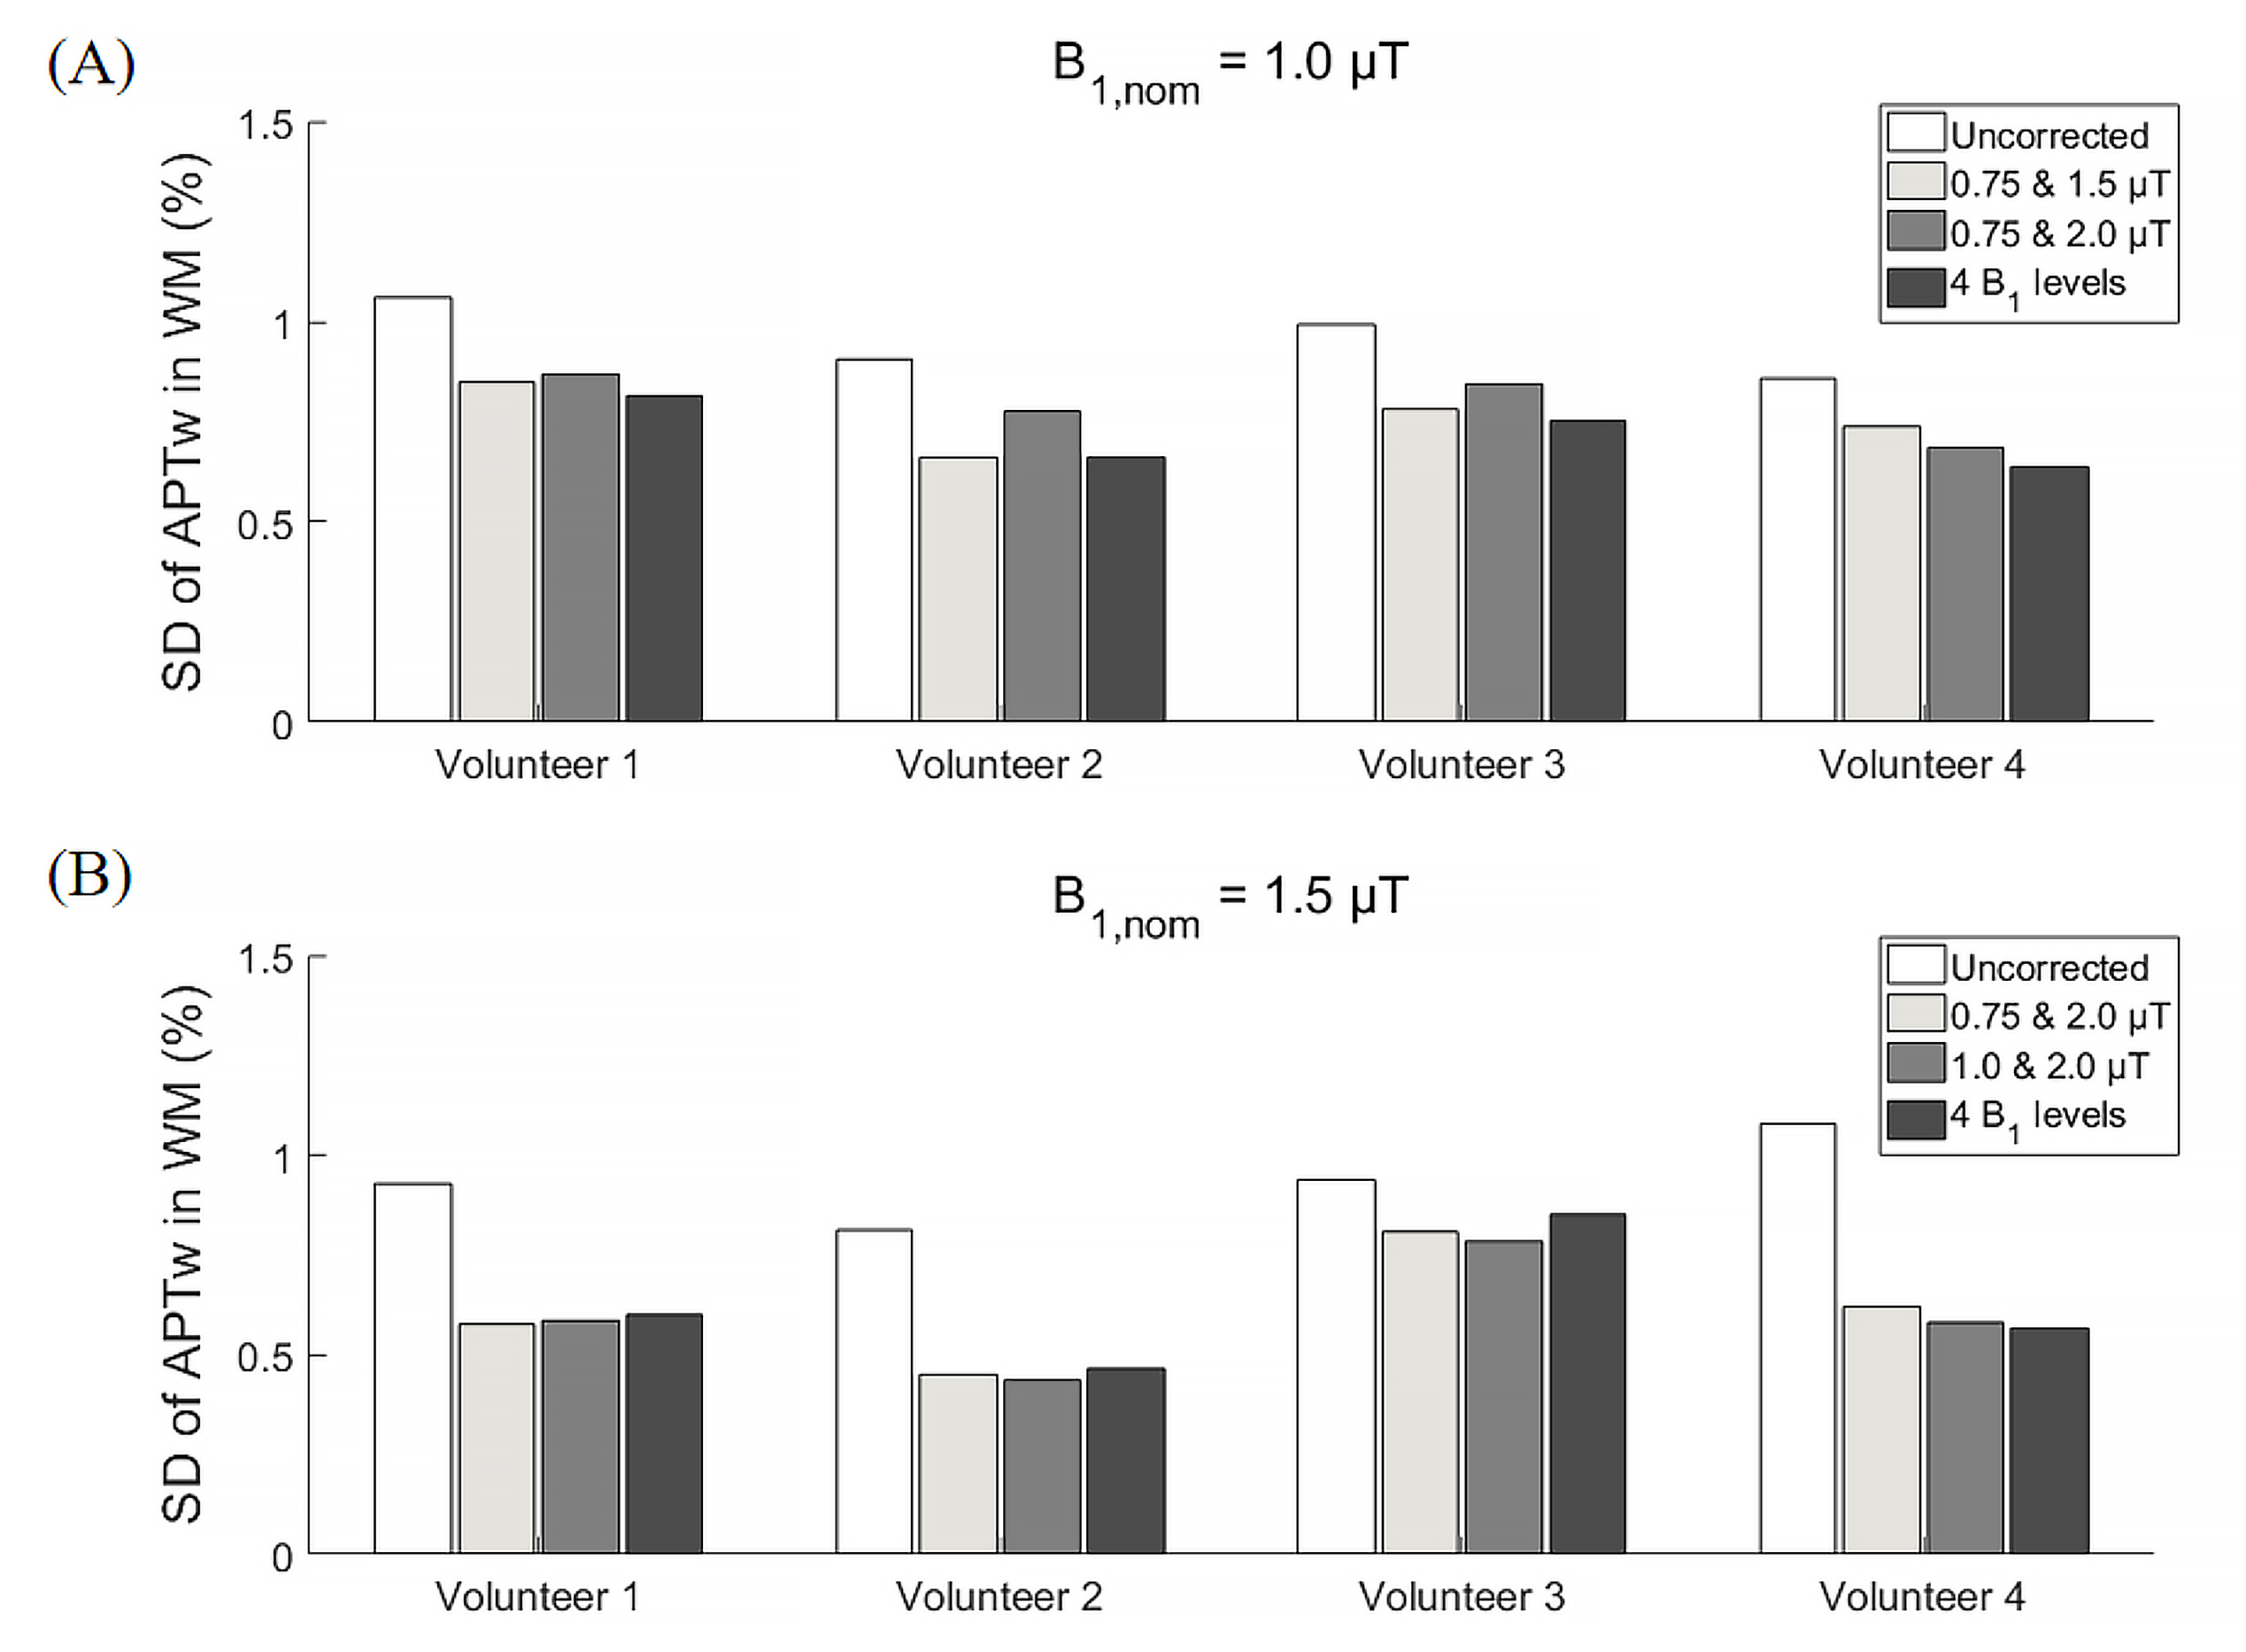
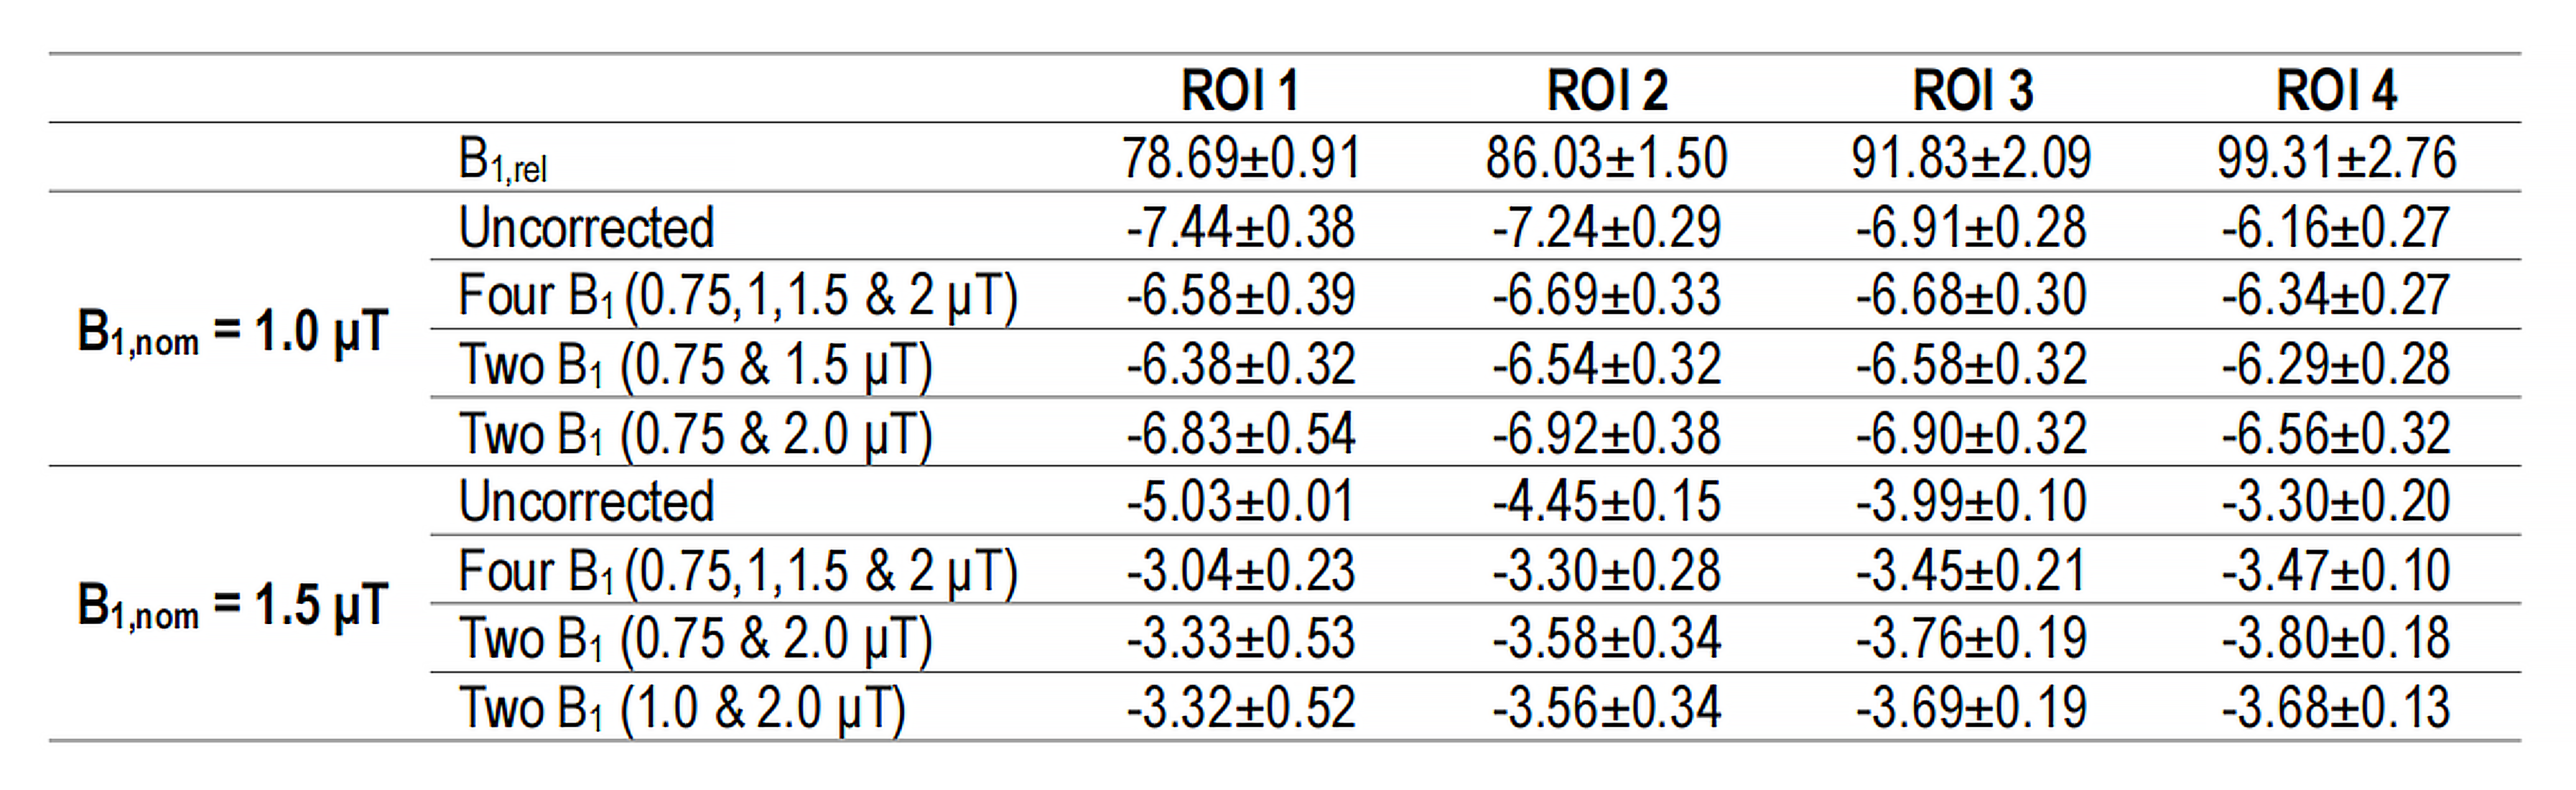
Figure 3 compares SD values of APTw signals within the entire WM. SD values of corrected APTw signals were consistently smaller than that before correction at both B1,nom of 1.0 and 1.5 μT in all volunteers. Additionally, uncorrected APTw signals varied substantially among the four ROIs, with a maximal absolute difference approximately 1.28% at B1,nom of 1.0 μT and 1.73% at B1,nom of 1.5 μT. In comparison, the maximal absolute difference of corrected APTw signals was less than 0.5% at both B1,nom (Table 1). Meanwhile, B1 inhomogeneity correction from two and four B1 levels yielded similar results.
Discussion and Conclusion
The proposed method was based on the DS removed omega plot model, where the residual spectral signal has a rigorous linear regression relationship with 1/B12 [8]. In vivo human brain experiments demonstrated that B1 inhomogeneity artifact could be effectively mitigated on APTw maps from at least two B1 levels, by calculating the residual spectral signal at the nominal B1,nom level chosen in the protocol settings. The DS removed omega plot model provides a reliable and efficient way to improve quantitative APT MRI in clinical settings.Acknowledgements
National Natural Science Foundation of China (92259203 and 82271976), and the Outstanding Scientific and Technological Innovation Talent Training Program of Shenzhen (RCJC20221008092809018).References
[1] Zhou J, Payen J, Wilson DA, Traystman RJ, van Zijl PCM. Using the amide proton signals of intracellular proteins and peptides to detect pH effects in MRI. Nature Med. 2003;9:1085-1090.
[2] Zhou J, Lal B, Wilson DA, Laterra J, van Zijl PCM. Amide proton transfer (APT) contrast for imaging of brain tumors. Magn Reson Med. 2003;50:1120-1126.
[3] Kim J, Wu Y, Guo Y, Zheng H, Sun PZ. A review of optimization and quantification techniques for chemical exchange saturation transfer MRI toward sensitive in vivo imaging. Contrast Media Mol Imaging 2015;10(3):163-178.
[4] van Zijl PCM, Lam WW, Xu J, Knutsson L, Stanisz GJ. Magnetization Transfer Contrast and Chemical Exchange Saturation Transfer MRI. Features and analysis of the field-dependent saturation spectrum. Neuroimage 2018;168:222-241.
[5] Liu G, Song X, Chan KWY, McMahon MT. Nuts and bolts of chemical exchange saturation transfer MRI. NMR Biomed 2013;26(7):810-828.
[6] Windschuh J, Zaiss M, Meissner JE, Paech D, Radbruch A, Ladd ME, Bachert P. Correction of B1-inhomogeneities for relaxation-compensated CEST imaging at 7 T. NMR Biomed 2015;28(5):529-537.
[7] Singh A, Cai K, Haris M, Hariharan H, Reddy R. On B1 inhomogeneity correction of in vivo human brain glutamate chemical exchange saturation transfer contrast at 7 T. Magn Reson Med 2013;69(3):818-824.
[8] Shaghaghi M, Chen W, Scotti A, Ye H, Zhang Y, Zhu W, Cai K. In vivo quantification of proton exchange rate in healthy human brains with omega plot. Quantitative imaging in medicine and surgery 2019;9(10):1686-1696.
[9] Chung S, Kim D, Breton E, Axel L. Rapid B1+ mapping using a preconditioning RF pulse with TurboFLASH readout. Magn Reson Med 2010;64(2):439-446.
[10] Stancanello J, Terreno E, Castelli DD, Cabella C, Uggeri F, Aime S. Development and validation of a smoothing-splines-based correction method for improving the analysis of CEST-MR images. Contrast Media Mol Imaging 2008;3(4):136-149.
[11] Kim M, Gillen J, Landman BA, Zhou J, van Zijl PCM. Water saturation shift referencing (WASSR) for chemical exchange saturation transfer (CEST) experiments. Magn Reson Med 2009;61(6):1441-1450.
Figures