4456
Towards Temperature-Corrected pH Mapping using CEST Imaging: Quantification of the Underlying Calibration as a Function of Temperature1Medical Physics in Radiology, German Cancer Research Center (DKFZ), Heidelberg, Germany, 2Faculty of Physics and Astronomy, University of Heidelberg, Heidelberg, Germany, 3Faculty of Medicine, University of Heidelberg, Heidelberg, Germany
Synopsis
Keywords: CEST / APT / NOE, CEST & MT
Motivation: CEST-based pH mapping relies on a strongly temperature-dependent calibration, yielding the parameter kc characterizing the exchange rate. Previously, this calibration has only been performed at T=37°C, thus impeding quantitative pH mapping at different temperatures.
Goal(s): Enabling more reliable, i.e. temperature-corrected, quantitative CEST-based pH mapping.
Approach: We quantified the temperature dependency of kc(T) for amide, amine and guanidino protons at B0=9.4T using creatine and protamine model solutions at various pH and temperatures.
Results: For all proton species, the measured kc(T) showed exponential temperature dependencies with doubling of kc(T) for distinct temperature increases (ΔT=Tdouble) of around 4−11°C. Interestingly, each proton species exhibited a characteristic Tdouble.
Impact: These findings enable CEST-based pH mapping at any desired temperature, which, previously, has only been possible at T=37°C. Prospectively, quantitative pH mapping will now also be possible in anatomical regions, e.g. human lower leg, where temperatures may deviate from T=37°C.
Introduction
The intracellular pH (pHi) is typically increased in tumors and therefore a valuable imaging biomarker for the assessment of cancer.1 Recently, we demonstrated the in vivo applicability of quantitative pHi mapping using endogenous CEST signals in (i) tumor-bearing mice at 9.4T2,3 and (ii) the healthy human brain at 7T4. Specifically, the method employs the pH-dependent exchange rates (kex) of amide and guanidino protons (Δωamide=3.5, Δωgua=2.0 ppm) for quantitative pH mapping. Importantly, the method fundamentally depends on a strongly temperature-dependent calibration, yielding the parameter kc that characterizes the exchange rate. This calibrated kc is used to directly translate measured kex into pH values2,3. However, until now, this calibration has only been performed at T=37°C2,3, thus impeding quantitative pH mapping at different temperatures.The aim of this study was to quantify the temperature dependency of kc(T) for amide, guanidino and, additionally, amine protons (Δωamine=2.7 ppm) using CEST-MRI at 9.4T. To this end, creatine and protamine model solutions were investigated at various pH and temperatures.
Theory
Our recently developed method for quantitative pH mapping2–5 is based on two assumptions: (1) a fixed temperature (T=37°C) and (2) a base-catalyzed exchange rate, yielding $$$k_{ex}(pH,T=37°C)=k_{c,37}\cdot{10^{pH}}$$$, with the parameter kc,37=kc(T=37°C) characterizing the exchange rate. Thus, measurement of kex and calibration of kc,37 enable pH mapping at T=37°C via$$$~pH=log_{10}[\frac{k_{ex}}{k_{c,37}}]$$$.In this study, we propose an exponential temperature dependency of kc(T) given by$$k_{c}(T)=k_{c,37}\cdot2^{\frac{T-37°C}{T_{double}}}\quad\quad\quad\quad[Eq.~1]$$where Tdouble represents the temperature increase for which the value of kc doubles. With (Eq.1), one can completely describe the pH and temperature dependency of kex(pH,T) by only two parameters (i.e., kc,37 and Tdouble) via$$k_{ex}(pH,T)=k_{c}(T)\cdot{10^{pH}}=k_{c,37}\cdot2^{\frac{T-37°C}{T_{double}}}\cdot{10^{pH}}\quad\quad\quad\quad[Eq.~2]$$
Methods
Creatine and protamine model solutions were investigated at different pH and temperatures (pHcreatine=6.0–8.0 [6.0:0.2:8.0], pHprotamine=5.0–8.0 [5.0:0.3:8.0]; Tcreatine=Tprotamine=25–40°C [25:3:40]; ccreatine=1.0%(w/v), cprotamine=1.5%(w/v); buffer: cPBS=1/15M). All measurements were performed on a 9.4T small-animal MR scanner (Bruker BioSpec). Temperatures were stabilized at Tdesired±0.2°C.For image acquisition, a custom-built 3D FISP sequence was used (resolution=0.45×0.45×1.50mm3, matrix=66×66×12). Multiple whole Z-spectra CEST scans were acquired (cw presaturation, tsat=16s, B1=[0.5,0.75,1.0,1.25,1.5µT]) and one WASABI6 scan for B0 and B1 inhomogeneity mapping. Voxel-wise postprocessing: (i) correction for B0-inhomogeneities, (ii) determination of Zlab and Zref (creatine: Zlab=Z(2ppm), Zref=Z(-2ppm); protamine: Z-spectra fitting via 4-pool Lorentzian comprising water, amide, amine and guanidino peaks), (iii) contrast calculation via the relaxation-compensated inverse metric7–9$$$~MTR_{Rex}=\frac{1}{Z_{lab}(\Delta\omega)}-\frac{1}{Z_{ref}(\Delta\omega)}~$$$ and (iv) contrast-B1-correction10.
Calibration of kc at various temperatures was performed by finding the position of the maximum (pHmax) of MTRRex(pH) at B1=1.0µT via2,3$$k_{c}(T=const)=\frac{\gamma{B_{1}}}{10^{pH_{max}(T=const)}}\quad\quad\quad\quad[Eq.~3]$$Quantification of kc,37°C and Tdouble was accomplished by fitting kc(T) via (Eq.1).
Results and Discussion
For creatine and protamine model solutions, the measured Z-spectra showed strong dependencies on pH and temperature (Figure 1 and 2, different colors). For all investigated proton species, the quality of Z-spectra was sufficient to reliably extract MTRRex across the entire range of utilized pH and temperatures (Figure 3, data points). For each temperature, experimental determination of pHmax (Figure 3, different-colored fits) enabled calculation of kc (Figure 4, data points).For kc(T) of all observed proton species, exponential temperature dependencies were observed (Figure 4), in good coherence with theory (Eq.1). For amide protons, slight deviations were observed for kc,amide(T) particularly at T<31°C (Figure 4b), because the investigated pH were smaller than pHmax,amide of MTRRex,amide(pH) (Figure 3b) leading to challenging extraction of kc,amide at T<31°C. From literature11–13, it is known that kex(T) depends exponentially on temperature. Importantly, in our approach this holds true because via (Eq.2) the observed exponential temperature dependencies of kc(T) directly translate to kex(T).
For all proton species, fitting of kc(T) (Figure 4, fits) enabled calculation of kc,37 and Tdouble. Interestingly, the values found for kc,37 and Tdouble are distinct and characteristic for each proton species (Table 1). Remarkably, differences were observed between creatine and protamine guanidino protons, indicating dependencies on the specific chemical environment. A temperature increase of ΔT=Tdouble also yields a doubling of kex (Eq.2). For creatine, the found Tdouble,creatine=7.43±1.91°C agrees well with values estimated from kex,creatine(T) data in literature12,13 (Tdouble,creatine≈6°C12 and Tdouble,creatine≈8°C13).
In future work, the calibration of kc(T) will be performed using more realistic, in vivo-like model systems (e.g., porcine brain lysates mimicking the in vivo composition of proteins), paving the way for temperature-corrected pHi mapping in vivo.
Conclusion
In this study, the temperature dependency of the calibration parameter kc(T) was quantified for amide, amine and guanidino protons. Consequently, our method for quantitative CEST-based pH mapping can now be performed at any desired temperature which, previously, has only been possible at T=37°C.Prospectively, these insights will allow for more reliable, i.e. temperature-corrected, quantitative pHi mapping in vivo which is important for examinations of anatomical regions where temperatures may deviate from T=37°C, e.g. the human lower leg.
Acknowledgements
Conflict of Interests: The German Cancer Research Center (DKFZ) maintains a research collaboration agreement with Bruker BioSpin MRI GmbH. Bruker did not have any influence on the direction or contents of this manuscript.
The authors declare that they have no competing interests.
References
1. Webb BA, Chimenti M, Jacobson MP, et al. Dysregulated pH: a perfect storm for cancer progression. Nat Rev Cancer. 2011;11:671–677.
2. Boyd PS, Breitling J, Korzowski A, et al. Mapping intracellular pH in tumors using amide and guanidyl CEST-MRI at 9.4 T. Magn Reson Med. 2022;87:2436–2452.
3. Boyd PS. Mapping intracellular pH of tumors in vivo using CEST-MRI: methodological development and preclinical investigation. Dissertation; University of Heidelberg 2022. DOI: 10.11588/heidok.00032083.
4. Boyd PS, Kroh F, Breitling J, et al. Quantitative volumetric mapping of intracellular pH in the human brain at 7 T using endogenous CEST-MRI: A proof of principle study. Proc 32th Annu Meet Int Soc Magn Reson Med.;Abstract #2998.
5. Boyd PS, Diederichs L, Breitling J, et al. Presaturation pulse shape enables shifting the pH sensitivity of guanidyl CEST-MRI for absolute pH mapping at 9.4 T. Proc 31th Annu Meet Int Soc Magn Reson Med.;Abstract #2803.
6. Schuenke P, Windschuh J, Roeloffs V, et al. Simultaneous Mapping of Water Shift and B1 (WASABI)—Application to Field-Inhomogeneity Correction of CEST MRI Data. Magn Reson Med. 2017;77:571–580.
7. Zaiss M, Xu J, Goerke S, et al. Inverse Z-spectrum analysis for spillover-, MT-, and T1-corrected steady-state pulsed CEST-MRI – application to pH-weighted MRI of acute stroke. NMR Biomed. 2014;27:240–252.
8. Zaiss M, Bachert P. Chemical exchange saturation transfer (CEST) and MR Z-spectroscopy in vivo: a review of theoretical approaches and methods. Phys Med Biol. 2013;58:R221–R269.
9. Zaiss M, Bachert P. Exchange-dependent relaxation in the rotating frame for slow and intermediate exchange – modeling off-resonant spin-lock and chemical exchange saturation transfer. NMR Biomed. 2013;26:507–518.
10. Windschuh J, Zaiss M, Meissner J-E, et al. Correction of B1-inhomogeneities for relaxation-compensated CEST imaging at 7 T. NMR Biomed. 2015;28:529–537.
11. Bai Y, Milne JS, Mayne L, et al. Primary structure effects on peptide group hydrogen exchange. Proteins Struct Funct Genet. 1993;17:75–86.
12. Goerke S, Zaiss M, Bachert P. Characterization of creatine guanidinium proton exchange by water-exchange (WEX) spectroscopy for absolute-pH CEST imaging in vitro. NMR Biomed. 2014;27:507–518.
13. Wermter FC, Bock C, Dreher W. Investigating GluCEST and its specificity for pH mapping at low temperatures. NMR Biomed. 2015;28:1507–1517.
Figures
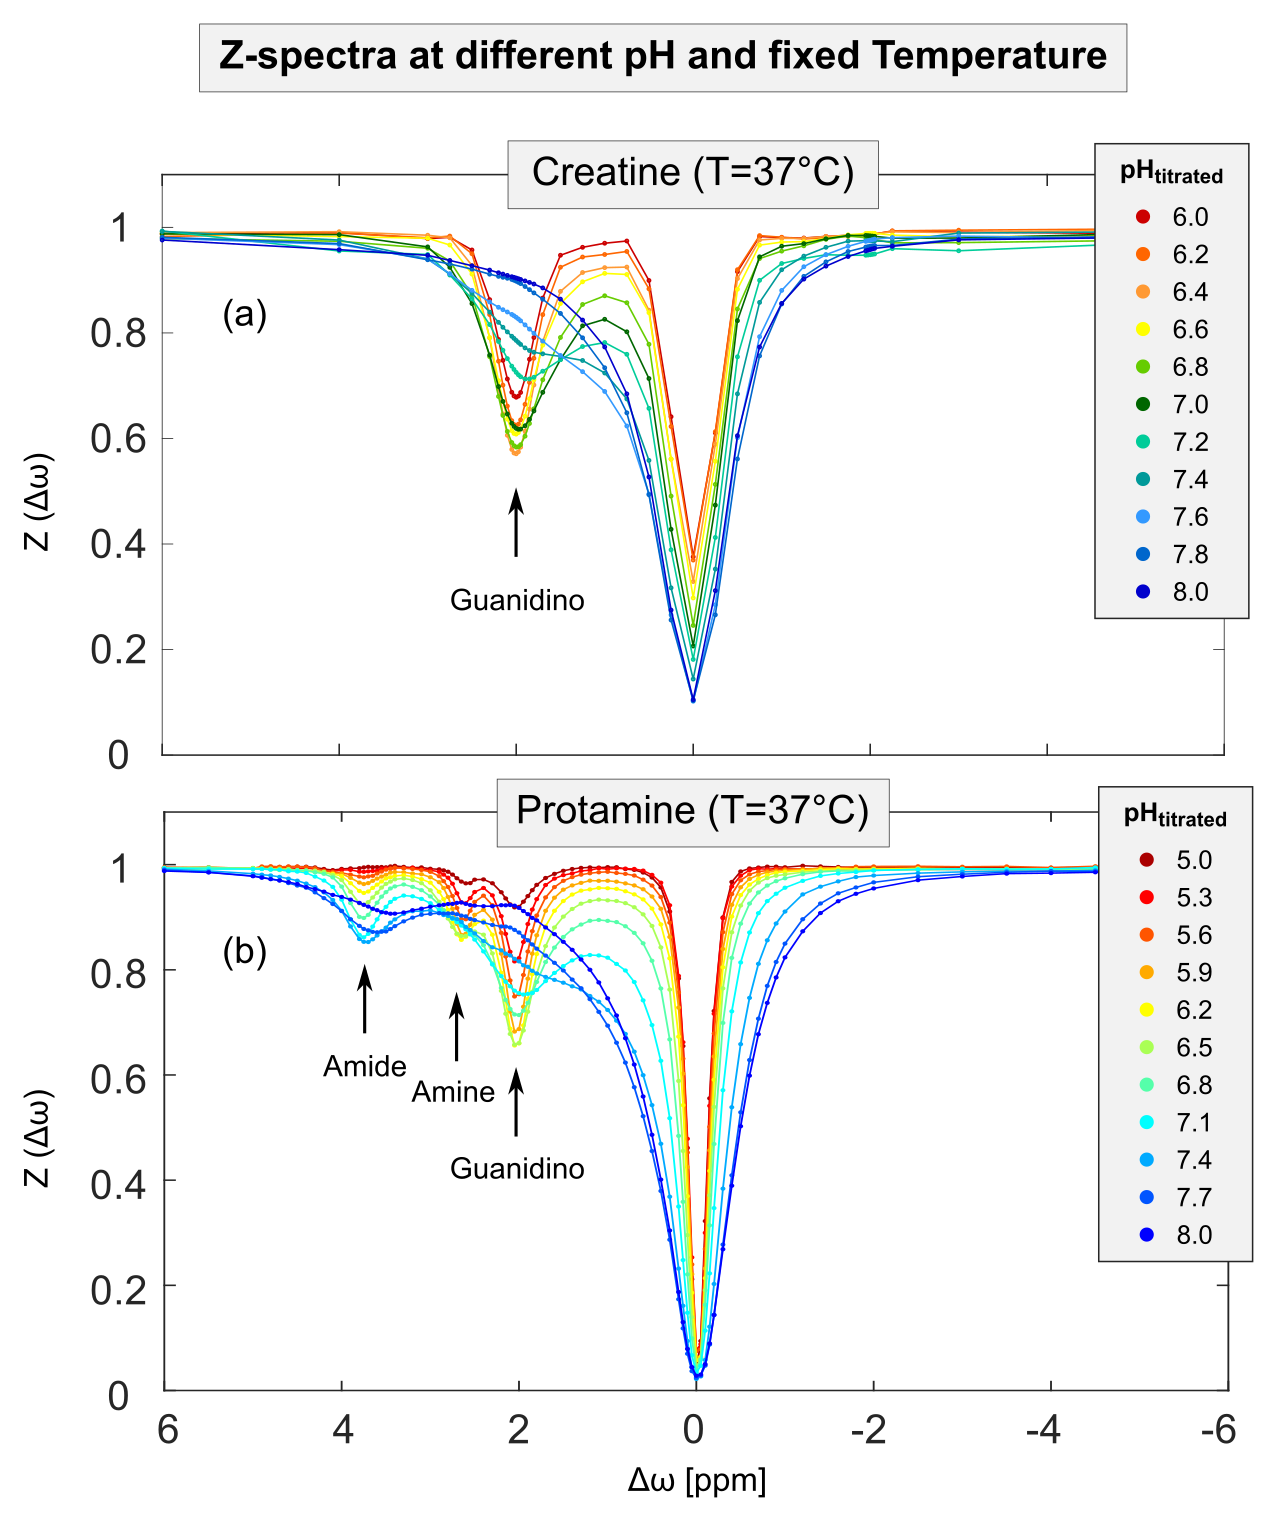
Figure 1: Measured ROI-averaged Z-spectra of creatine (a) and protamine (b) model solutions at a fixed temperature of T=37 °C and B1=1.0 µT show a strong dependency on pH (different colors). For both model solutions, the quality of the acquired Z-spectra was sufficient to reliably extract the isolated CEST signal (MTRRex) for all proton species across the whole range of utilized pH values (cf. Figure 3). Note the different pH ranges for creatine (a) and protamine (b). Note, the apparent residual water signal at Δωwater=0 ppm (a) is due to sparse sampling of data points around Δωwater.
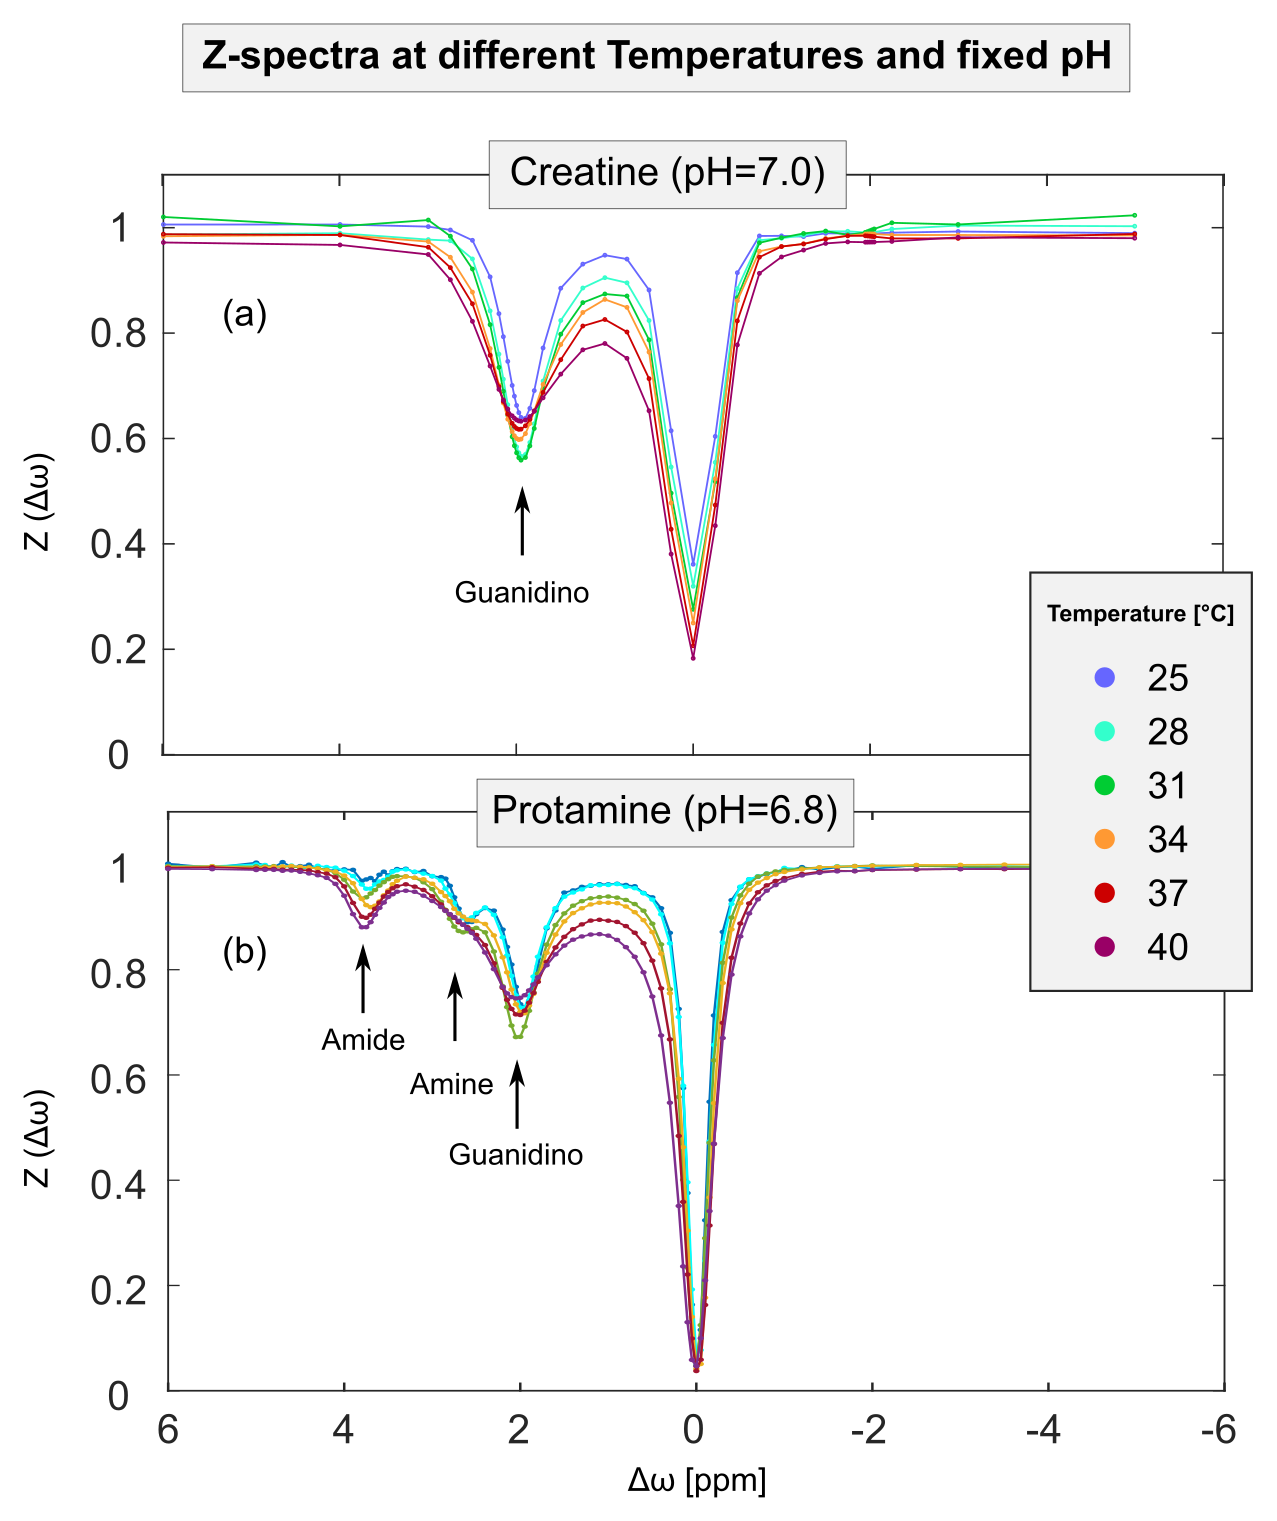
Figure 2: Measured ROI-averaged Z-spectra of creatine (a, pH=7.0) and protamine (b, pH=6.8) model solutions at a fixed pH and B1=1.0 µT show a clear dependency on temperature (different colors). For both model solutions, the quality of the acquired Z-spectra was sufficient to reliably extract the isolated CEST signal (MTRRex) for all proton species across the whole range of utilized temperatures (cf. Figure 3). Note, the apparent residual water signal at Δωwater=0 ppm (a) is due to sparse sampling of data points around Δωwater.
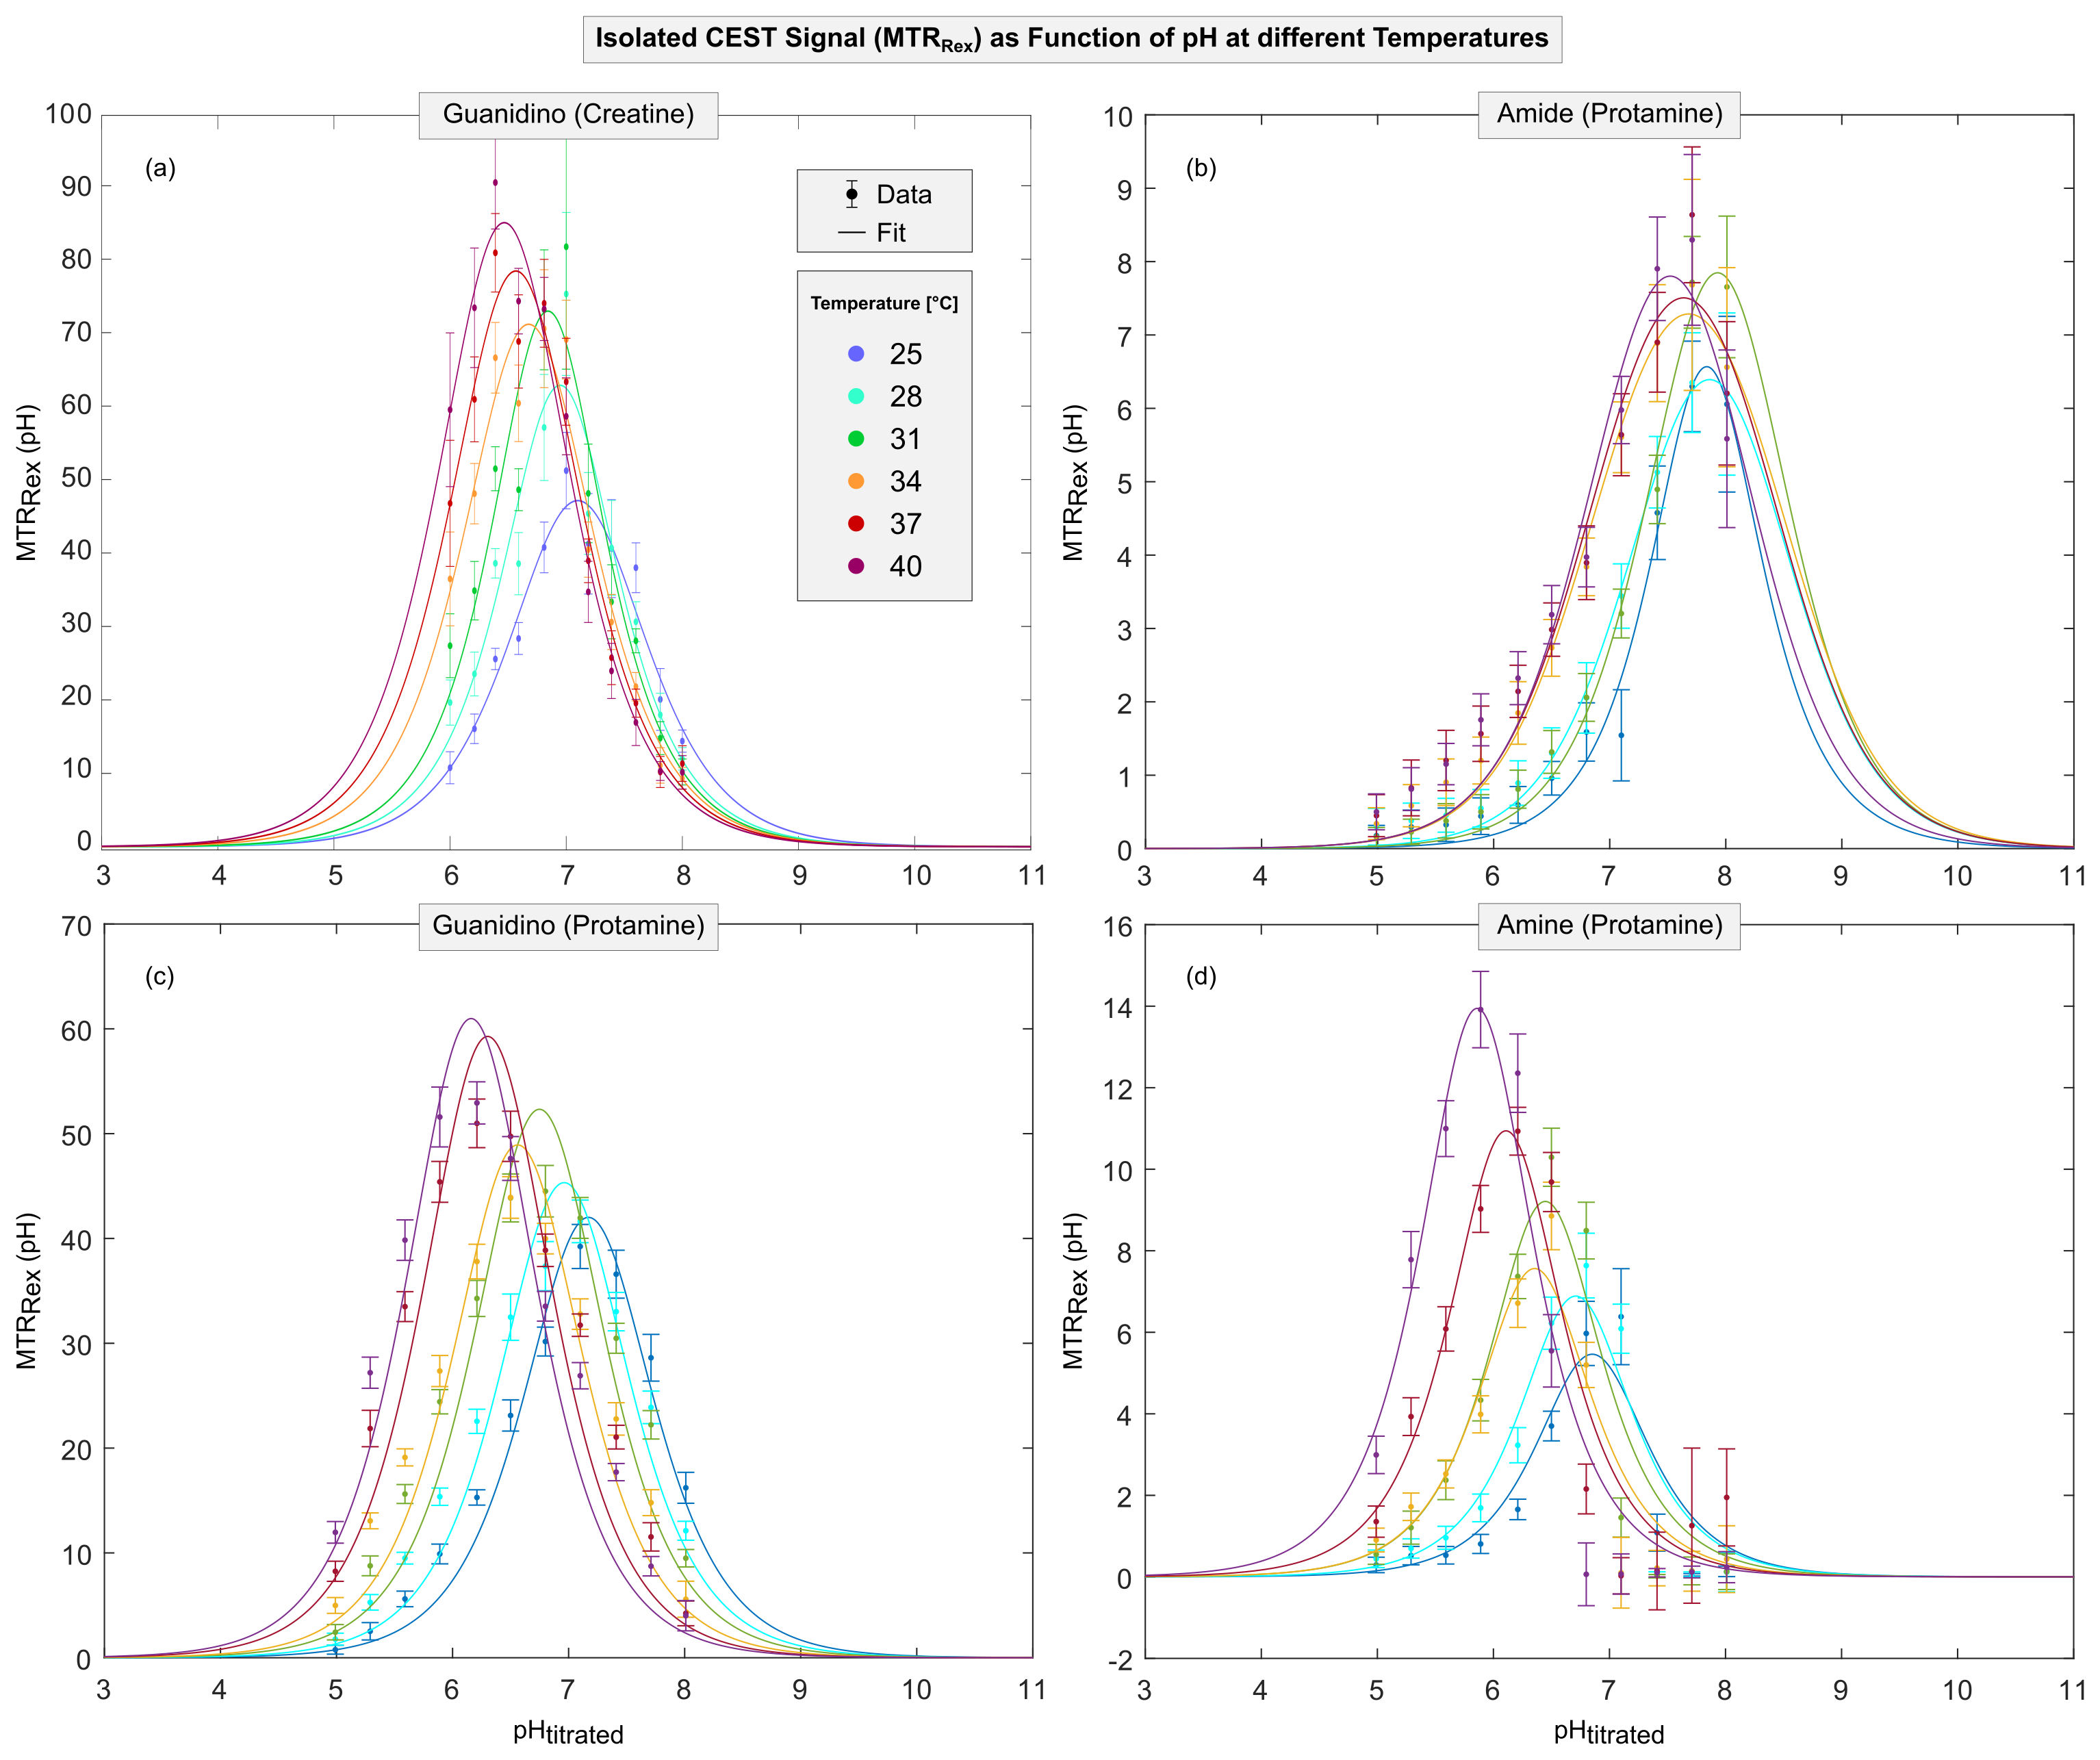
Figure 3: The isolated CEST signal (MTRRex) as a function of pH at different temperatures (colors) for B1=1.0 µT shown for guanidino protons of creatine (a) and amide, guanidino and amine protons of protamine model solutions (b-d, respectively). For rising temperatures (i.e., higher exchange rates kex), the position of the maximum CEST signal (pHmax) shifts towards lower pH values. For each temperature, pHmax via (Eq. 3) enables calculation of kc (data points in Figure 4). Note the different scaling of the MTRRex axes. All values are mean ROI values ± SD.
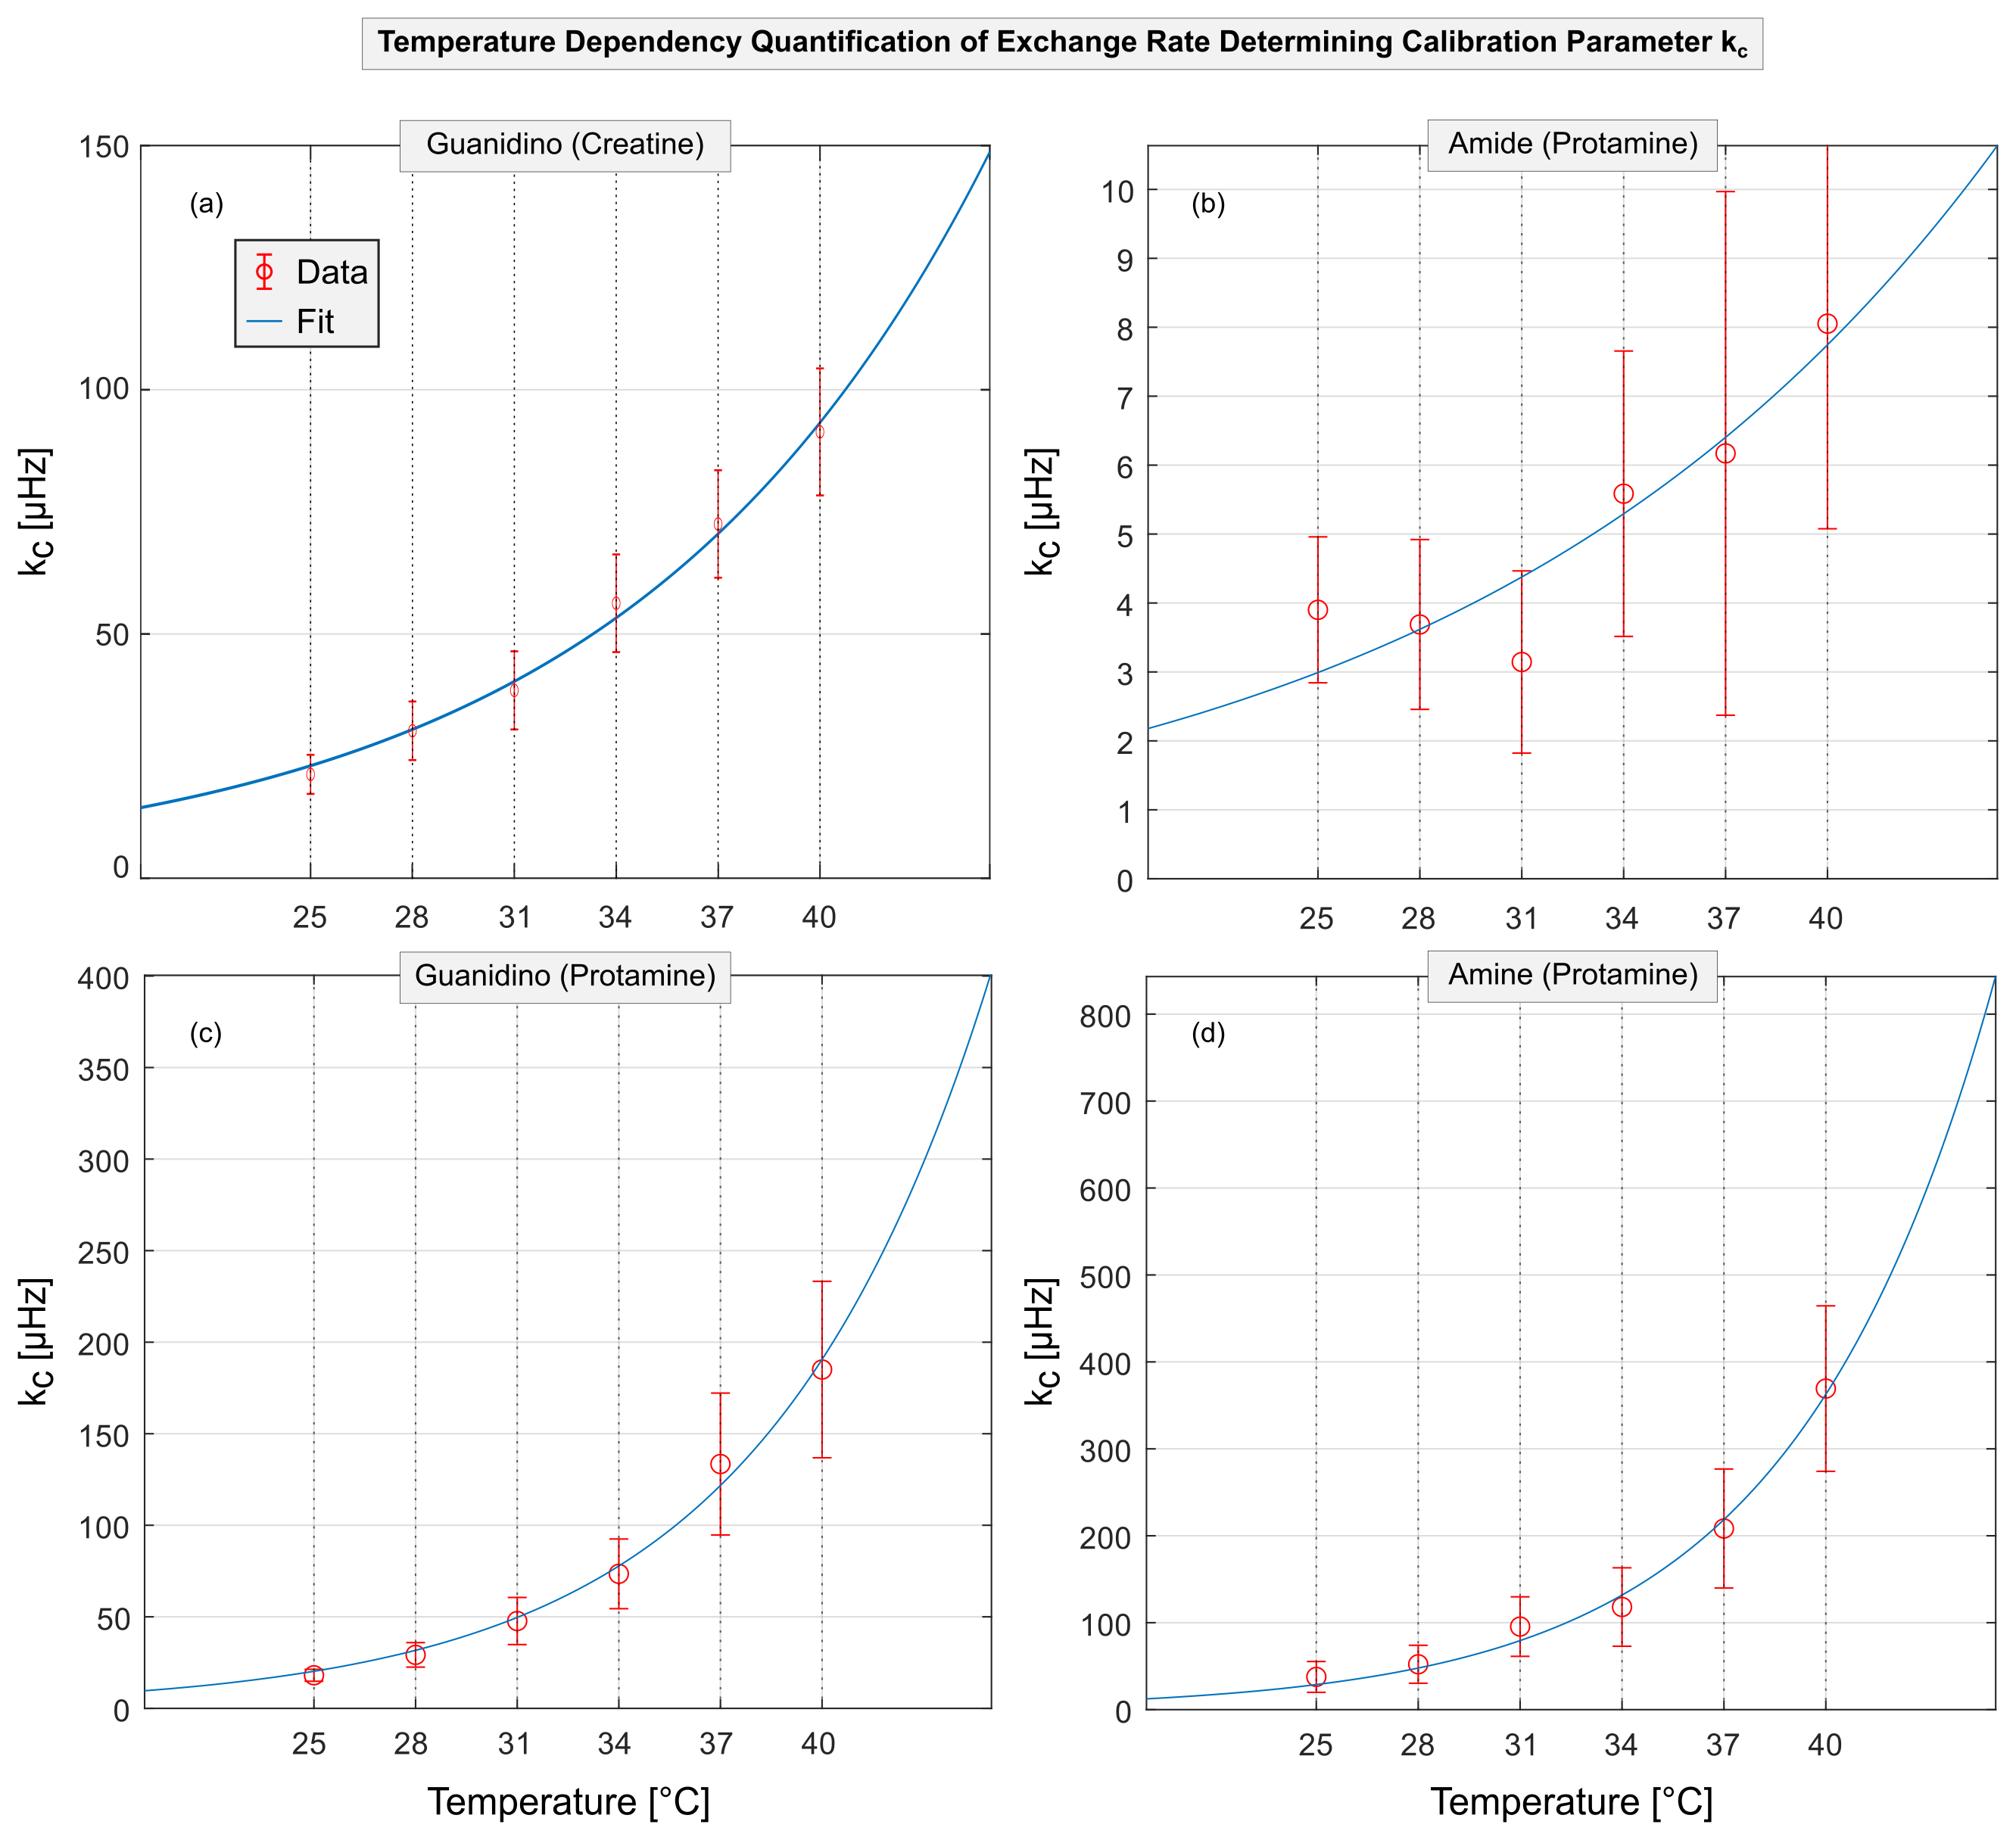
Figure 4: Quantification of the dependency on temperature of the proton exchange rate determining calibration parameter kc. The measured kc at various temperatures (data points) are shown for guanidino protons of creatine (a) and amide, guanidino and amine protons of protamine model solutions (b-d, respectively). In accordance with theory (Eq.1), exponential temperature dependencies were found for kc(T) (fits) yielding distinct values of kc,37 and Tdouble (specific values are provided in Table 1). Error bars are obtained from the 95% confidence interval of the fits in Figure 3.
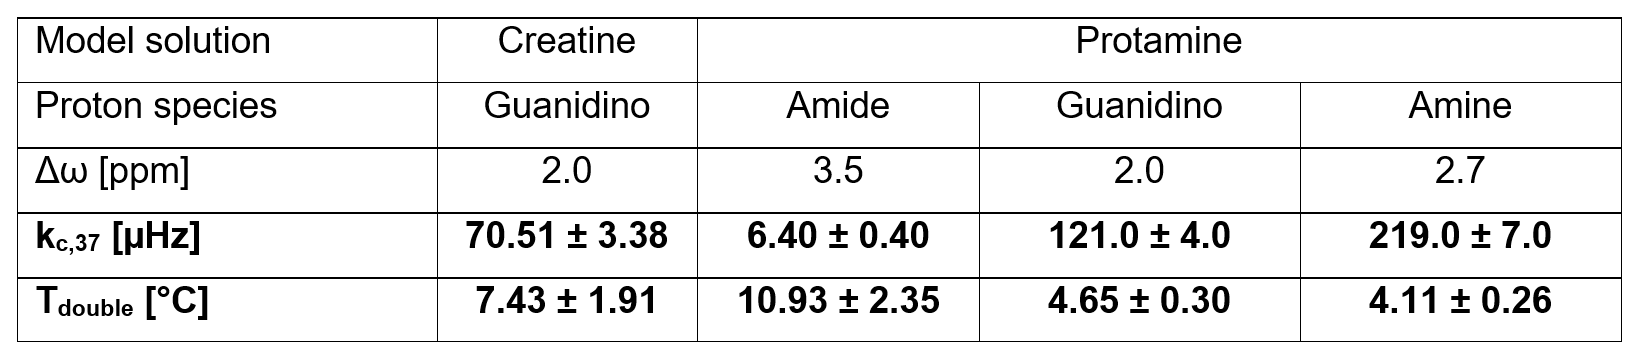
Table 1: Experimentally determined values of kc at T=37°C (kc,37) and the temperature increase for which the value of kc(T) doubles (Tdouble). Interestingly, each proton species exhibits distinct, characteristic kc,37 and Tdouble. Errors are obtained from the 95% confidence interval of the fits in Figure 4.