4454
A generalized QUCESOP method with evaluating CEST peak overlap1Public Health Science and Engineering College,Tianjin University of Traditional Chinese Medicine, Tianjin, China, 2MR Research China, GEHealthcare, Beijing, China, 3Center for Biomedical Imaging Research, School of Medicine, Tsinghua University, Beijing, China, 4Center for MRI Research, Academy for Advanced Interdisciplinary Studies, Peking University, Beijing, China
Synopsis
Keywords: CEST / APT / NOE, CEST & MT
Motivation: When quantifying the CE-parameters (fb, kb and R2b) of the specific CEST solute with existence of other unknown solutes, the peak overlap condition needs to be assessed to evaluate the reliability of the quantification result.
Goal(s): To develop a method for CE-parameters quantification and peak overlap assessment.
Approach: CEST data was acquired with various saturation offsets and powers. When fitting the targeted CE-parameters, the peak overlap was evaluated using RMSE between the trajectories of the acquired and synthesized data. Simulation and experiments were taken to test the performance.
Results: The feasibility of the approach in CE-parameters quantification and peak overlap assessment was verified.
Impact: The proposed method would be helpful for evaluating the reliability of the empirically set model for CE-parameters quantification, and then that of the quantification result.
Purpose
A key challenge in CE-parameters (fractional concentration fb, exchange rate kb and transversal relaxation rate R2b) quantification approaches is the occurrence of CEST peak overlap. This means the CEST signal representing targeted solute may be crucially interfered by unknown CEST solutes with adjacent resonance frequencies. The interference can lead to biased quantification results. In current quantification approaches, the signal from the unknown solutes is neglected (e.g. QUESP1 and ANN-CEST2) or linearly approximated (e.g. QUCESOP3) in the model setup. However, it remains uncertain whether severe peak overlap happens, if the model used is appropriate, and whether the quantification result is reliable. In this work, we proposed a generalized QUCESOP(gQUCESOP) method with the peak overlap evaluation by comparing the root mean squared error(RMSE) calculated by the fitting algorithm with that estimated using the noise ratio.Theory
CEST data is acquired using continuous-wave saturation pulse with various saturation offset Δω and amplitude B1, resulting in a matrix of Z-values $$$\tilde{Z}\left(\Delta\omega_{i},B_{1j}\right)$$$ (i=1,2,…m, and j=1,2,…n). Following the QUCESOP method3, once calculating the corresponding $$$\widetilde{R_{1\rho}}\left(\Delta\omega_{i},B_{1j}\right)$$$ using the $$$R_{1\rho}$$$ relaxation model, a linear approximation is introduced:$$R_{1\rho}\left(\Delta\omega_{i},B_{1j}\right)=R_{1\rho}^{water}\left(\Delta\omega_{i},B_{1j}\right)+R_{ex}\left(\Delta\omega_{i},B_{1j}\right)+q_{1j}\Delta\omega_{i}+q_{2j}$$
Then $$$\widetilde{R_{1\rho}}\left(\Delta\omega_{i},B_{1j}\right)$$$ can be fitted to obtain the unknown parameters. Root-mean-square error (RMSE) would be obtained with the acquired $$$\widetilde{R_{1\rho}}\left(\Delta\omega_{i},B_{1j}\right)$$$ and the synthesized $$$\widehat{R_{1\rho}}\left(\Delta\omega_{i},B_{1j}\right)$$$ values calculated using the fitted parameters:
$$RMSE=\sqrt{\{\sum_{i=1}^{m}\sum_{j=1}^{n}[{\delta}R_{1\rho}(\Delta\omega_{i},B_{1j})]^{2}\}/(mn)}$$
where $$$\delta R_{1\rho}(\Delta\omega_{i},B_{1j})=\widetilde{R_{1\rho}}\left(\Delta\omega_{i},B_{1j}\right)-\widehat{R_{1\rho}}\left(\Delta\omega_{i},B_{1j}\right)$$$. If the standard deviation of the δZ (measurement error of each Z-value) distribution, σZ, has been estimated, each standard deviation of $$${\delta}{R_{1\rho}}\left(\Delta\omega_{i},B_{1j}\right)$$$, $$${\sigma}_{R_{1\rho},i,j}$$$, could be calculated according to the $$$R_{1\rho}$$$ relaxation model. $$$[{\delta}{R_{1\rho}}\left(\Delta\omega_{i},B_{1j}\right)]^{2}$$$ follows a chi-square distribution with a mean of $$${\sigma}_{R_{1\rho},i,j}^{2}$$$ and a variance of $$$2{\sigma}_{R_{1\rho},i,j}^{4}$$$. In addition, each $$$[{\delta}{R_{1\rho}}\left(\Delta\omega_{i},B_{1j}\right)]^{2}$$$ in independent. If the model for fitting is accurate, the RMSE should have a mean value (RMSEref) and a standard deviation (ΔRMSEref) as:
$$RMSE_{ref}=\sqrt{\{\sum_{i=1}^{m}\sum_{j=1}^{n}{\sigma}_{R_{1\rho},i,j}^{2}\}/(mn)}$$
$${\Delta}RMSE_{ref}=\sqrt{\sum_{i=1}^{m}\sum_{j=1}^{n}(2{\sigma}_{R_{1\rho},i,j}^{4})}/[2\sqrt{mn\times{\sigma}_{R_{1\rho},i,j}^{2}}]$$
Therefore, a t-test could be conducted to compare the RMSE and RMSEref±ΔRMSEref. If the RMSE is statistically greater than RMSEref, it indicates potential illlness with the model, suggesting a significant CEST peak overlap and unreliable fitted results.
Method
In the simulation, a targeted solute with δωb=2.65ppm, fb=0.0005, kb=200s-1 and R2b=50s-1 was set. Additionally, a ghost solute with various fg, kg, R2g and offset δωg was added. Assuming B0=9.4T, T1=2.0s, T2=0.2s and σZ=0.003. Z-values were generated with Δω between 2.3-3.0ppm, B1 between 0.4-1.6μT, saturation time of 1.5s and TR=2.0s and then used to fit the CE-parameters. Moreover, RMSE was calculated to assess its potential for indicating peak overlap.In phantom experiment, two phantoms containing “phosphocreatine(PCr) +creatine” and “PCr+ATP” with pH=7.4 were prepared. Peak of the PCr at +2.65ppm or +1.95ppm was treated as the targeted solute. In the in vivo experiment, the PCr peak at +2.65ppm from rats’ skeletal muscles was also quantified. CEST images were acquired with SE-EPI sequnce. Each image was scanned multiple times for averaging and σZ evaluation. The scan parameters and fitting algorithm were nearly identical to those used in simulation, while for the PCr peak at +1.95ppm, Δω values varied between 1.7 to 2.2ppm. Considering the kb range of the PCr peak, the upper bound was set to 400s-1 in the fitting algorithm. Methods for B0, B1, T1 and T2 maps were consistent with those in our previous report3.
Result and Discussion
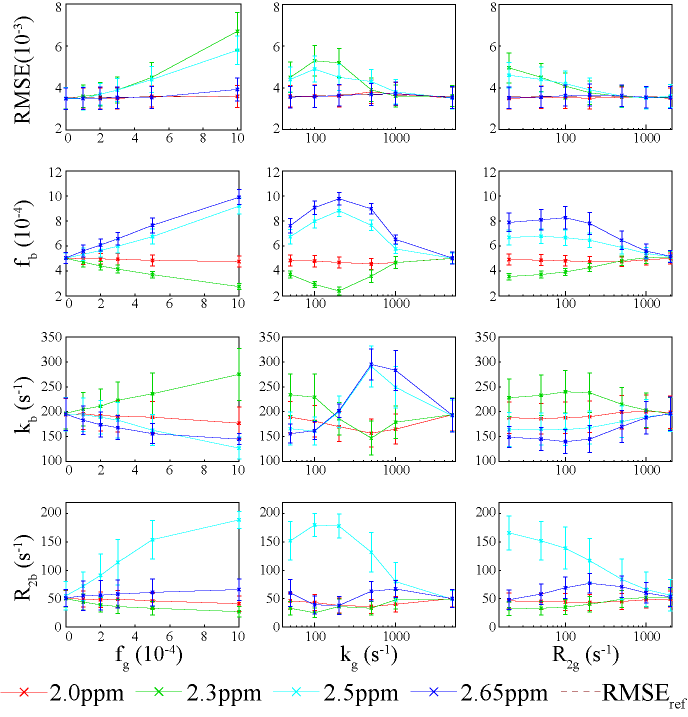
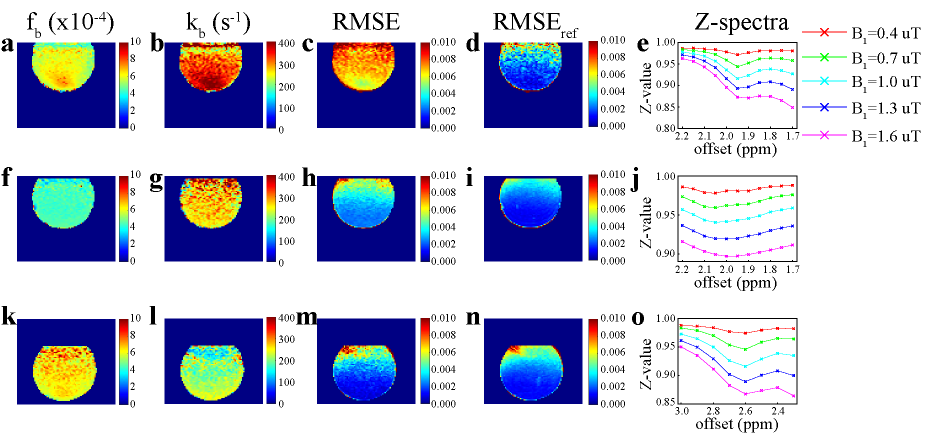
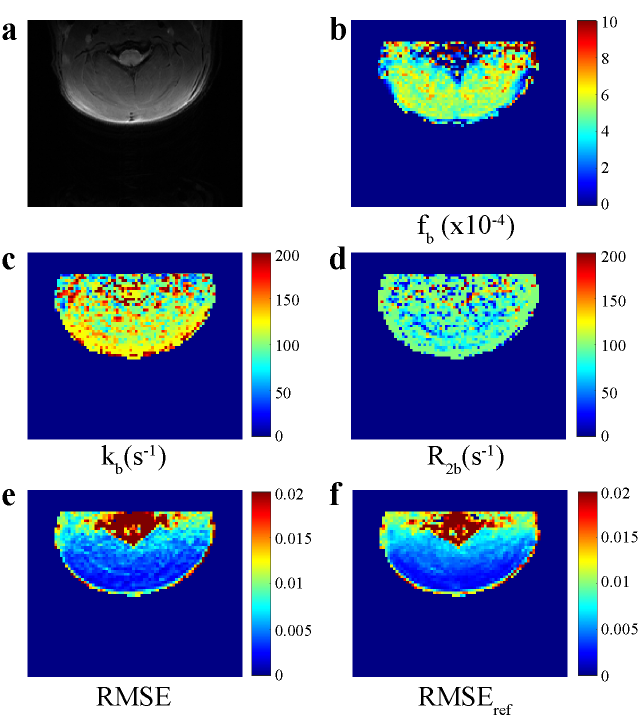
Simulation demonstrated that RMSE is an effective indicator of both peak overlap and the reliability of the fitting results(Fig. 1). With δωg is distant from δωb, RMSE is nearly identical to RMSEref. It agrees with the mild peak overlap and accurate fitted CE-parameters. When δωg is close to δωb, RMSE increases significantly that indicating a severe peak overlap, and fitted CE-parameters exhibit substantial bias. Nevertheless, RMSE fails to distinguish two peaks with an identical offset and similar kb and R2b values; “summed” fb and “averaged” kb would be likely obtained in this situation.Creatine(+1.95ppm) and APT(+2.10ppm) are known to significantly overlap to the PCr peak at +1.95ppm, but have minimal impact on the signal of the PCr peak at +2.65ppm. Therefore, as indicated by RMSE/RMSEref, CE-parameters of the PCr peak at +2.65ppm are accurate, but those of the PCr peak at +1.95 ppm are biased(Fig. 2). In the skeletal muscle tissue, the RMSE/RMSEref of the PCr signal validate the reliability of the fitted CE parameters. The quantification result of PCr(+2.65ppm) aligns with the finding of previous reports2,3(Fig. 3).
Conclusion
The gQUCESOP method could evaluate the peak overlap condition of the targeted CEST solute and quantify the corresponding CE-parameters. This method would be beneficial for assessing the reliability of the CE parameter quantification results in scenarios with potential disturbance from other uninterested CEST solutes, especially in the in vivo conditions.Acknowledgements
This work was supported by the New Teachers’ Research Program of Tianjin University of Traditional Chinese Medicine (XJS2022116), Tianjin Municipal Education Commission Scientific Research Program (2022KJ162), National Key R&D Program of China 2022YFC3602500, 2022YFC3602503 and National Natural Science Foundation of China (NSFC) (Nos. 82071914). The authors thank the National Center for Protein Sciences at Peking University in Beijing, China, for assistance with the MRI data acquisition and data analyses.References
1. Michael T. McMahon, Assaf A. Gilad, Jinyuan Zhou et al. Quantifying exchange rates in chemical exchange saturation transfer agents using the saturation time and saturation power dependencies of the magnetization transfer effect on the magnetic resonance imaging signal (QUEST and QUESP): pH correction for poly-L-lysine and a starburst dendrimer. Mag. Reson. Med 2006; 55:836-847.
2. Lin Chen, Michael Schär, Kannie W. Y. Chan et al. In vivo imaging of phosphocreatine with artificial neural networks. Nat. Com. 2020; 11: 1-10.
3. Yi Wang, Pengyu Li, Jia-Hong Gao. Quantifying the fractional concentrations and exchange rates of small-linewidth CEST agents using the QUCESOP method under multi-solute conditions in MRI signals. Magn. Reson. Med. 2021; 85: 268-280.
Figures