4453
A Comparative Analysis of CEST Techniques for Mapping Muscle Creatine and Phosphocreatine at 3T1Johns Hopkins University, Baltimore, MD, United States, 2University of Maryland, Baltimore, MD, United States
Synopsis
Keywords: CEST / APT / NOE, CEST & MT
Motivation: Creatine and phosphocreatine metabolites imaging at 3T are essential for related disease in muscle.
Goal(s): Estimate creatine proton exchange rate in muscle; Simultaneous mapping of PCr and Cr by PLOF CEST method at 3T.
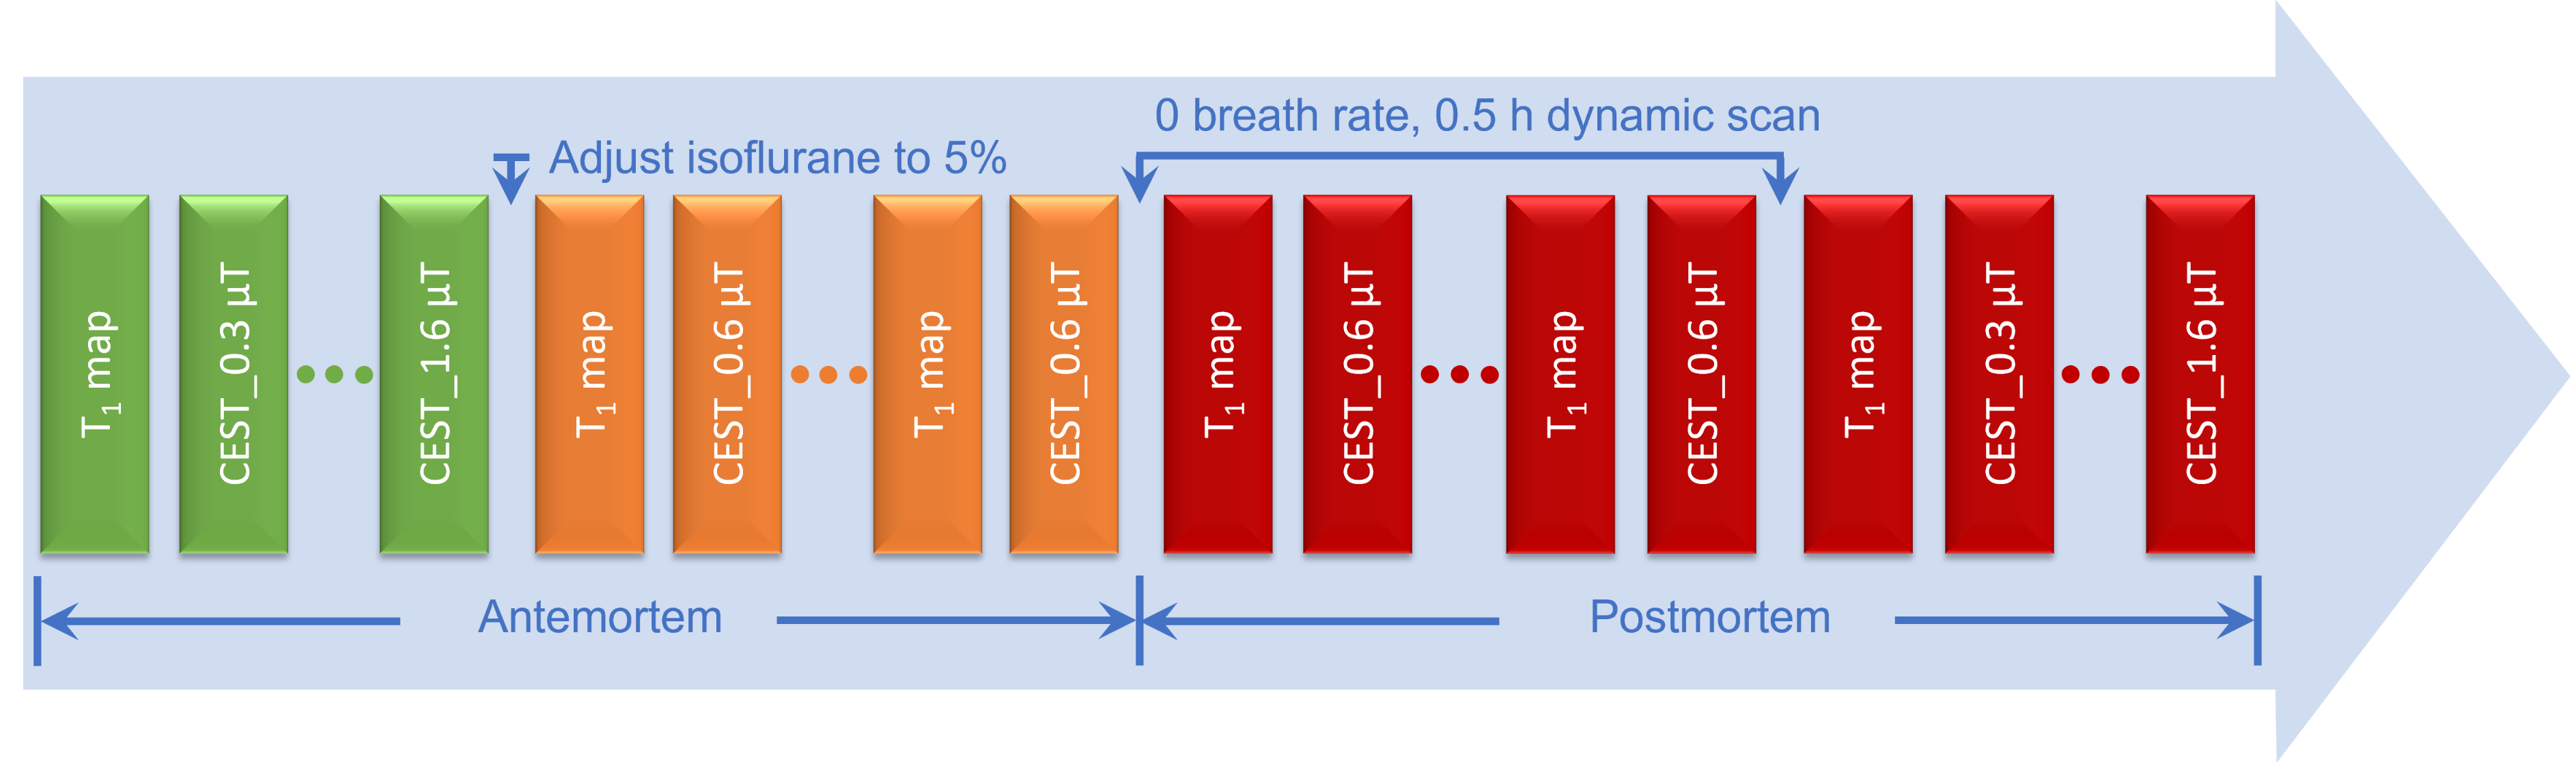
Approach: Antemortem and postmortem animal study was to validate PCr/Cr CEST peak position and creatine exchange rate. Three types of CEST acquisition methods were compared on human leg muscle.
Results: Z-spectra in mouse hindlimb before and after euthanasia indicated CrCEST is a slow-exchanging process (<150 s-1). This allowed us to simultaneously extract PCr/CrCEST signals and mapping in muscle at 3T using the PLOF method on both human and animal.
Impact: Amide, Cr, and PCr CEST in the skeletal muscle can be mapped simultaneously at 3T by PLOF CEST within a clinically feasible acquisition duration, which has potential to assist in the diagnosis of related diseases.
INTRODUCTION
Phosphocreatine (PCr) is a compound that is synthesized from creatine (Cr) and adenosine triphosphate (ATP) in muscle cells (1,2) via the creatine kinase reaction, serving as a reservoir of high-energy phosphate bonds which is particularly important for short-term, high-intensity activities (3). For decades, researchers have been exploring non-invasive methods to detect PCr or Cr using MRI. While phosphorus (31P) magnetic resonance spectroscopy (MRS) has proven to be specific method for assessing high-energy phosphates and mitochondrial impairment (4-12), it is not commonly used in clinical practice due to several practical challenges. The chemical exchange saturation transfer (CEST) method (13-18) has presented a novel prospect for the detection of low concentration Cr (19-23) and PCr (19,24-28) in tissues. However, a major challenge in this area is the extraction and quantification of PCr/CrCEST from the crowded in vivo Z-spectrum (29). Recently, a Polynomial and Lorentzian line-shape Fitting (PLOF) approach was proposed to suppress both DS and MTC/NOE and to extract Cr and PCr CEST signals with high specificity in both brain and muscle at high MRI fields (25,26,30,31). Due to its rapid exchange rate, CrCEST coalesces with water at 3T as observed in phantoms (19,24), which poses a significant challenge for the extraction of CrCEST at 3T. The objective of this investigation is to estimate the CrCEST exchange rate in muscle and to evaluate the feasibility of the PLOF CEST method for simultaneous mapping of PCr and Cr in mouse and human skeletal muscle at 3T.METHODS
Five adult wild-type mice were scanned on a 3T Bruker Biospec system equipped with a 40 mm quadrature volume resonator for both transmission and reception. A Philips Ingenia Elition 3.0 T and a dStream Flex M Coil were used for CEST human experiments, which include five healthy subjects. The FOV was set to 220 × 220 × 70 mm3, and a matrix size of 64 × 64 × 7 was used for image acquisition. Three fast 3D CEST techniques, pulsed-GRASE, ssEPI and pulsed-GRE, were compared.RESULTS
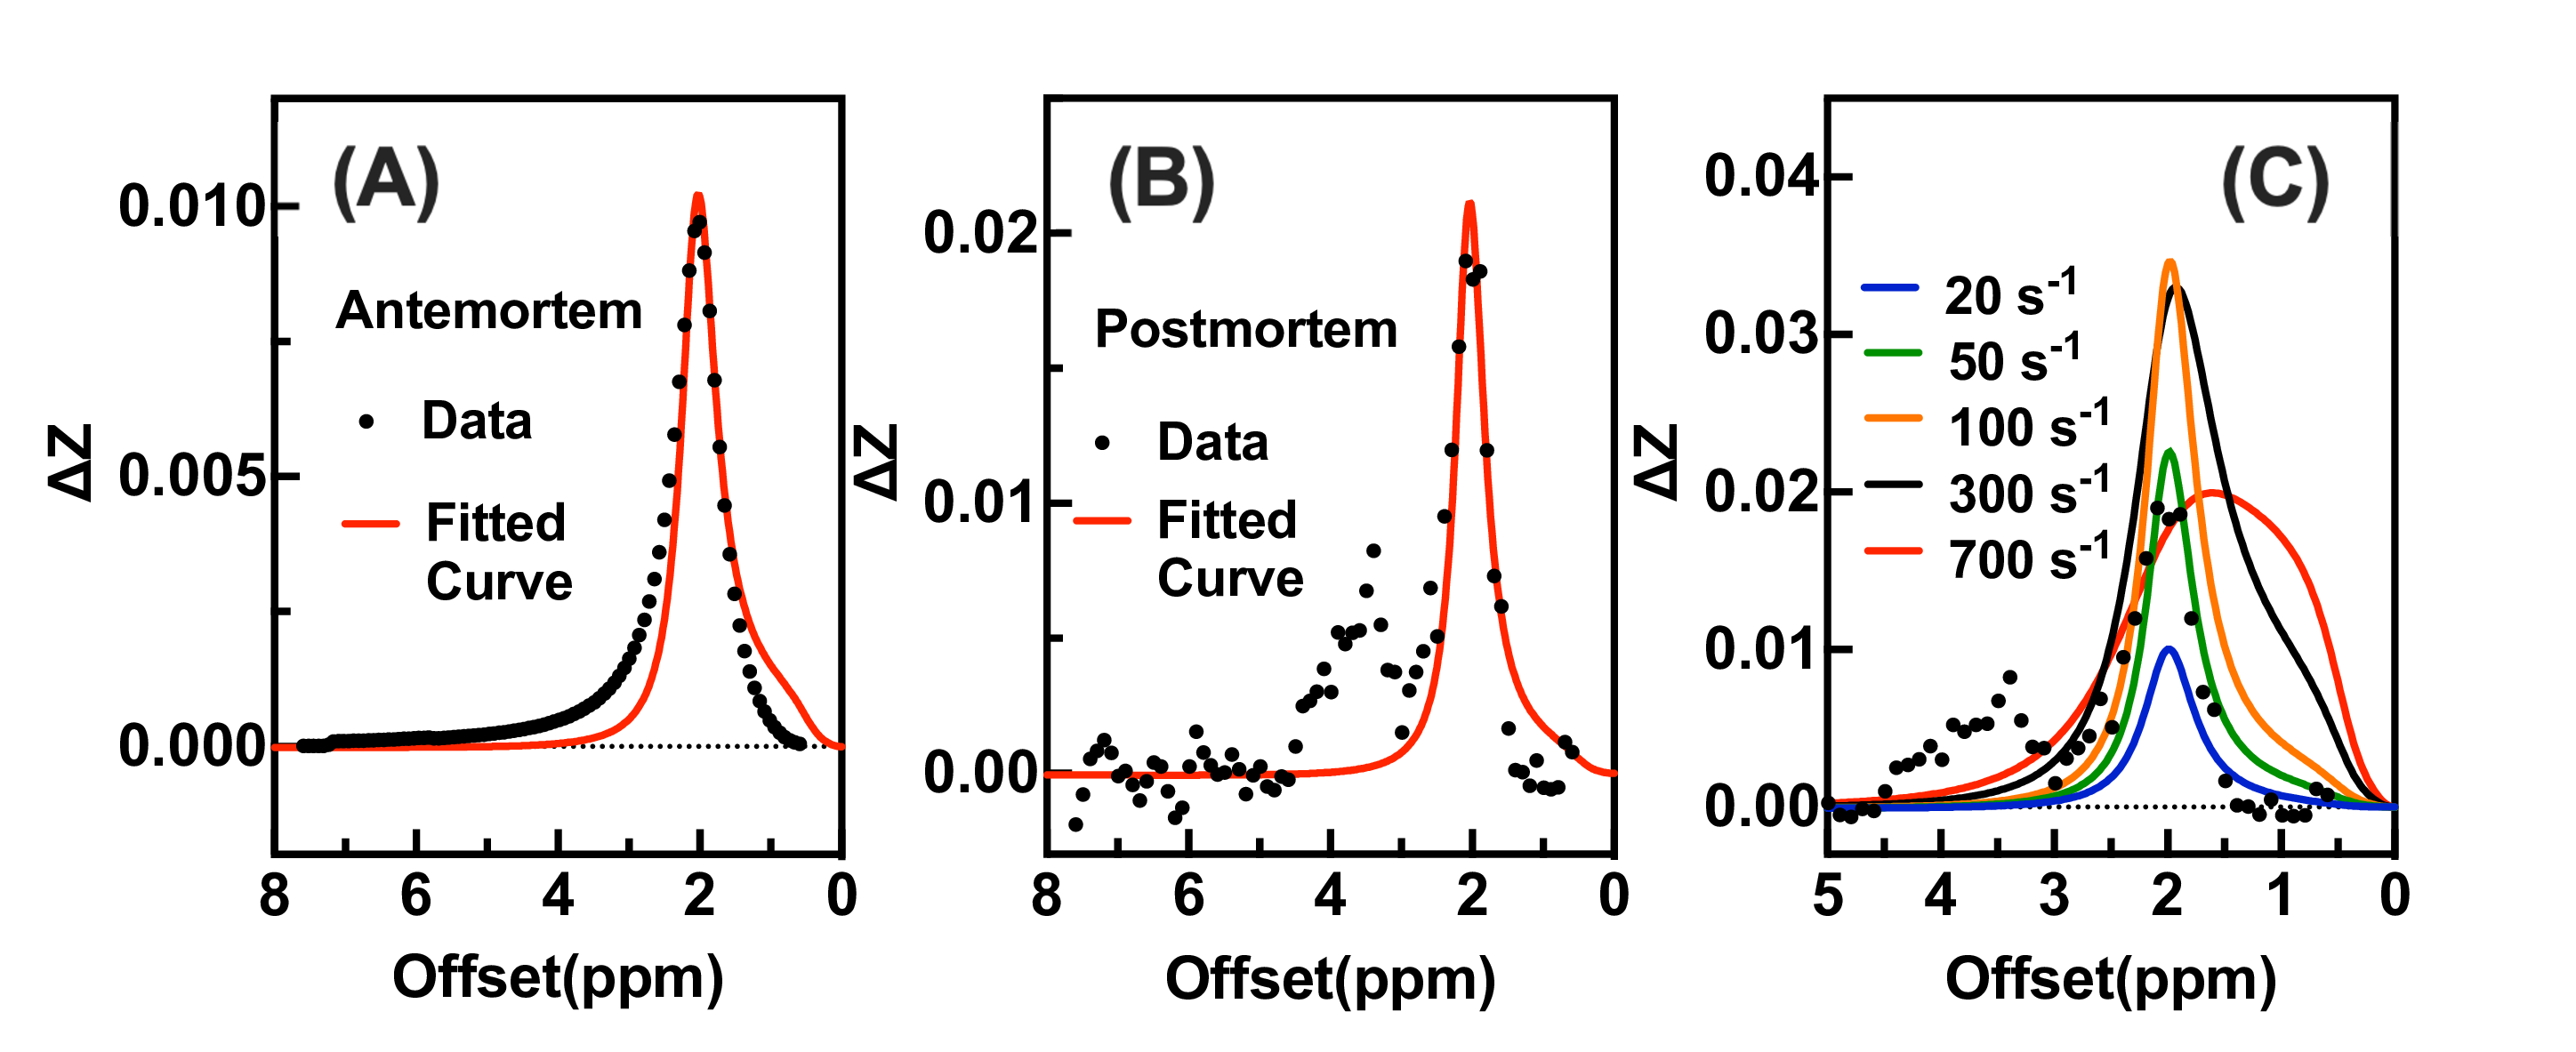
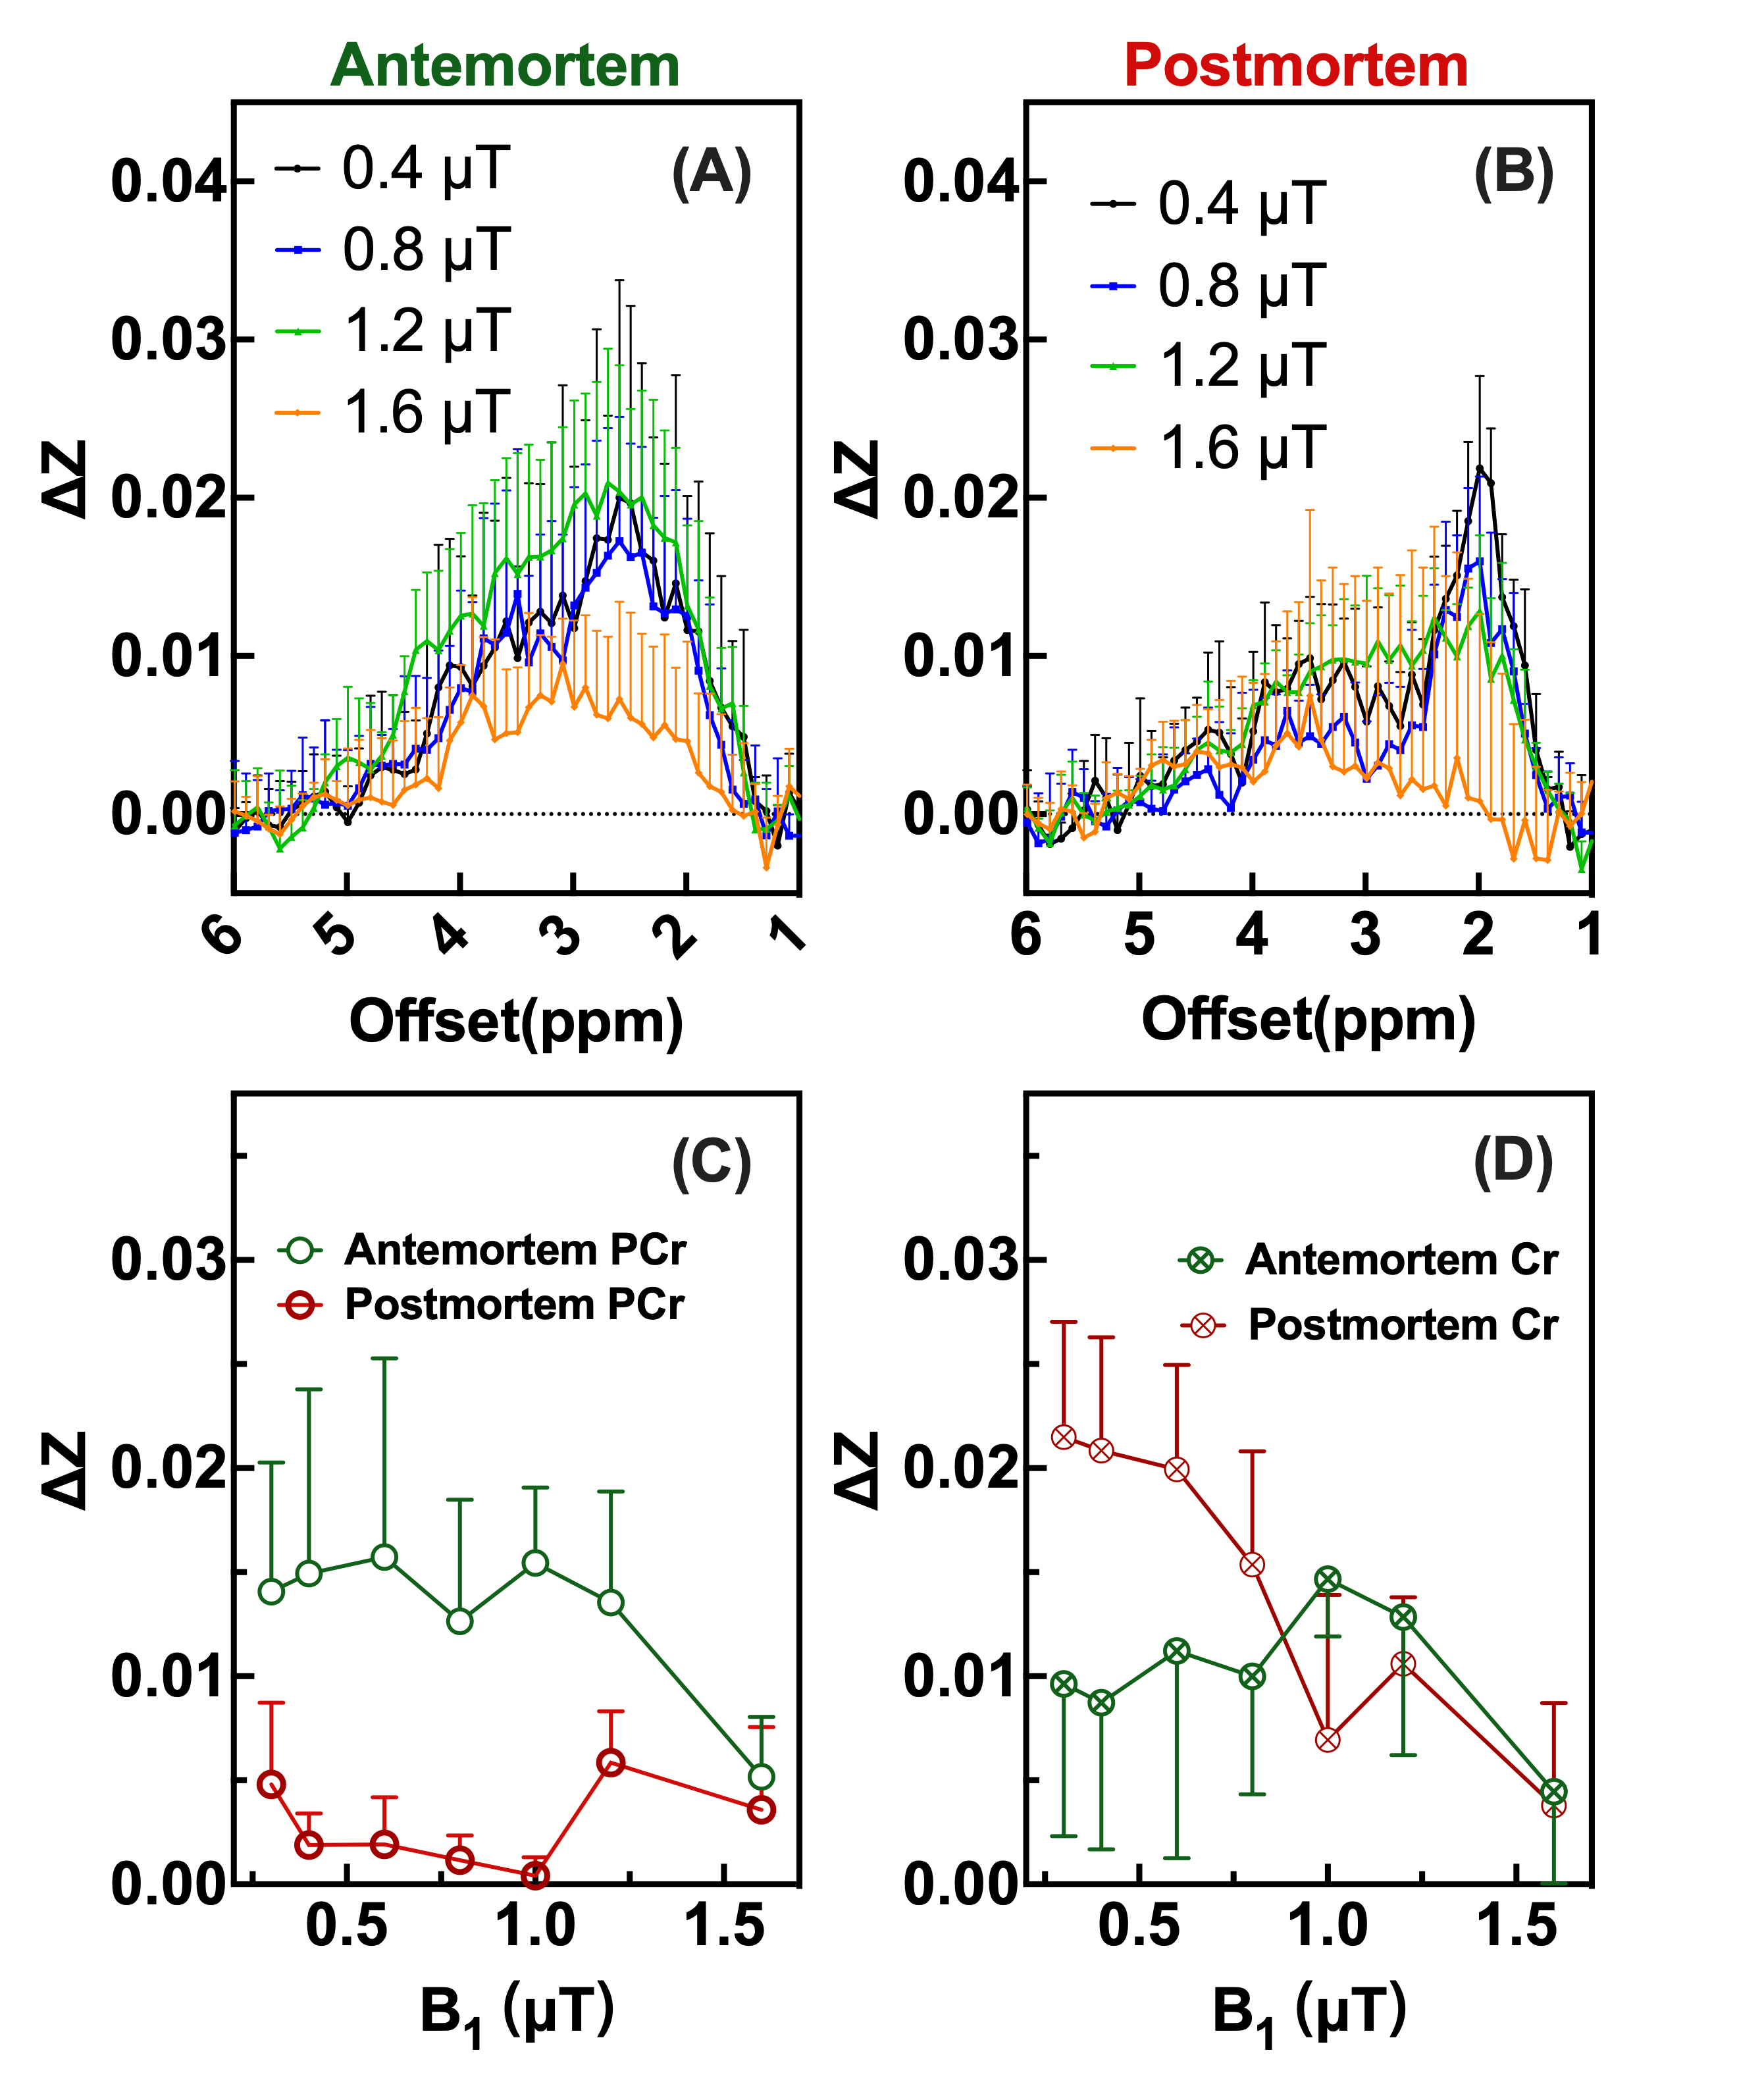
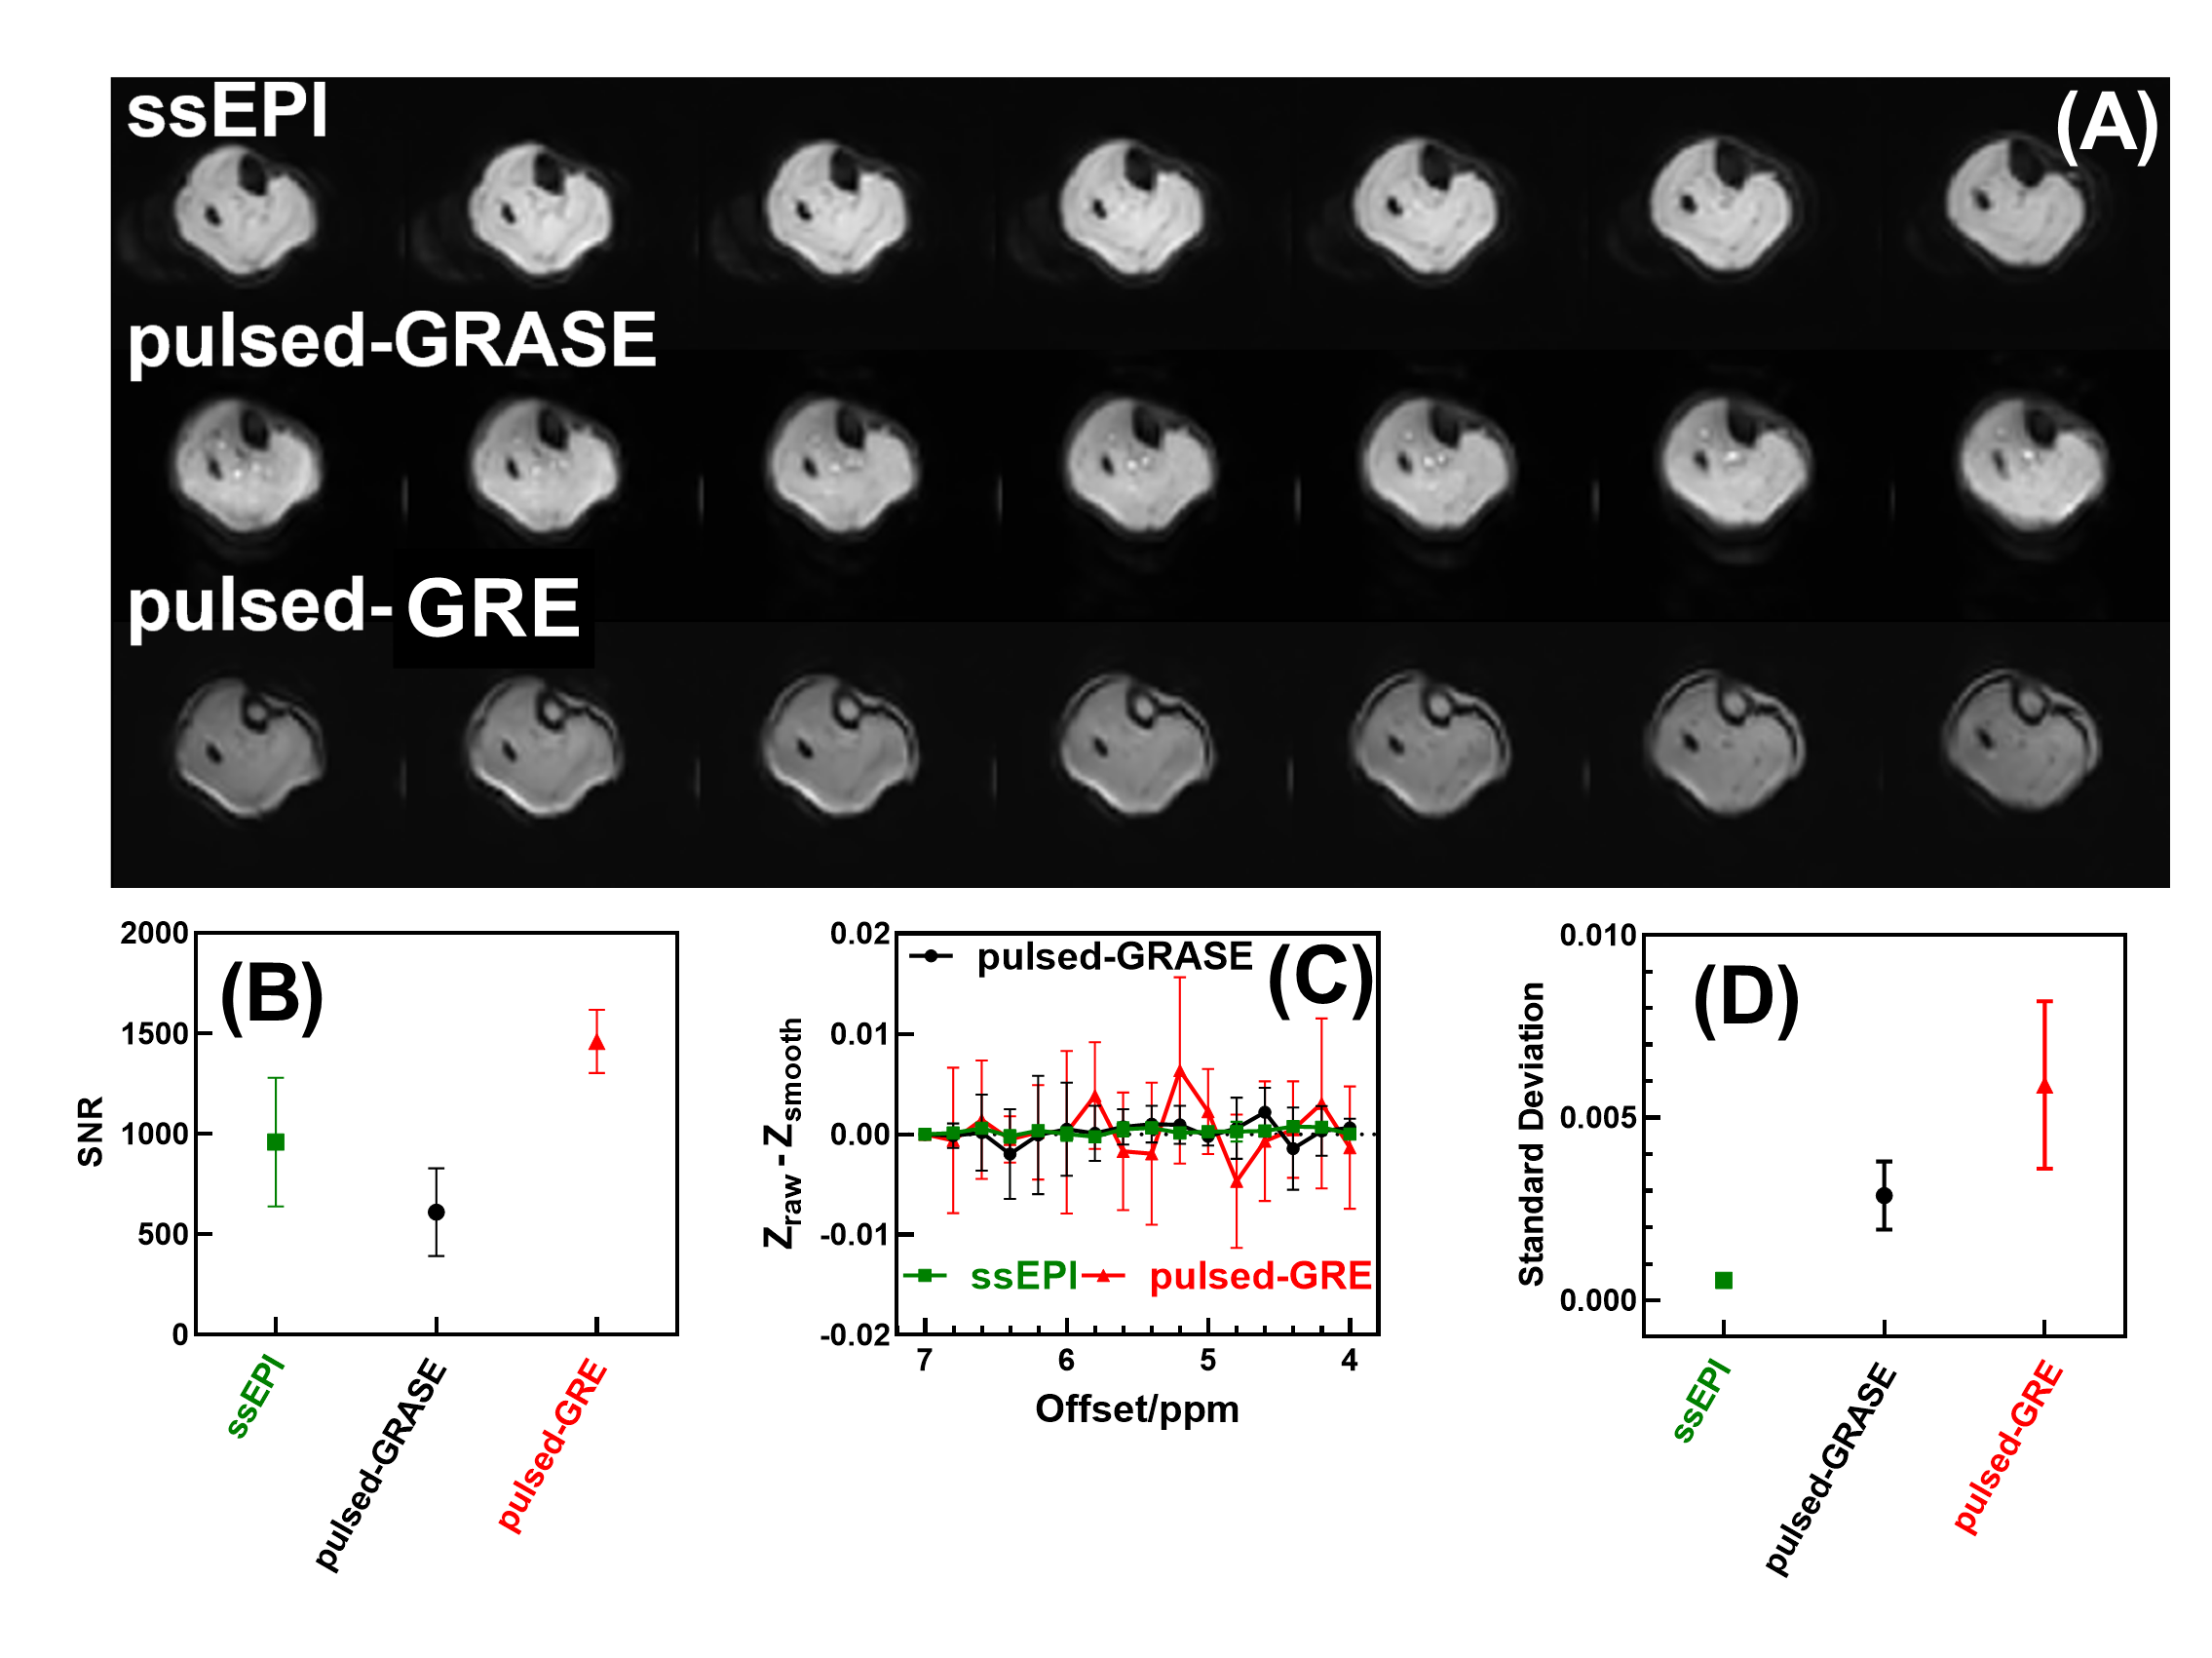
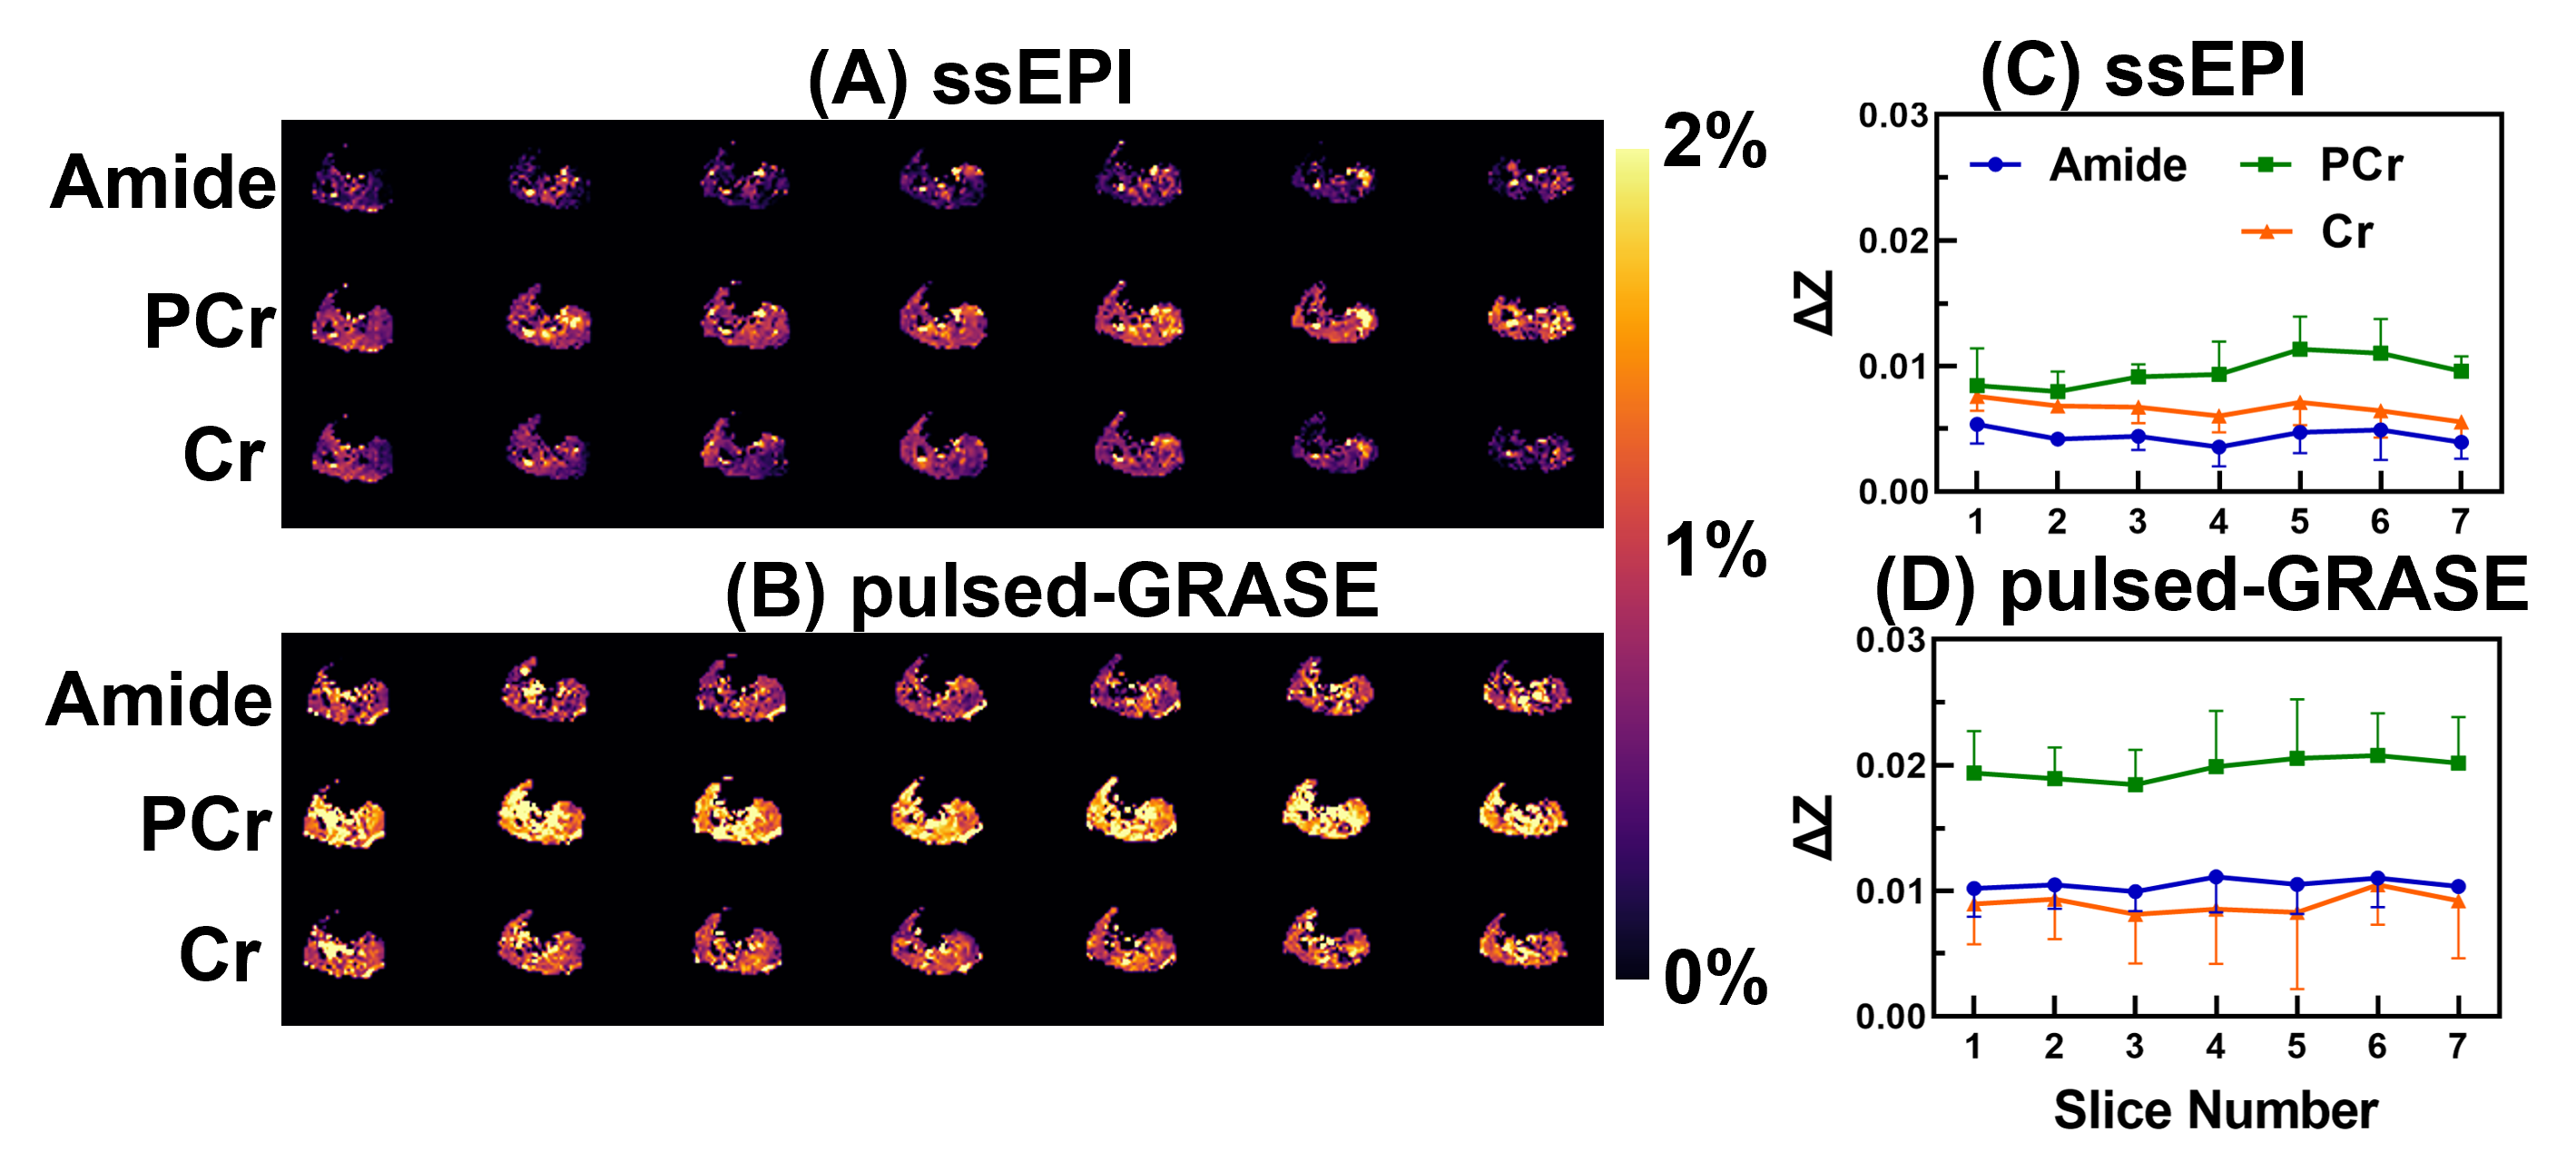
A comparison of the Z-spectra in mouse hindlimb before and after euthanasia (Fig. 1) indicated that CrCEST is a slow-exchanging process with exchange rate between 45.5 s-1 to 150.7 s-1 in muscle (Fig. 2). This allowed us to simultaneously extract and assign PCr/CrCEST signals at 3T using the PLOF method. We determined optimal B1 values ranging from 0.3-0.6 µT for CrCEST and 0.3-1.2 µT for PCrCEST (Fig. 3). For the comparative study on human calf muscle, pulsed-GRE method showed larger variations across the five studies compared to those of pulsed-GRASE and ssEPI methods (Fig. 4). Mean SNR values for ssEPI, pulsed-GRASE, and pulsed-GRE were 959, 611 and 1460, respectively. While the CEST signal standard deviation σCEST value for pulsed-GRE is much higher compared to ssEPI and pulsed-GRASE methods (p<0.01). Pulsed-GRASE method yields much higher CEST signals than the ssEPI method. Across all seven slices, the mean PCrCEST values were 2±0.09% and 1±0.12% for pulsed-GRASE and ssEPI, respectively, while amideCEST values were 1.1±0.04% for pulsed-GRASE and 0.4±0.06% for ssEPI. CrCEST values were also higher in pulsed-GRASE (0.9±0.08%) than in ssEPI (0.7±0.07%) as shown in Fig. 5.DISCUSSION
The breakdown of creatine phosphate into creatine and inorganic phosphate, which is catalyzed by creatine phosphatase, occurs after death (1,26,32-35). Therefore, the PCr to Cr conversion during postmortem provides a suitable method for validating PCr and Cr CEST at 3T (28). Due to the slow-exchanging rate of CrCEST, the current study provides a three-peak PLOF method to simultaneously yield high-resolution amide, PCr and Cr maps at 3T. Our study demonstrates that the SNR of the pulsed-GRE method is actually higher than that of ssEPI and pulsed-GRASE on 3T clinical scanner. However, the major issue with pulsed-GRE is its high σCEST, which poses significant difficulty for reliably extracting CEST contrasts (Fig. 4). Therefore, we only performed amide, PCr and Cr CEST mapping with ssEPI and pulsed-GRASE in this study.CONCLUSION
Our study revealed that CrCEST displayed a noticeable peak at 2.0 ppm in the mouse hindlimb post-euthanasia at 3T, indicating that it is a slow-exchanging process in muscle. Furthermore, we used the proposed PLOF method on human muscle at 3T to obtain high-resolution maps of amide, PCr, and Cr simultaneously. Comparison of several fast 3D CEST approaches indicated that the pulsed-GRASE method provides high PCr/Cr CEST values compared to the ssEPI method, while the noise background in the Z-spectra by ssEPI is much lower than pulsed-GRASE. These findings suggest that PCr/CrCEST has the potential to be a cost-effective and widely available method for measuring PCr/Cr in muscle at 3T.Acknowledgements
This work was supported by P41EB031771, R01HL149742, R01AG080104, R01HL63030, R01AG063661 and R21AG074978. The authors thank Dr. Abubakr Eldirdiri, Mr. Joseph S. Gillen, Mrs. Terri Lee Brawner, Ms. Kathleen A. Kahl, and Ms. Ivana Kusevic for experimental assistance.References
1. Wyss M, Kaddurah-daouk R. Creatine and Creatinine Metabolism. Physiol Rev 2000;80:1107.
2. Andres RH, Ducray AD, Schlattner U, Wallimann T, Widmer HR. Functions and effects of creatine in the central nervous system. Brain Res Bull 2008;76(4):329-343.
3. Schlattner U, Tokarska-Schlattner M, Wallimann T. Mitochondrial creatine kinase in human health and disease. Biochim Biophys Acta 2006;1762(2):164-180.
4. Hoult DI, Busby SJ, Gadian DG, Radda GK, Richards RE, Seeley PJ. Observation of tissue metabolites using 31P nuclear magnetic resonance. Nature 1974;252(5481):285-287.
5. Arnold DL, Matthews PM, Radda GK. Metabolic recovery after exercise and the assessment of mitochondrial function in vivo in human skeletal muscle by means of 31P NMR. Magn Reson Med 1984;1(3):307-315.
6. Kemp GJ, Taylor DJ, Thompson CH, Hands LJ, Rajagopalan B, Styles P, Radda GK. Quantitative analysis by 31P magnetic resonance spectroscopy of abnormal mitochondrial oxidation in skeletal muscle during recovery from exercise. NMR Biomed 1993;6(5):302-310.
7. Kemp GJ, Radda GK. Quantitative interpretation of bioenergetic data from 31P and 1H magnetic resonance spectroscopic studies of skeletal muscle: an analytical review. Magn Reson Q 1994;10(1):43-63.
8. Beer M, Seyfarth T, Sandstede J, Landschutz W, Lipke C, Kostler H, von Kienlin M, Harre K, Hahn D, Neubauer S. Absolute concentrations of high-energy phosphate metabolites in normal, hypertrophied, and failing human myocardium measured noninvasively with (31)P-SLOOP magnetic resonance spectroscopy. J Am Coll Cardiol 2002;40(7):1267-1274.
9. Kemp GJ, Meyerspeer M, Moser E. Absolute quantification of phosphorus metabolite concentrations in human muscle in vivo by 31P MRS: a quantitative review. NMR Biomed 2007;20(6):555-565.
10. Tonson A, Ratel S, Le Fur Y, Vilmen C, Cozzone PJ, Bendahan D. Muscle energetics changes throughout maturation: a quantitative 31P-MRS analysis. J Appl Physiol (1985) 2010;109(6):1769-1778.
11. Isbell DC, Berr SS, Toledano AY, Epstein FH, Meyer CH, Rogers WJ, Harthun NL, Hagspiel KD, Weltman A, Kramer CM. Delayed calf muscle phosphocreatine recovery after exercise identifies peripheral arterial disease. J Am Coll Cardiol 2006;47(11):2289-2295.
12. Prompers JJ, Jeneson JA, Drost MR, Oomens CC, Strijkers GJ, Nicolay K. Dynamic MRS and MRI of skeletal muscle function and biomechanics. NMR Biomed 2006;19(7):927-953.
13. Wolff S, Balaban R. NMR imaging of labile proton exchange. J Magn Reson 1990;86:164–169.
14. van Zijl PCM, Yadav NN. Chemical exchange saturation transfer (CEST): What is in a name and what isn't? Magn Reson Med 2011;65(4):927-948.
15. van Zijl PCM, Lam WW, Xu J, Knutsson L, Stanisz GJ. Magnetization Transfer Contrast and Chemical Exchange Saturation Transfer MRI. Features and analysis of the field-dependent saturation spectrum. Neuroimage 2017:10.1016/j.neuroimage.2017.1004.1045.
16. Liu G, Song X, Chan KW, McMahon MT. Nuts and bolts of chemical exchange saturation transfer MRI. NMR Biomed 2013;26(7):810-828.
17. Jones KM, Pollard AC, Pagel MD. Clinical applications of chemical exchange saturation transfer (CEST) MRI. J Magn Reson Imaging 2017:10.1002/jmri.25838.
18. van Zijl PCM, Sehgal AA. Proton Chemical Exchange Saturation Transfer (CEST) MRS and MRI. eMagRes 2016;5(2):1307-1332.
19. Haris M, Nanga RP, Singh A, Cai K, Kogan F, Hariharan H, Reddy R. Exchange rates of creatine kinase metabolites: feasibility of imaging creatine by chemical exchange saturation transfer MRI. NMR Biomed 2012;25(11):1305-1309.
20. Kogan F, Haris M, Singh A, Cai K, Debrosse C, Nanga RP, Hariharan H, Reddy R. Method for high-resolution imaging of creatine in vivo using chemical exchange saturation transfer. Magn Reson Med 2014;71(1):164-172.
21. Kogan F, Haris M, Debrosse C, Singh A, Nanga RP, Cai K, Hariharan H, Reddy R. In vivo chemical exchange saturation transfer imaging of creatine (CrCEST) in skeletal muscle at 3T. J Magn Reson Imaging 2014;40(3):596-602.
22. Haris M, Singh A, Cai K, Kogan F, McGarvey J, Debrosse C, Zsido GA, Witschey WR, Koomalsingh K, Pilla JJ, Chirinos JA, Ferrari VA, Gorman JH, Hariharan H, Gorman RC, Reddy R. A technique for in vivo mapping of myocardial creatine kinase metabolism. Nat Med 2014;20(2):209-214.
23. Cai K, Singh A, Poptani H, Li W, Yang S, Lu Y, Hariharan H, Zhou XJ, Reddy R. CEST signal at 2ppm (CEST@2ppm) from Z-spectral fitting correlates with creatine distribution in brain tumor. NMR Biomed 2015;28(1):1-8.
24. Chen L, Schar M, Chan KWY, Huang J, Wei Z, Lu H, Qin Q, Weiss RG, van Zijl PCM, Xu J. In vivo imaging of phosphocreatine with artificial neural networks. Nat Commun 2020;11(1):1072.
25. Chen L, Barker PB, Weiss RG, van Zijl PCM, Xu J. Creatine and phosphocreatine mapping of mouse skeletal muscle by a polynomial and Lorentzian line-shape fitting CEST method. Magn Reson Med 2019;81(1):69-78.
26. Chung JJ, Jin T, Lee JH, Kim SG. Chemical exchange saturation transfer imaging of phosphocreatine in the muscle. Magn Reson Med 2019;81(6):3476-3487.
27. Zu Z, Lin E, Louie E, Jiang X, Lankford C, Damon B, Does M, Gore J, Gochberg D. Chemical Exchange Rotation Transfer imaging of Phosphocreatine in Muscle. 2018; Paris, France. Proceedings of the 26h Annual Meeting of ISMRM. p 5106.
28. Zu Z, Lin EC, Louie EA, Jiang X, Lankford CL, Damon B, Does MD, Gore JC, Gochberg DF. Chemical exchange rotation transfer imaging of phosphocreatine in muscle. NMR Biomed 2021;34(2):e4437.
29. Xu JX, Chung LJ, Jin T. CEST imaging of creatine, phosphocreatine, and protein arginine residue in tissues. NMR Biomed 2022:DOI: 10.1002/nbm.4671.
30. Chen L, Zeng H, Xu X, Yadav NN, Cai S, Puts NA, Barker PB, Li T, Weiss RG, van Zijl PCM, Xu J. Investigation of the contribution of total creatine to the CEST Z-spectrum of brain using a knockout mouse model. NMR Biomed 2017;30(12):e3834.
31. Zhang Z, Wang K, Park S, Li A, Li Y, Weiss RG, Xu J. The exchange rate of creatine CEST in mouse brain. Magn Reson Med 2023:DOI: 10.1002/mrm.29662.
32. Bertram HC, Donstrup S, Karlsson AH, Andersen HJ, Stodkilde-Jorgensen H. Post mortem energy metabolism and pH development in porcine M. longissimus dorsi as affected by two different cooling regimes. A (31)P-NMR spectroscopic study. Magn Reson Imaging 2001;19(7):993-1000.
33. Newbold RP, Scopes RK. Post-mortem glycolysis in ox skeletal muscle. Effect of temperature on the concentrations of glycolytic intermediates and cofactors. Biochem J 1967;105(1):127-136.
34. in 't Zandt HJ, de Groof AJ, Renema WK, Oerlemans FT, Klomp DW, Wieringa B, Heerschap A. Presence of (phospho)creatine in developing and adult skeletal muscle of mice without mitochondrial and cytosolic muscle creatine kinase isoforms. J Physiol 2003;548(Pt 3):847-858.
35. Becila S, Herrera-Mendez CH, Coulis G, Labas R, Astruc T, Picard B, Boudjellal A, Pelissier P, Bremaud L, Ouali A. Postmortem muscle cells die through apoptosis. European Food Research and Technology 2010;231(3):485-493.
Figures