4450
Improved Differentiation of Glioma Grades through Fluid Exponential Suppression in Chemical Exchange Saturation Transfer (CEST) Imaging1Key Laboratory for Biomedical Engineering of Ministry of Education, Department of Biomedical Engineering, College of Biomedical Engineering & Instrument Science, Zhejiang University, Hangzhou, Zhejiang, China, 2Department of Radiology, Children’s Hospital, Zhejiang University School of Medicine, Hangzhou, Zhejiang, China, 3Philips Healthcare, Shanghai, China, 4Department of Neurosurgery, Children’s Hospital, Zhejiang University School of Medicine, Hangzhou, Zhejiang, China
Synopsis
Keywords: CEST / APT / NOE, CEST & MT
Motivation: Fluid-induced artifacts often hamper differentiation between high- and low-grade gliomas in CEST imaging.
Goal(s): Our goal was to develop a novel fluid exponential suppression factor to eliminate fluid-related artifacts.
Approach: We extended the original linear correction factor into a nonlinear exponential factor. The metrics with and without fluid suppression factors were compared using a dataset of 140 glioma patients.
Results: CEST metrics combined with the fluid exponential suppression factor substantially reduced the fluid-related artifacts and yielded higher AUCs for grading gliomas than linear correction and no correlation.
Impact: The novel fluid exponential suppression strategy can substantially improve the quality of CEST maps and enhance the performance of diagnosing gliomas. The proposed method is easy to adopt and can be applied to existing data retrospectively.
Introduction
Chemical exchange saturation transfer (CEST) imaging is a promising technique that has shown potential in various applications, including brain tumor diagnosis1-3. Glioma is one type of the most frequent brain tumors and can be stratified into different grades4. Accurate differentiation between these two types is crucial for appropriate treatment strategies. However, CEST imaging is susceptible to artifacts caused by the fluid component5, which hampers its diagnostic accuracy. Here, we further develop an optimized metric to suppress the fluid-related artifacts, dubbed fluid exponential suppression (FES).Methods
Metric definitionKeupp and Togao’s studies have proposed a fluid correcting metric5:$${CEST}_{w;fc}={MTR}_{asym;fc}={MTR}_{asym}[\Delta\omega]\times\varepsilon\times(MTR\left[\Delta\omega\right]+MTR\left[\Delta\omega\right])$$where $$$\varepsilon=1.0$$$ is favorably chosen for standard APTw MRI settings ($$$\Delta\omega=3.5~\text{ppm}$$$), and thus, the original fluid correction term is as follows.$$FC=MTR[\Delta\omega]+MTR[-\Delta\omega]$$Here, we define a new FES correction factor as:$$FES=\begin{cases}0,&FC<0\\FC^n,&0<FC<1\\1,&FC>1\end{cases}$$where $$$n$$$ is the power exponent, and $$$n=7$$$ was chosen in this study after optimization. Multiplying the FES factor with the original CEST metrics6,7 yields new CEST metrics of fluid suppression.$${CESTR}_{FES}=\left(MTR\left[\Delta\omega\right]-MTR\left[-\Delta\omega\right]\right)\times{FES}=CESTR\times{FES}$$$${CESTR}_{nr;FES}=\frac{Z\left[-\Delta\omega\right]-Z\left[\Delta\omega\right]}{Z\left[-\Delta\omega\right]}\ \times FES={CESTR}_{nr}\times{FES}$$$${MTR}_{Rex;FES}=\left(\frac{1}{Z\left[\Delta\omega\right]}-\frac{1}{Z\left[-\Delta\omega\right]}\right)\times{FES}={MTR}_{Rex}\times{FES}$$$${AREX}_{FES}=\frac{{MTR}_{Rex}}{T_1}\times{FES}=AREX\times{FES}$$
Image acquisition
IRB-approved pediatric glioma patients (n=140; age: 3 months to 14 years) were included in the study, of which 53 were high-grade gliomas, and 87 were low-grade gliomas. All images were acquired on a 3T MRI scanner (Achieva; Philips Healthcare), including conventional structural imaging (T1w, T2w, and FLAIR) and APT imaging. The APT acquisition was performed using a frequency-stabilized turbine spin-echo sequence with four 200ms-long and 2uT-strong block saturation pulses8.
Image processing
For comparison, each quantitative CEST metric was calculated without correction and with FC or FES correction. First, for each patient, the whole tumor region of interest (ROI) was drawn on the source APT image by an experienced pediatric radiologist. Second, areas within the initial ROI with unsmooth z-spectra were discarded. The smoothness was measured by comparing the difference between raw z-spectra and fitted ones. Third, the left ROI was further shrunken by keeping regions with values greater than a histogram threshold (from 0% to 90%, step size 5%). Last, mean metric values within the final ROI were calculated, and undergone ROC analysis for tumor grading. The AUCs were compared using the DeLong test9.
Results
Figure 1 compares CESTR spectra without and with FC/FES correction in voxels from fluid and solid regions. The FES correction can successfully suppress the signals from the fluid region while maintaining signals from the solid region (Fig. 1C). In contrast, neither the original nor the FC-corrected spectra could differentiate fluid and solid voxels.Figure 2 shows CESTR images without and with FC/FES correction from representative high-grade and low-grade glioma cases. It is clear that the FES instead of FC correction can virtually eliminate fluid artifacts.
The boxplots and ROC curves of different metrics are shown in Figure 3 and Figure 4, respectively. The boxplots illustrate that FES correction can effectively reduce the signal overlap between high-grade and low-grade gliomas. Notably, the AUCs of the CEST metrics with FES correction were significantly (p-value < 0.01 for CESTR; p-value < 0.05 for CESTRnr; p-value < 0.1 for MTRRex; p-value < 0.1 for AREX) higher than the original and FC-corrected metrics.
Discussion
It is well-known that fluid-like tissue compartments, such as cyst, hemorrhage, cerebral spinal fluid, and liquefactive necrosis, can induce artifacts in the CEST maps3,8. The resulting CEST signal is often indeterministic (especially in the asymmetry analysis) due to the complicated biochemical compositions. For example, depending on the protein content in the liquefactive necrosis, the APTw signal can vary indefinitely. However, the fluid-like tissues generally have higher T1 and T2 values than the solid tissues, resulting in elevated z-spectra. This difference has been utilized by Keupp et al.5 to correct the fluid artifacts by linearly multiplying the fluid correction factor. In this work, we extended the linear correction factor into a nonlinear exponential factor. In a large cohort of glioma patients, we demonstrated the proposed nonlinear FES factor outperformed the original linear FC factor both visually (Figs. 1-2) and quantitatively for grading gliomas (Figs. 3-4).Importantly, like the original FC factor, the proposed FES factor is convenient to use because it does not require extra data acquisition and can be applied retrospectively to existing data. Furthermore, it is worth noting the specific power exponent of$$$~n=7~$$$is the optimal one in this study, while it can certainly vary in other datasets or diseases.
Conclusion
This study has presented a novel fluid exponential suppression factor for CEST imaging, which can effectively eliminate fluid-related artifacts on CEST maps and enhance the differentiation between high-grade and low-grade gliomas. The proposed FES correction factor is convenient to use and can improve the diagnosis of gliomas.Acknowledgements
National Natural Science Foundation of China: 81971605. Key R&D Program of Zhejiang Province: 2022C04031. Leading Innovation and Entrepreneurship Team of Zhejiang Province: 2020R01003. This work was supported by the MOE Frontier Science Center for Brain Science & Brain-Machine Integration, Zhejiang University.References
[1] Jones KM, Pollard AC, Pagel MD. Clinical applications of chemical exchange saturation transfer (CEST) MRI. J Magn Reson Imaging 2018;47(1):11-27.
[2] Zhou J, Heo HY, Knutsson L, van Zijl PCM, Jiang S. APT-weighted MRI: Techniques, current neuro applications, and challenging issues. J Magn Reson Imaging 2019;50(2):347-364.
[3] Zhou J, Zaiss M, Knutsson L, Sun PZ, Ahn SS, Aime S, Bachert P, Blakeley JO, Cai K, Chappell MA, et al. Review and consensus recommendations on clinical APT-weighted imaging approaches at 3T: Application to brain tumors. Magn Reson Med 2022;88(2):546-574.
[4] Louis DN, Perry A, Wesseling P, Brat DJ, Cree IA, Figarella-Branger D, Hawkins C, Ng HK, Pfister SM, Reifenberger G, et al. The 2021 WHO Classification of Tumors of the Central Nervous System: a summary. Neuro-Oncology 2021;23(8):1231-1251.
[5] Jochen Keupp OT. Magnetization Transfer Ratio based Metric for APTw or CESTw MRI Suppressing Signal from Fluid Compartments - Initial Application to Glioblastoma Assessment. 2018; Paris, France.
[6] Heo HY, Lee DH, Zhang Y, Zhao XN, Jiang SS, Chen M, Zhou JY. Insight into the quantitative metrics of chemical exchange saturation transfer (CEST) imaging. Magnetic Resonance in Medicine 2017;77(5):1853-1865.
[7] Zaiss M, Xu JZ, Goerke S, Khan IS, Singer RJ, Gore JC, Gochberg DF, Bachert P. Inverse Z-spectrum analysis for spillover-, MT-, and T1-corrected steady-state pulsed CEST-MRI - application to pH-weighted MRI of acute stroke. Nmr in Biomedicine 2014;27(3):240-252.
[8] Zhang HX, Yong XW, Ma XH, Zhao JJ, Shen ZP, Chen XC, Tian FY, Chen WB, Wu D, Zhang Y. Differentiation of low- and high-grade pediatric gliomas with amide proton transfer imaging: added value beyond quantitative relaxation times. European Radiology 2021;31(12):9110-9119.
[9] Sun X, Xu WC. Fast Implementation of DeLong's Algorithm for Comparing the Areas Under Correlated Receiver Operating Characteristic Curves. Ieee Signal Processing Letters 2014;21(11):1389-1393.
Figures
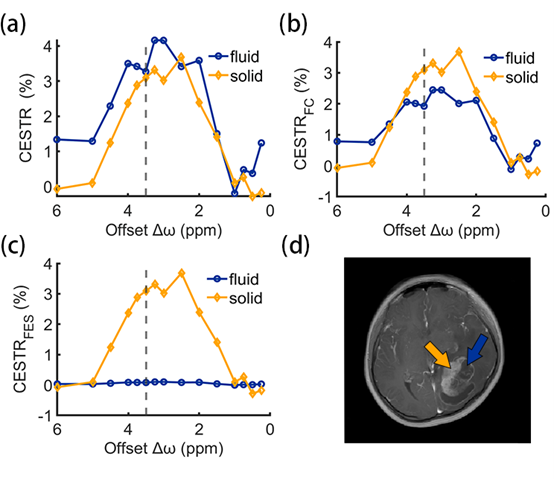
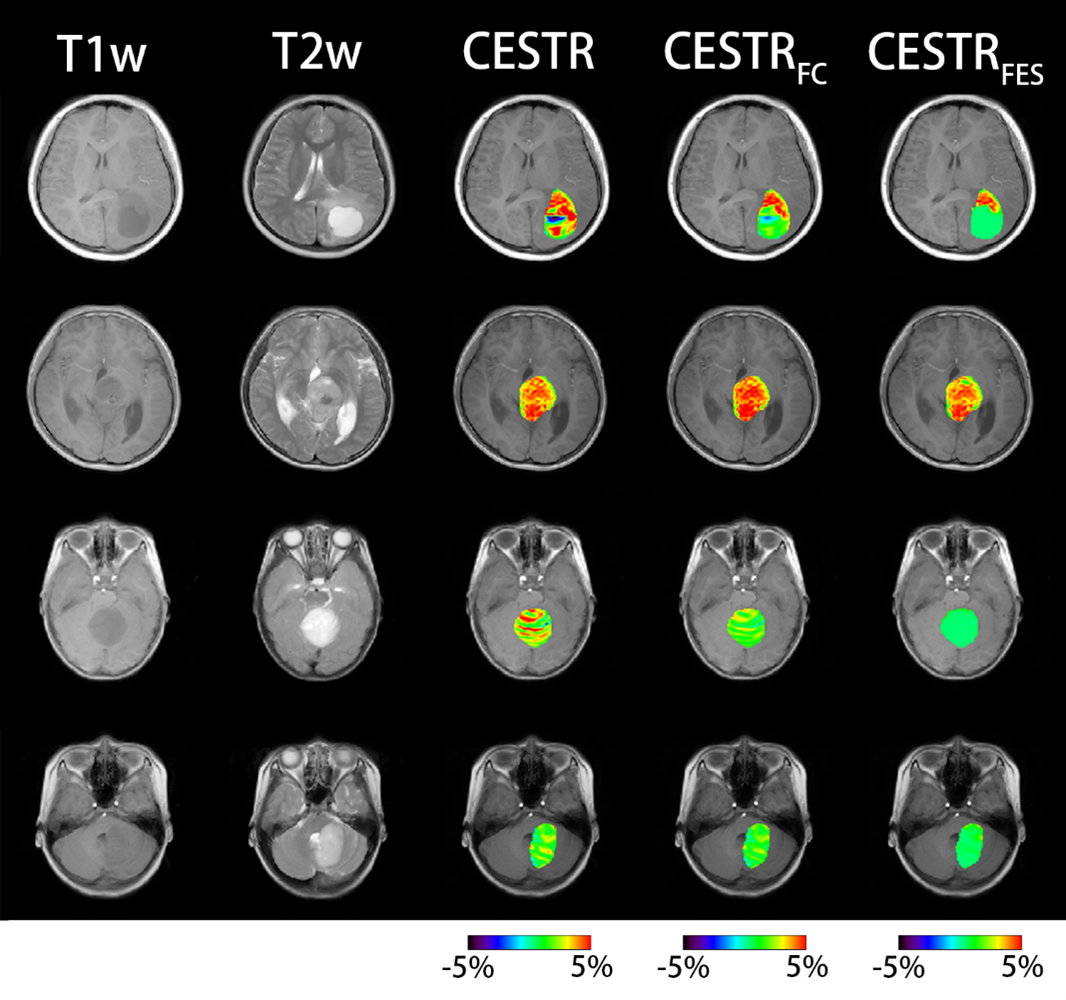
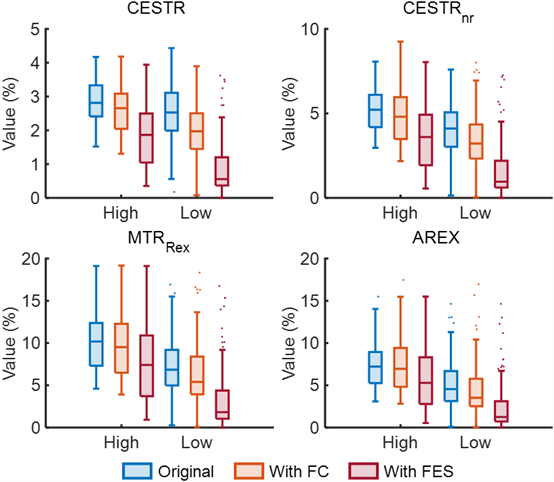
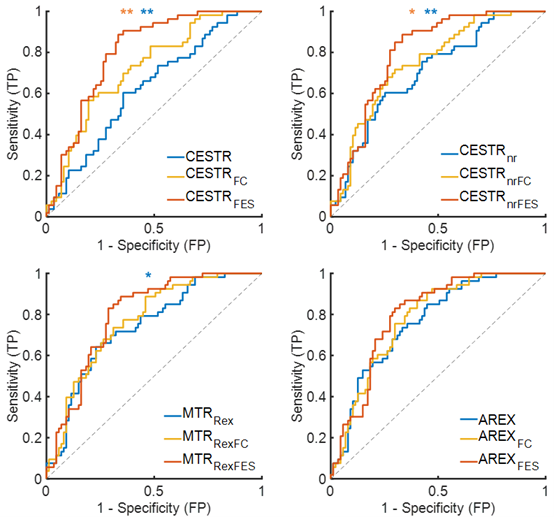
Figure 4: ROC curves of four CEST-related metrics with and without fluid suppression factors for grading gliomas. The AUCs of these curves are 0.62 (CESTR), 0.72 (CESTRFC), 0.80 (CESTRFES), 0.71 (CESTRnr), 0.75 (CESTRnr;FC), 0.80 (CESTRnr;FES), 0.74 (MTRRex), 0.77 (MTRRex;FC), 0.80 (MTRRex;FES), 0.76 (AREX), 0.78 (AREXFC), 0.80 (AREXFES), respectively. *P<0.05 and **P<0.01 indicate significance levels between metrics with FES and FC suppression (orange) and between metrics with and without FES suppression (blue).