4446
Lorentzian fitting of Average Rotation of Saturation Effects (AROSE) CEST spectra for quantification in stroke1Radiology, University of Pittsburgh, Pittsburgh, PA, United States, 2Emory National Primate Research Center, Emory University, Atlanta, GA, United States
Synopsis
Keywords: CEST / APT / NOE, CEST & MT
Motivation: Fitting of CEST spectra is obscured by MT, direct water saturation, and broad fast exchange peaks which result in contamination of quantified signals.
Goal(s): Using AROSE spectra for fitting simplifies CEST quantification by reducing the need for isolation of CEST signals due to preemptive filtering.
Approach: Fitting was first performed on simulated spectra at different exchange rates and then applied to in vivo data.
Results: Our results in MCAO rodents showed that quantification of CEST signal from AROSERRex spectra resulted in low fitting residuals with robust peaks at 3.6, 2.6, and 2 ppm and minimal contamination from MT and fast exchanges.
Impact: Fitting using AROSE-CEST spectra improves quantification of CEST exchange by minimizing contributions from broad fast exchanges and other contaminations such as MT which have been challenges for traditional fitting methods such as multiple -pool Lorentzian fitting.
Introduction
CEST MRI signal is usually contaminated by magnetization transfer (MT) from semi-solids and overlapping faster, broad exchanges1. While methods such as Lorentzian fitting have been used to separate some of these effects such as MT, its accuracy is uncertain. Moreover, broader fast exchanges still remain an issue that interferes with quantification of slower CEST peaks2,3. We have recently proposed Average Saturation Efficiency Filter (ASEF)4,5 and Adjustment of Rotation and Saturation Effects (AROSE)6 for CEST imaging that can filter out fast chemical exchange species and semisolid macromolecules simplifying quantification by fitting. In this study, we demonstrate the fitting of AROSE spectra in simulations and in vivo in rats with Middle Cerebral Artery Occlusion (MCAO).Methods
CEST signals were simulated by Bloch-McConnell Equations which include up to 3 pools: labile protons, free water protons, and bound water protons. Imaging of MCAO rats (n=7) was performed 3-4 hours post-operation using 4-s saturation preparation with average B1=0.80 μT applied at 59 offsets (-6-7 ppm) comprising either a Continuous Wave (CW) pulse or a train of 47 2π Gaussian pulses with duration=17 ms and pulse interval=68 ms, yielding a duty cycle (DC) of 20%. Two slice spin-echo EPI was read-out: matrix size= 80×80, field of view= 32×32 mm, slice thickness= 2 mm, TR= 7 s and TE= 20 ms. Correction factor matching and baseline-correction was performed according to our previous work5. CEST signals were calculated as follows: AROSERRex(Ω) = SCW(300ppm)/SCW(Ω) – Slow DC(300ppm)/Slow DC(Ω) where Ω is frequency offset, low DC refers to saturation by low duty cycle pulse train, and reference images were acquired at 300 ppm.Results
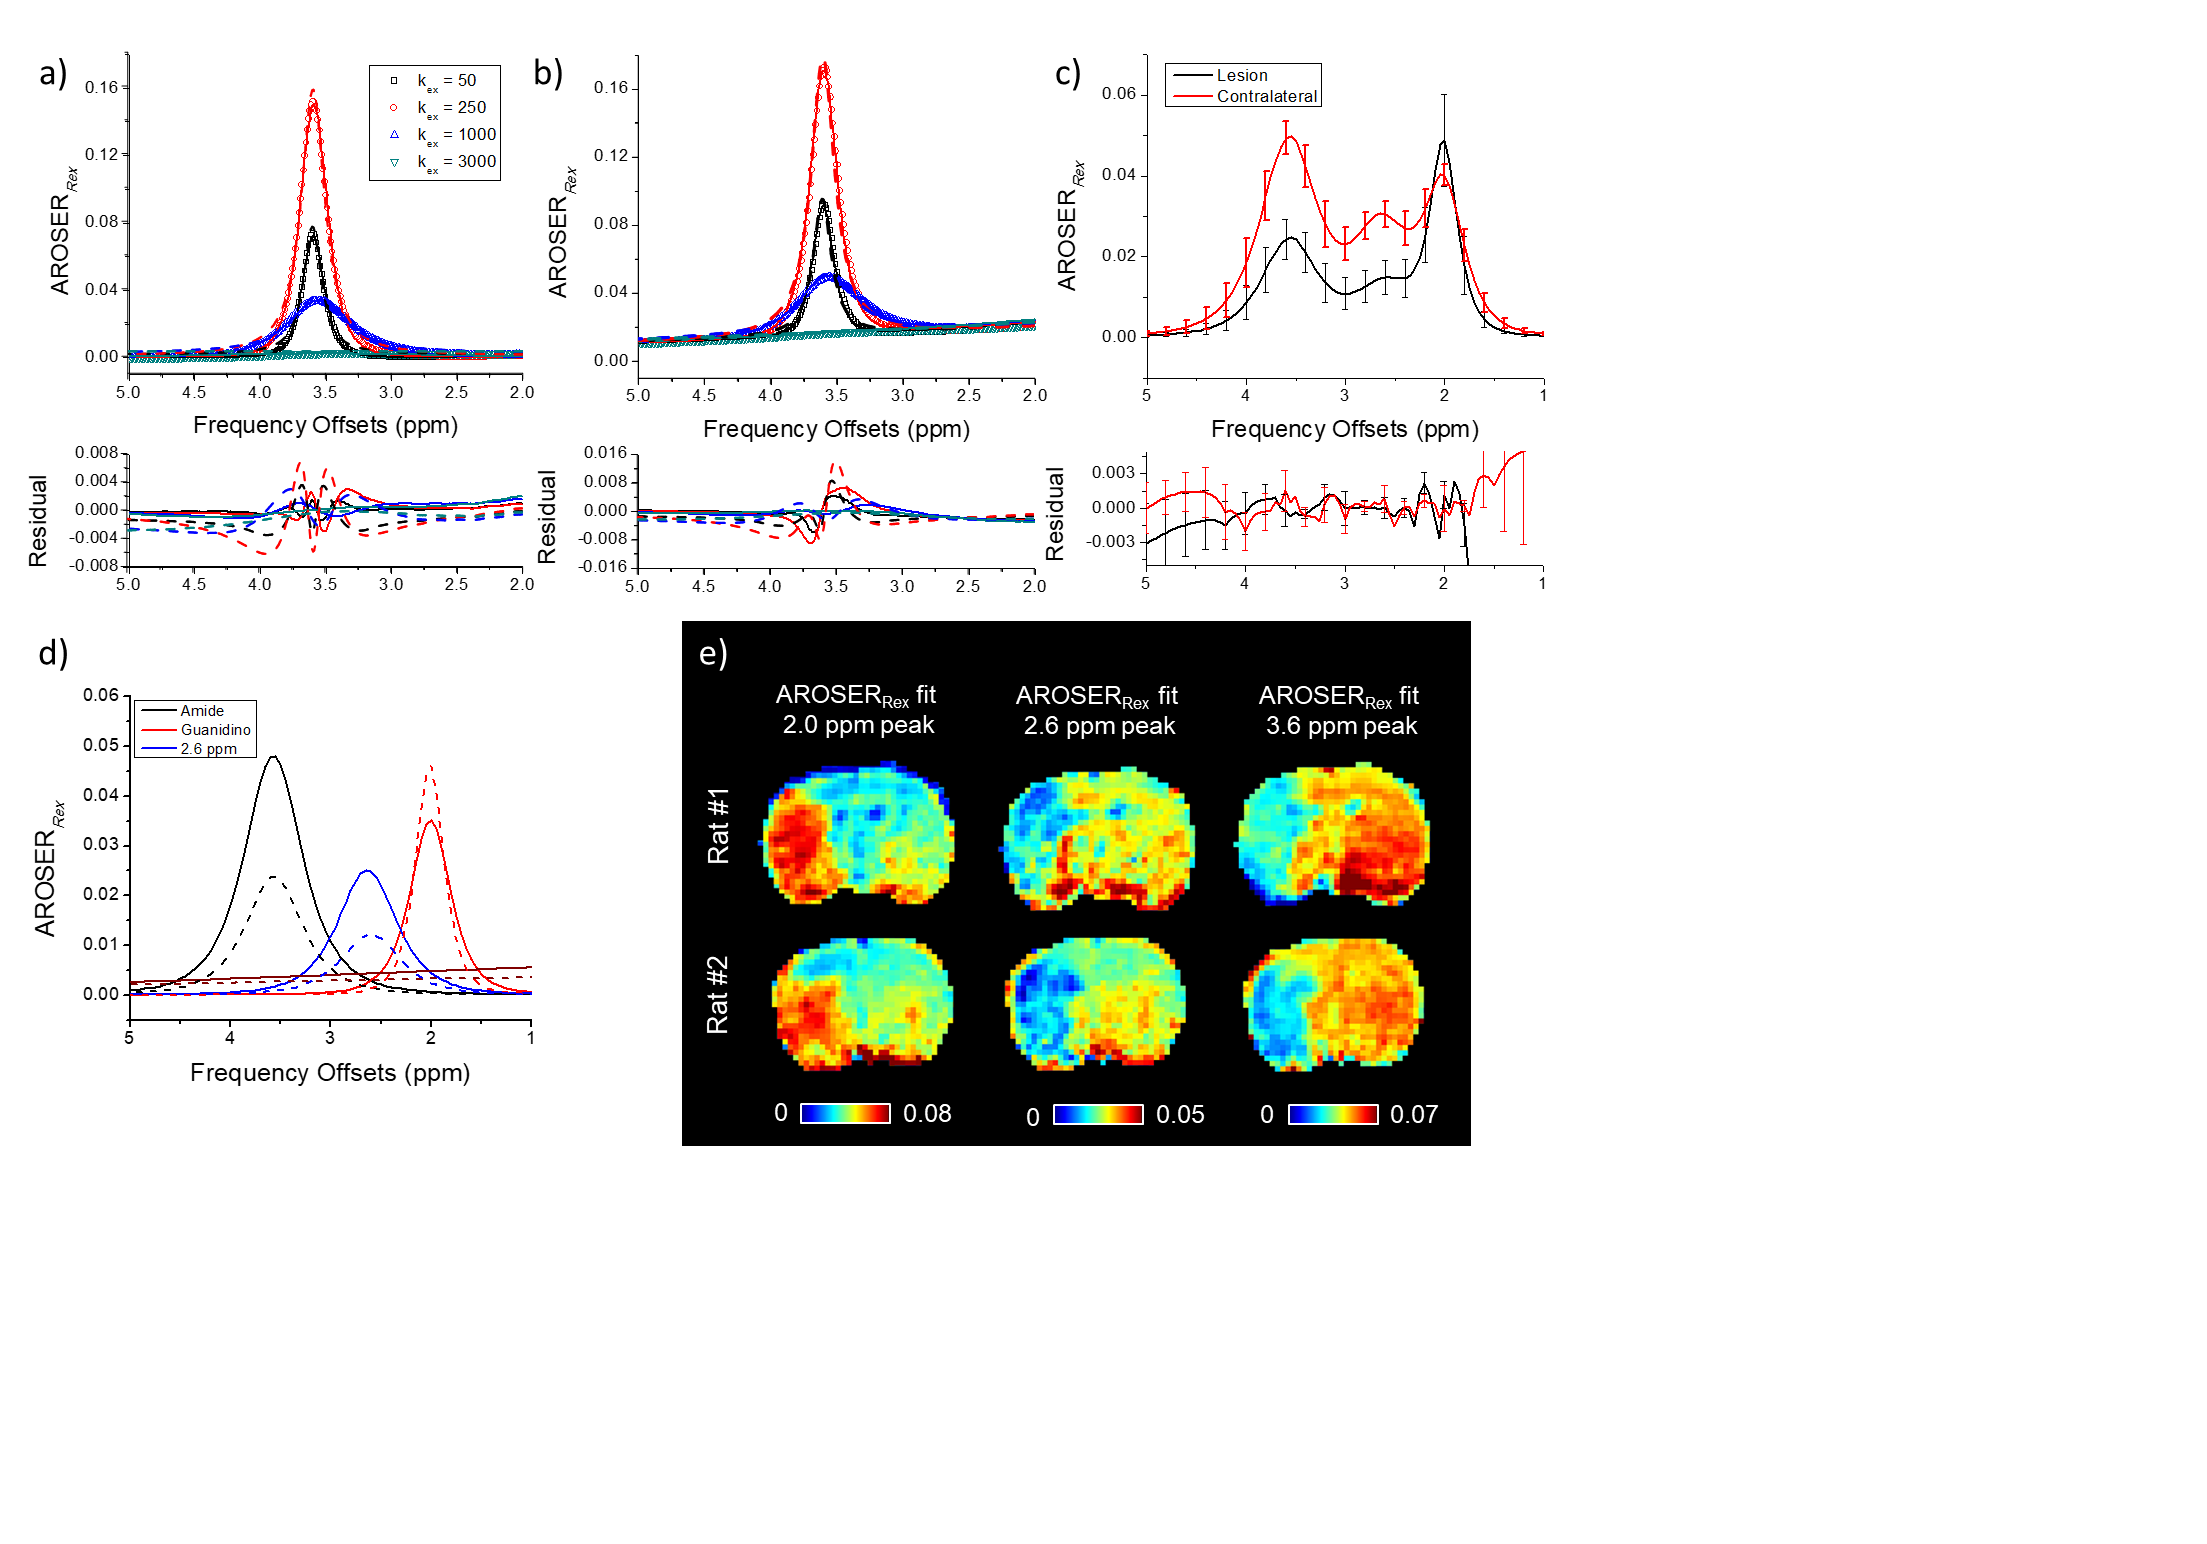
Simulated AROSERRex signal (Fig. 1a) increases with exchange rate from 50 to 250, while at 1000, AROSE-2π partially filters out the faster exchanging signal with signal fully filtered at 3000. AROSERRex spectra were fit with either Lorentzian (dotted) squared Lorentzian curves (solid), and the fitting residual was smaller for the squared Lorentzian fit compared to the Lorentzian curve particularly close to the peak. The addition of MT (fMT = 0.10, Fig. 1b), resulted in a sloping baseline for the AROSERRex spectra. This baseline was fit by adding a broad MT function to account for the added MT resulting in a reasonable residual that is asymmetric across the peak. Sensitivity of AROSERRex spectra increase by the amount of the baseline when compared to the original AROSERRex peaks. In MCAO rodents, fitting AROSERRex spectra (Fig. 1c) resulted in consistent fit functions that can be baseline-corrected by removing the residual fitted MT for comparison between spectra from the lesion (black) and contralateral ROIs (red). The fitting residual between the raw data and overall fit was relatively low within the range of CEST signal of interest (1.7 – 4.2 ppm). The mean fit shows a sloping baseline that is small but nontrivial where removal of this baseline improves the consistency of the other fitted exchange peaks (Fig. 1d). The guanidino peak at 2.0 ppm shows elevated amplitude in the lesion with a higher degree of variability when compared to contralesional tissue (0.051 S.D. 0.012 vs 0.041 S.D. 0.004). At 2.6 ppm, the CEST peak amplitude is highly attenuated in the lesion with relatively low variability (0.014 S.D. 0.003 vs 0.025 S.D. 0.002). Similarly, the lesion amplitude for the amide peak was also attenuated when compared to the contralateral (Fig. 5e, 0.029, SD = 0.004 vs 0.052, SD = 0.005) demonstrating significant contrast between the two tissues. Example parametric maps from AROSERRex fitting of squared Lorentzian functions (Fig. 1e) show clearly defined lesion margins.Discussion
In this study, we demonstrate the potential of using AROSE filtering to simplify CEST signal quantification via spectral fitting. Implementing AROSE to acquire the CEST spectra filters out fast exchanges and the majority of the MT background leaving only minimal MT baseline which can be easily accounted for through fitting. Combining AROSE filtering with squared Lorentzian, the inherent mismatch from MT between the CW and pulsed spectra that required correction in our previous work is accounted for through the fitting of the MT baseline. This results in simplified quantification without the uncertainty of needing to fit broad fast exchange peaks. While spectra acquired using AROSE-2π were studied in this work, fitting could easily be adapted to ASEF or AROSE at other rotational angles which may enhance contrast between normal and ischemic tissues.Conclusion
Squared Lorentzian fitting of AROSE spectra simplifies CEST quantification by reducing the need for isolation of CEST signals from obscuring MT, direct water saturation, and broad fast exchange peaks by preemptive filtering from AROSE spectra.Acknowledgements
This work is supported by NIH grant R01NS100703.References
1. Zong X, Wang P, Kim SG, Jin T. Sensitivity and source of amine-proton exchange and amide-proton transfer magnetic resonance imaging in cerebral ischemia. Magn Reson Med. 2014;71(1):118-132.
2. Cui J, Afzal A, Zu Z. Comparative evaluation of polynomial and Lorentzian lineshape-fitted amine CEST imaging in acute ischemic stroke. Magn Reson Med. 2022;87(2):837-849.
3. Sun C, Zhao Y, Zu Z. Validation of the presence of fast exchanging amine CEST effect at low saturation powers and its influence on the quantification of APT. Magn Reson Med. 2023;90(4):1502-1517.
4. Jin T, Chung JJ. Average saturation efficiency filter (ASEF) for CEST imaging. Magn Reson Med. 2022;88(1):254-265.
5. Chung JJ, Jin T. Average saturation efficiency filter ASEF-CEST MRI of stroke rodents. Magn Reson Med. 2023;89(2):565-576.
6. Jin T, Chung JJ. Adjustment of Rotation and Saturation Effects (AROSE) for CEST Imaging. Poster # 3158, International Society for Magnetic Resonance in Medicine 2023; Toronto.
Figures