4445
Cell Surface Mannose Overexpression as New CEST MRI Biomarker for Glioblastoma Aggressiveness1Russell H. Morgan Department of Radiology and Radiological Science, Division of MR Research, Cellular Imaging Section and Vascular Biology Program, Institute for Cell Engineering, Johns Hopkins University, Baltimore, MD, United States, 2Department of Oncology, Department of Neurology, Johns Hopkins University, Baltimore, MD, United States, 3Russell H. Morgan Department of Radiology and Radiological Science, F.M. Kirby Research Center for Functional Brain Imaging, Kennedy Krieger Inc., Johns Hopkins University, Baltimore, MD, United States, 4Russell H. Morgan Department of Radiology and Radiological Science, Division of MR Research, Cellular Imaging Section and Vascular Biology Program, Institute for Cell Engineering, Department of Oncology, F.M. Kirby Research Center for Functional Brain Imaging, Kennedy Krieger Inc., Johns Hopkins University, Baltimore, MD, United States
Synopsis
Keywords: CEST / APT / NOE, CEST & MT, Glioblastoma, Cancer stem cells, Label-free CEST
Motivation: Non-invasive grading of glioblastoma (GBM) aggressiveness is critical for choosing a proper treatment paradigm
Goal(s): To develop a label-free MRI technique that can probe the presence of cancer stem cells (CSCs) in GBM.
Approach: To detect high mannose N-linked glycans overexpressed on mesenchymal CSCs with mannose-weighted (MANw) CEST MRI.
Results: MANw CEST MRI was able to produce a distinct signal for highly aggressive GBM tumor spheres but not for low aggressive ones, which corresponded to the histoptahological presence or absence of mannose expression.
Impact: We present a simple, non-invasive diagnostic approach for assessment of glioblastoma aggressiveness, which can be immediately implemented as an add-on to current MRI protocols.
Introduction
Glioblastoma (GBM) is the most malignant primary brain cancer in adults. Despite recent therapeutic advances, GBM patients have a median survival rate of only 14-16 months [1]. A major challenge has been radiological differentiation between tumors of varying aggressiveness, a distinction that plays a pivotal role in guiding treatment decisions [2]. The abundant presence of fast proliferating cancer stem cells (CSCs) is a hallmark of GBM. Some advancements in developing targeted imaging agents against CSCs using radionuclides or magnetic resonance imaging (MRI) contrast agents have been made, but these approaches require a lengthy and expensive drug development process for clinical approval. An imaging technique that is ‘label-free’ (that does not rely on administering an exogenous agent) and can probe the aggressiveness of brain cancer during the initial diagnostic MRI session would be extremely valuable. Amide proton transfer (APT) chemical exchange saturation transfer (CEST) MRI [3] is such a method that can report on the histopathological grade of adult diffuse gliomas [4, 5], but it cannot differentiate between various degrees of GBM aggressiveness. One of the reasons why GBM is so invasive is an intricate biological reprogramming termed proneural-to-mesenchymal transition [6]. This shifts the tumor toward mesenchymal traits, including extracellular matrix remodeling, cytoskeletal repatterning, and stem-like trait acquisition. Since a recent study demonstrated that unlabeled mesenchymal stem cells with high-mannose N-linked glycan expression can be detected by mannose-weighted (MANw) CEST MRI [7], we investigated if mesenchymal CSCs (MCSCs) could be detected in a similar fashion.Methods
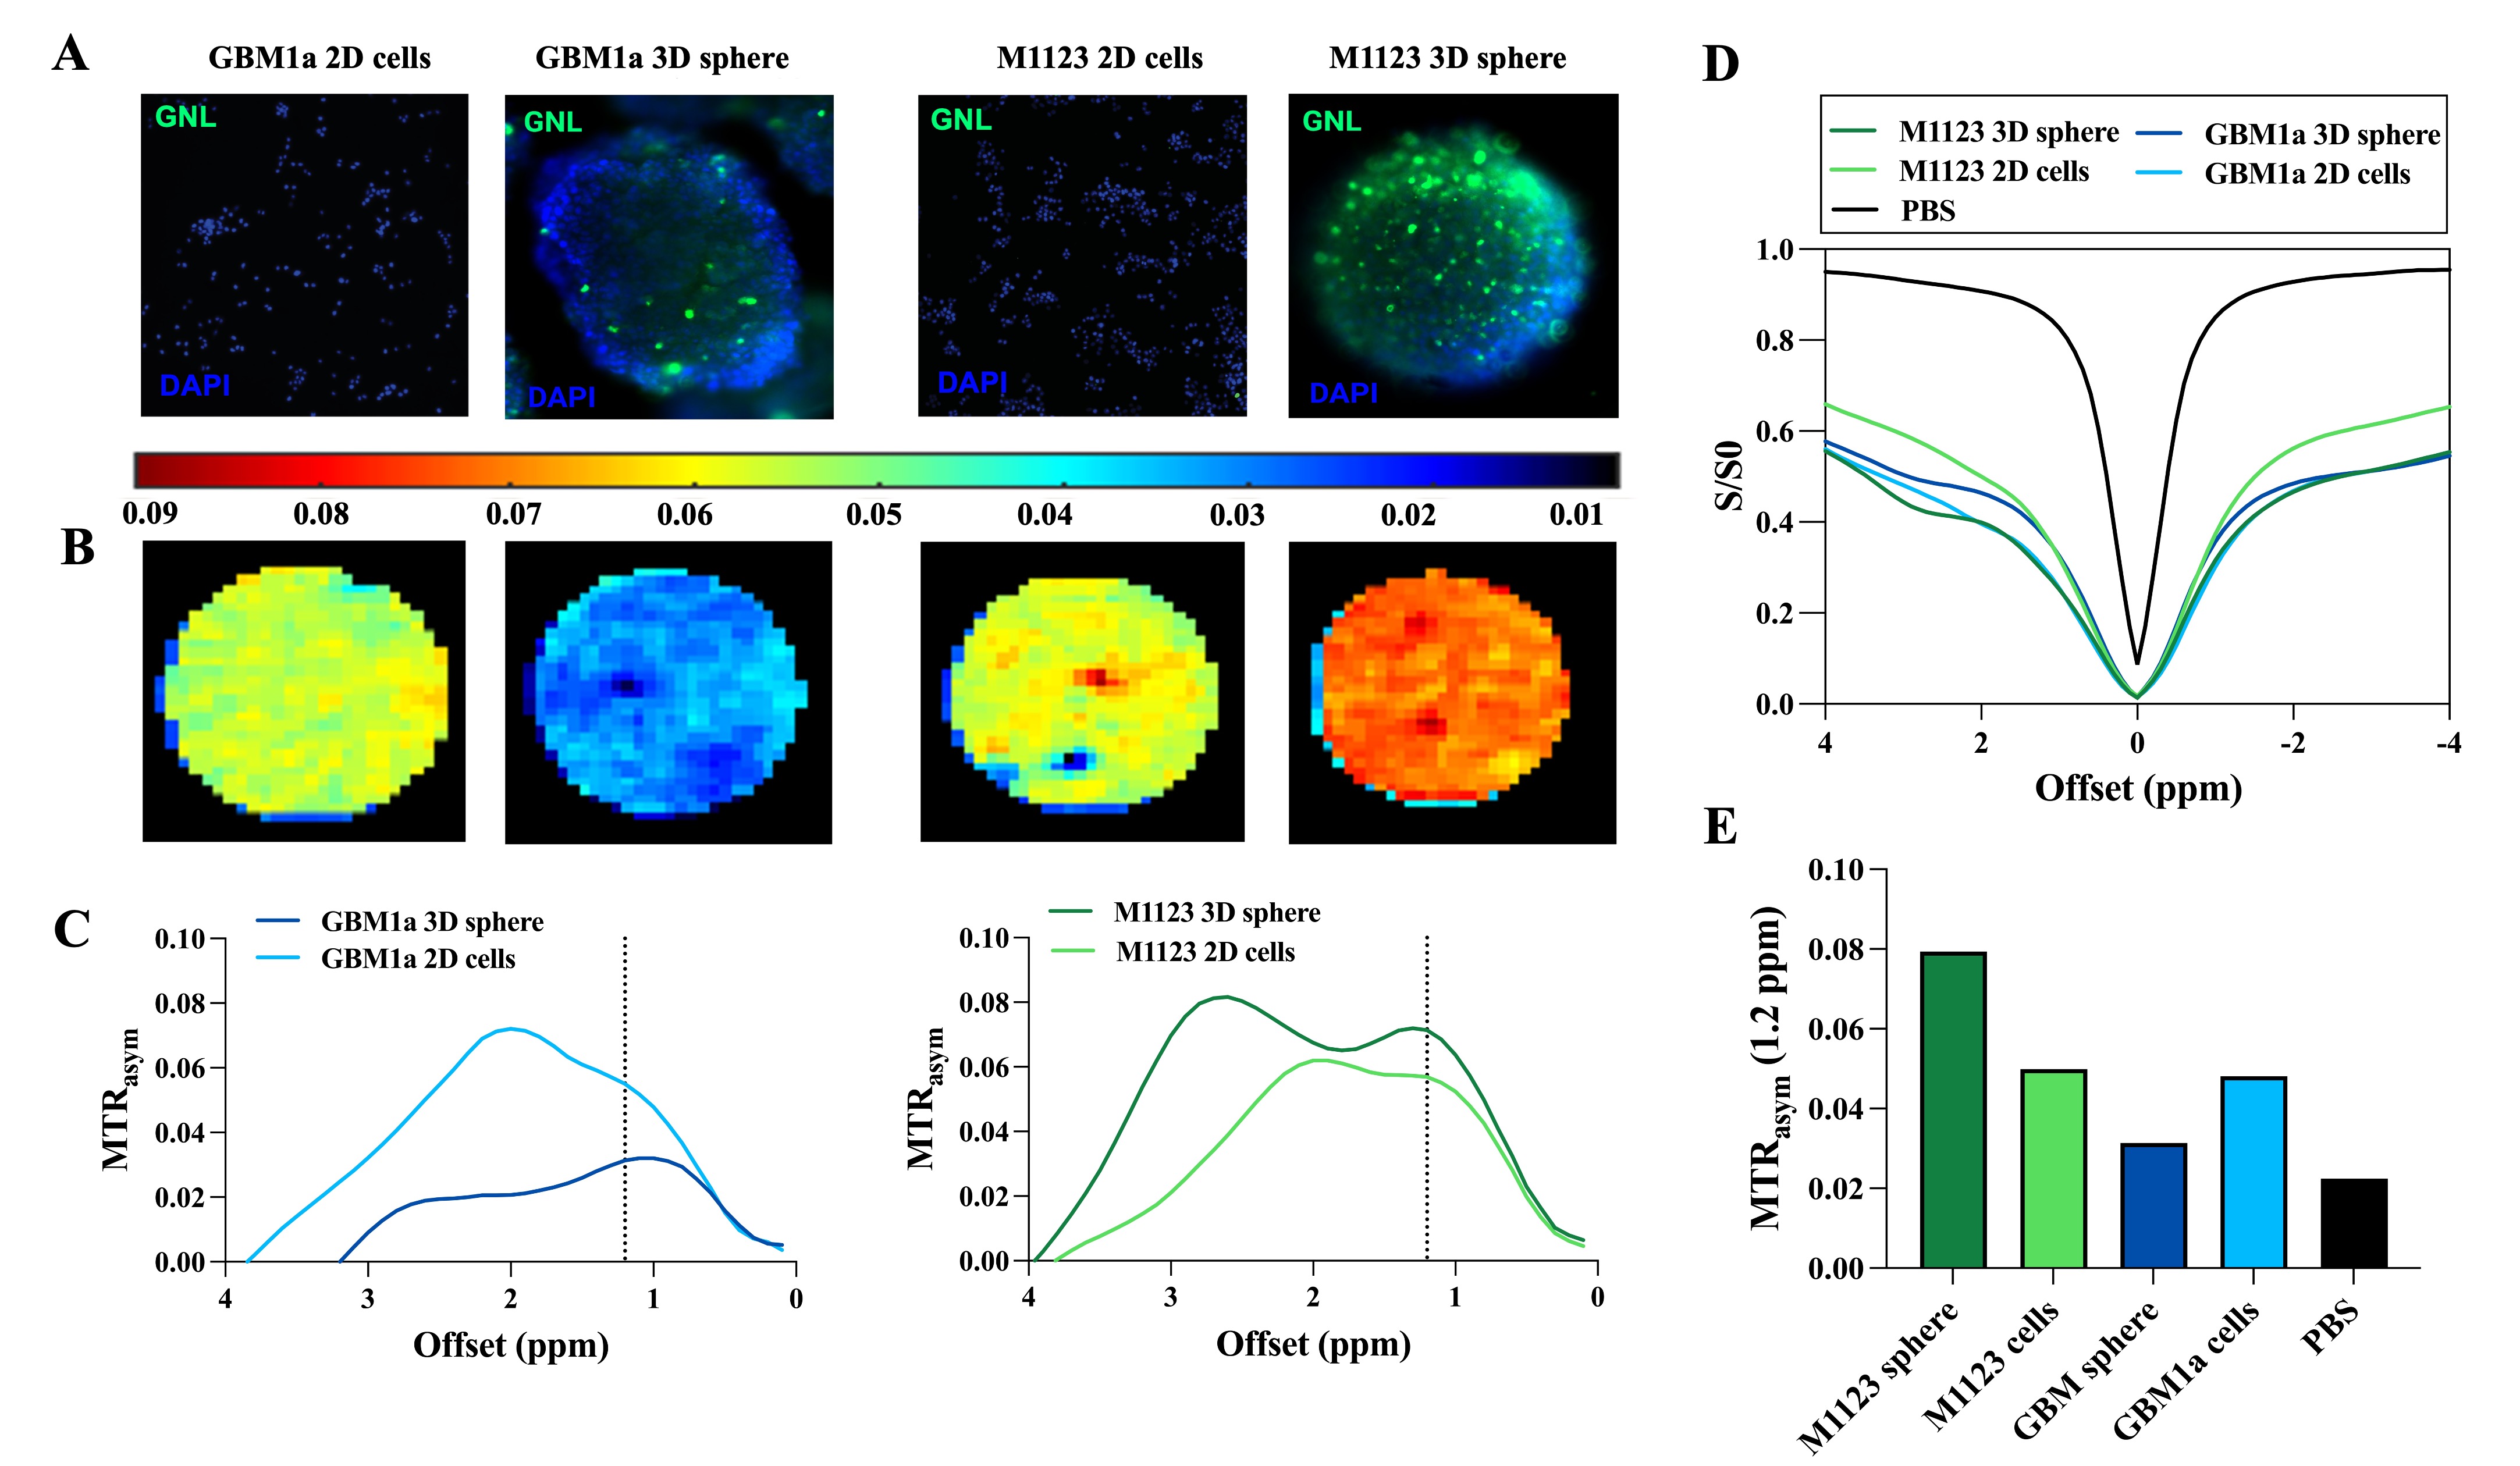
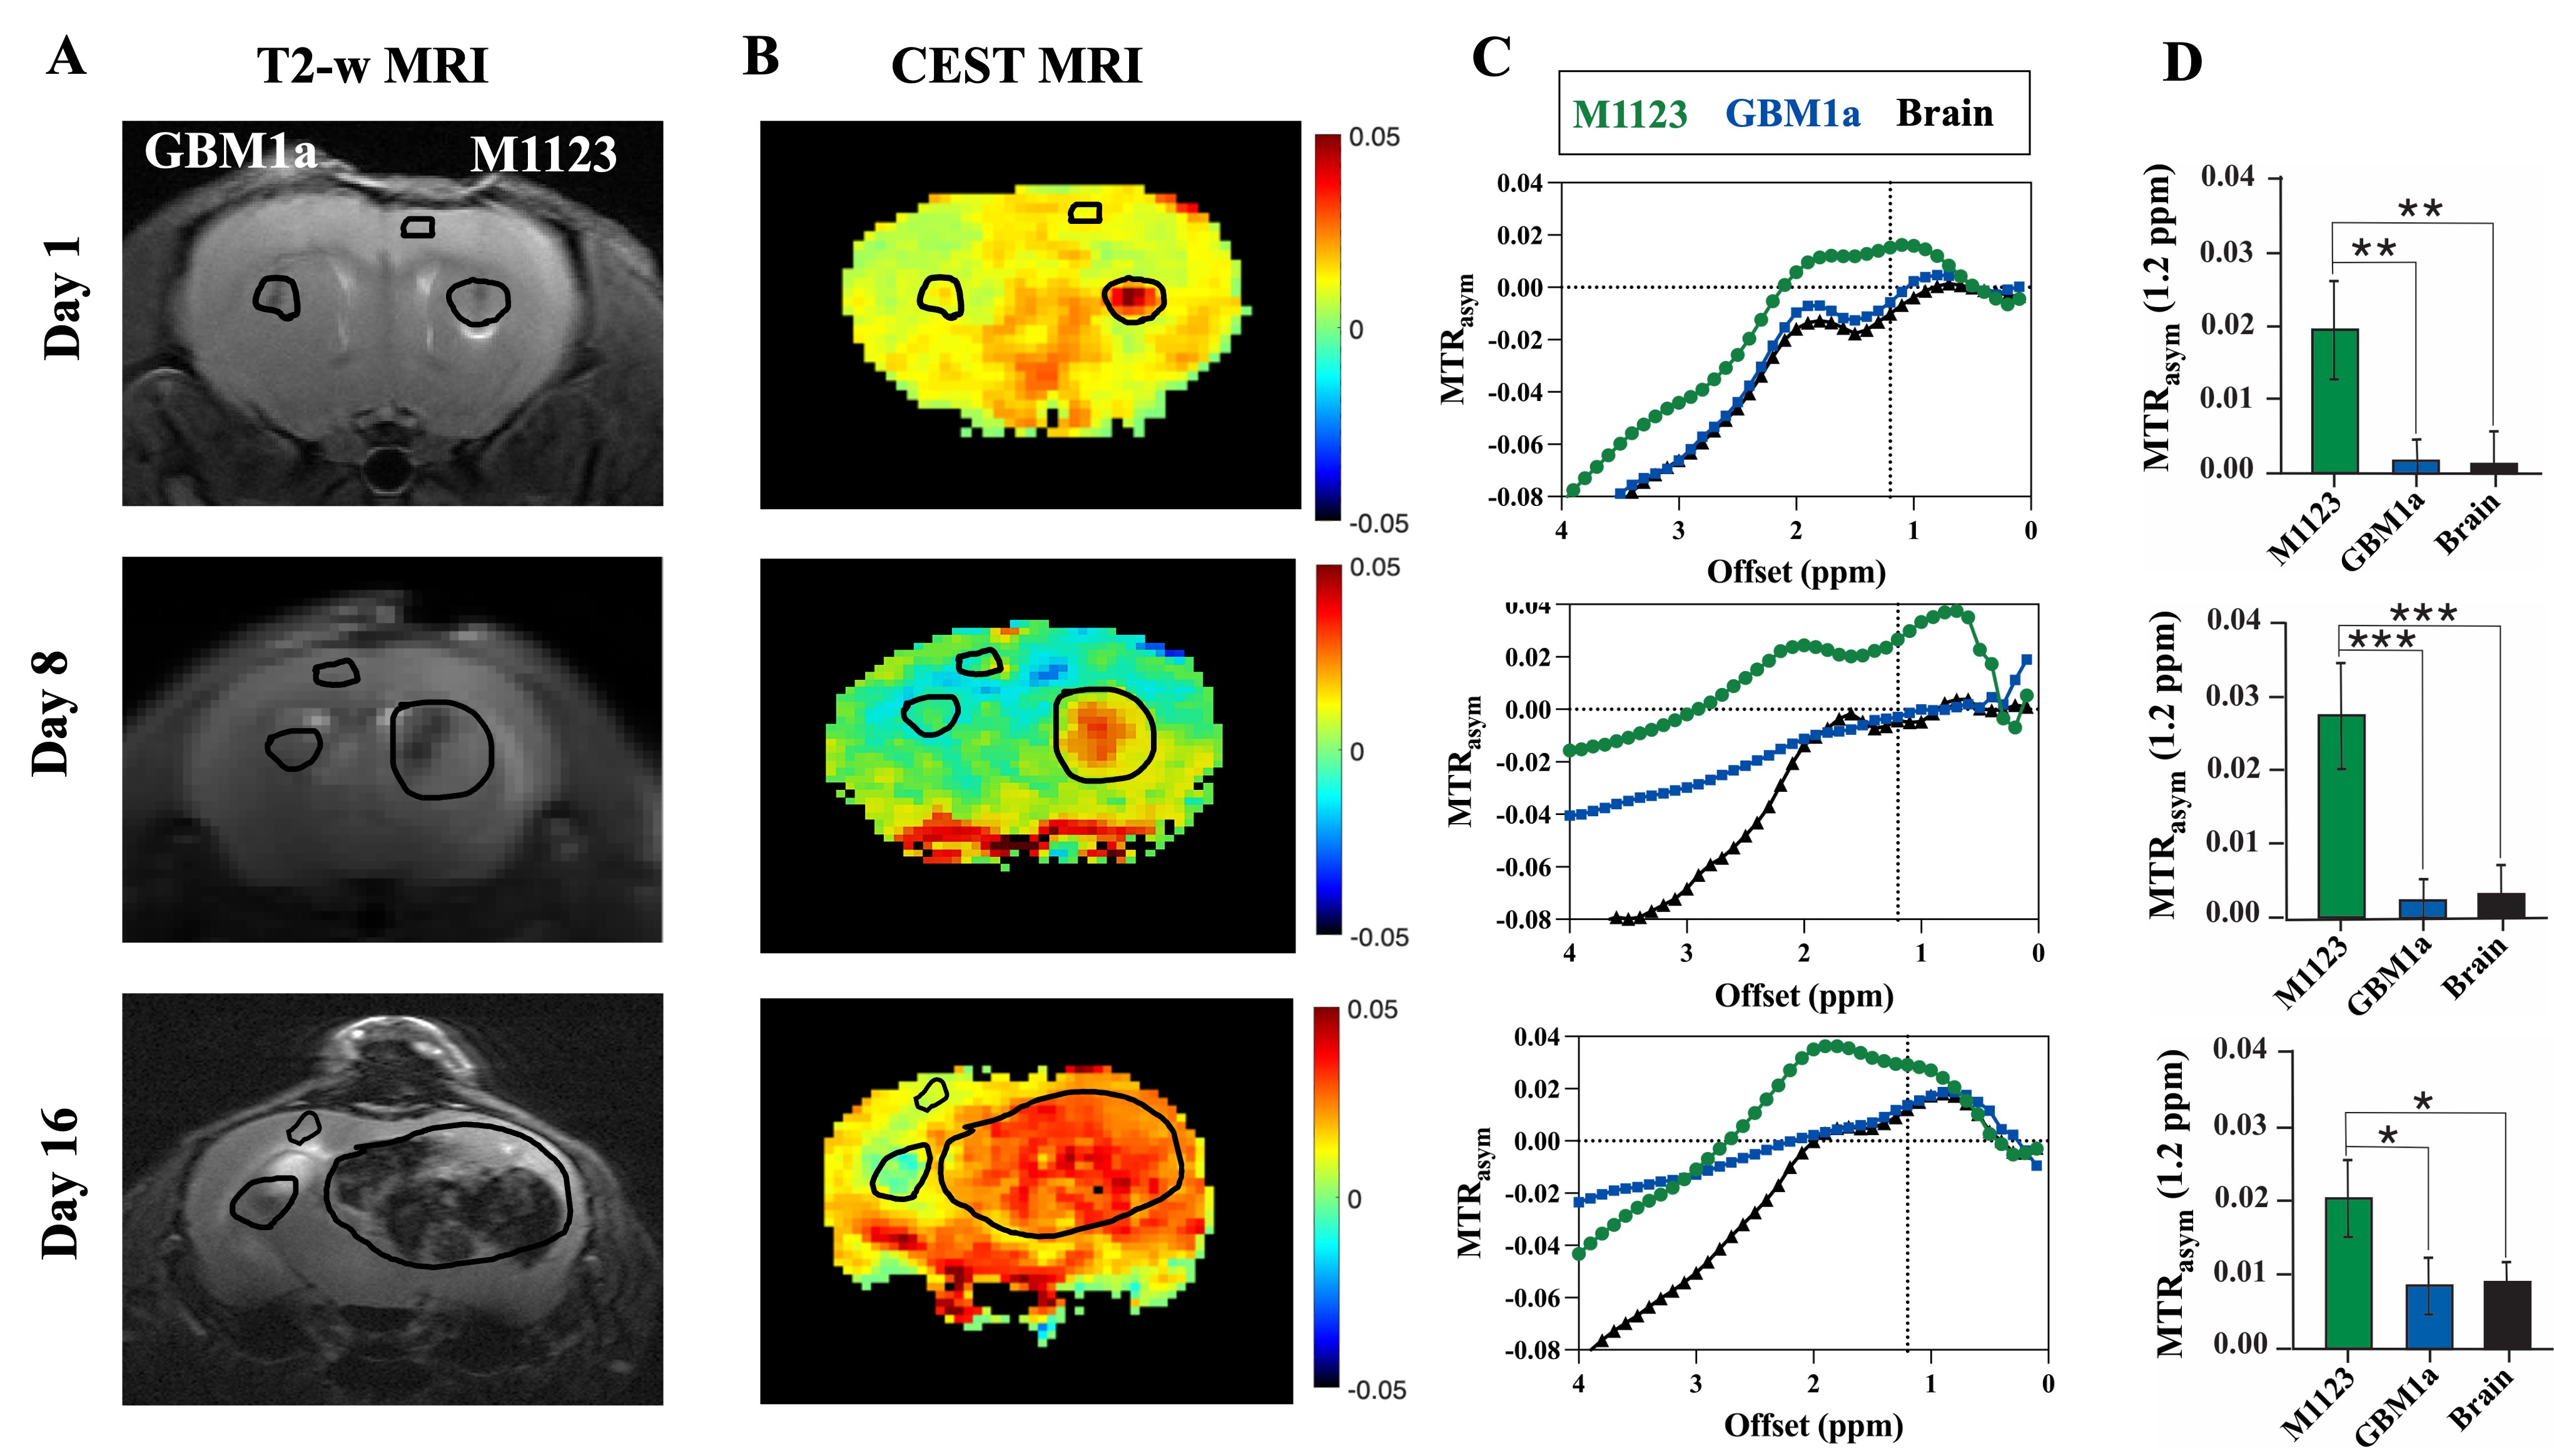
Low aggressive GBM1a (classical) and highly aggressive M1123 (mesenchymal) human GBM patient derived cells were used throughout our studies. The expression of mannose N-linked glycans on the cell membrane was assessed using fluorescein-labeled galanthus nivalis lectin (GNL) staining of 2D cell and 3D tumor sphere cultures. In vitro CEST MRI of cell phantoms was conducted using a Bruker 11.7T vertical bore spectrometer and a 20 mm T/R coil. Z-spectral data were collected over a range from ±4.0 ppm relative to the water frequency with a 0.1 ppm step-size using a CW RF pulse of B1=2.4 μT, and Tsat=3 s. For an in vivo orthotopic GBM tumor model, 2×10⁵ M1123 and GBM1a tumor sphere lines were injected into the right and left striatum of immunodeficient NSG mice brain, respectively. In vivo T2-w and CEST MRI was performed 1, 8 and 16 days after injection using an 11.7 T Bruker Biospin horizontal bore scanner equipped with a 25-mm mouse head volume coil. CEST MRI was performed with a saturation pulse B1=2.4 µT and Tsat=3 s, with the saturation frequency swept between ±5 ppm with a 0.2 ppm increment. For ROI analysis, tumor and brain ROIs were manually drawn based on T2-w images.Results
GNL staining of 2D cell cultures revealed low mannose expression for both cell lines, suggesting the presence of few CSCs. In contrast, 3D tumor sphere cultures known to be enriched for CSCs showed that M1123 contained significantly higher levels of mannose, suggesting a greater presence of MCSCs compared to GBM1a (Fig. 1A). In vitro CEST MRI correlated to these expression levels with the highest CEST signal was observed in the M1123 3D tumor spheres (Fig.1 B-D). We then transplanted the two different types of 3D tumor spheres to the mouse brains. As shown in the T2w images (Fig. 2A), M1123 cells grow much faster than GBM1a, and invaded into the entire hemisphere on day 16, with pronounced hypointense regions due to necrosis and hemorrhage. For the MANw CEST MRI, a distinct signal was observed for M1123, whereas GBM1a signal levels were not distinguishable from the normal brain tissue background. Eight and 16-day post-injection follow-up revealed that the aggressive M1123 tumor had grown considerably and was again accompanied by a pronounced MANw CEST signal (Fig.2 B,C). The difference in MANw CEST signal of M1123 was significantly higher (>1.8-fold) than GBM1a and host brain at all three time points (Fig. 2D).Discussion and Conclusion
Our findings suggest that MAN-w CEST MRI may be able to discern between highly aggressive and low aggressive GBM, potentially allowing a label-free, non-invasive differentiation of GBM aggressiveness. This advancement may significantly decrease the time interval between diagnosis and treatment, increasing patient survival rates and improving post-treatment evaluation. As brain tumor patients already undergo routine MRI, our approach can immediately be implemented without further regulatory approval.Acknowledgements
No acknowledgement found.References
1. Low, J.T., et al., Primary brain and other central nervous system tumors in the United States (2014-2018): A summary of the CBTRUS statistical report for clinicians. Neuro-oncology practice, 2022. 9(3): p. 165-182.2. Lal, B., et al., Preclinical Efficacy of LP-184, a Tumor Site Activated Synthetic Lethal Therapeutic, in Glioblastoma. Clinical Cancer Research, 2023. 29(20): p. 4209-4218.3. Zhou, J., et al., Differentiation between glioma and radiation necrosis using molecular magnetic resonance imaging of endogenous proteins and peptides. Nat Med, 2011. 17(1): p. 130-4.4. Togao, O., et al., Amide proton transfer imaging of adult diffuse gliomas: correlation with histopathological grades. Neuro-oncology, 2014. 16(3): p. 441-448.5. Wu, M., et al., Amide proton transfer-weighted imaging and derived radiomics in the classification of adult-type diffuse gliomas. European Radiology, 2023: p. 1-11.6. Ortensi, B., et al., Cancer stem cell contribution to glioblastoma invasiveness. Stem cell research & therapy, 2013. 4(1): p. 1-11.7. Yuan, Y., et al., In vivo tracking of unlabelled mesenchymal stromal cells by mannose-weighted chemical exchange saturation transfer MRI. Nature biomedical engineering, 2022. 6(5): p. 658-666.Figures