4443
Simultaneous Observation of Distinct Phosphocreatine and Creatine CEST Peaks in Exercised Human Skeletal Muscle at 5T1Key Laboratory for Magnetic Resonance and Multimodality Imaging of Guangdong Province, Shenzhen Institute of Advanced Technology, Chinese Academy of Sciences, Shenzhen, China, 2Department of Electronic Science, Xiamen University, Xiamen, China
Synopsis
Keywords: CEST / APT / NOE, CEST & MT, Muscle, creatine, phosphocreatine, CK reaction
Motivation: PCrCEST and CrCEST contrasts are weak and indiscernible in clinical settings (≤ 3 T), limiting the accuracy of quantification.
Goal(s): To develop an accurate and reliable PCrCEST and CrCEST method in human skeletal muscle at 5 T.
Approach: The optimal saturation scheme was investigated. Two-peak PLOF method was employed for quantification. Plantar flexion exercise was conducted to validate the performance of the proposed method.
Results: Distinct PCrCEST and CrCEST peaks can be observed simultaneously at 5T. The transition between PCr and Cr was clearly observed in a volunteer during and after exercise.
Impact: Improved accuracy and reliability of PCrCEST and CrCEST in human skeletal muscle can be obtained at 5T. The distinct CEST peak at 2.0 ppm immediately after exercise suggests that the in vivo CrCEST is a slow-exchanging process.
Introduction
The interconversion of high-energy phosphocreatine (PCr) and creatine (Cr) under creatine kinase is essential in fueling cellular activities1. Monitoring the dynamic changes of the metabolites can be valuable for evaluating mitochondrial function and diseases 2,3. 31P MRS is a non-invasive method for measuring PCr concentration in vivo4; however, its broad application is hindered by additional hardware requirements, low sensitivity, and poor spatial resolution. Chemical exchange saturation transfer (CEST) has been demonstrated to be feasible in detecting Cr1,5 or PCr6 in vivo with improved detection sensitivity and spatial resolution by exploiting the chemical exchange between water and exchangeable protons. However, due to the relatively low magnetic field strength in clinical settings (≤3T), the PCr CEST contrast is subtle (around 1%)6, and Cr CEST is indiscernible due to the rapid exchange of amine protons, which limit the accuracy and reliability of PCr and Cr quantification.In this study, we conducted the CEST experiment using a 5T human scanner and, to the best of our knowledge, simultaneously observed the distinct PCrCEST and CrCEST peaks in human skeletal muscle for the first time. The transition between PCr and Cr was clearly observed in the volunteer during and after plantar flexion exercise. The recovery curves of PCr and Cr were plotted, and the mean recovery time for different muscle groups was measured.
Methods
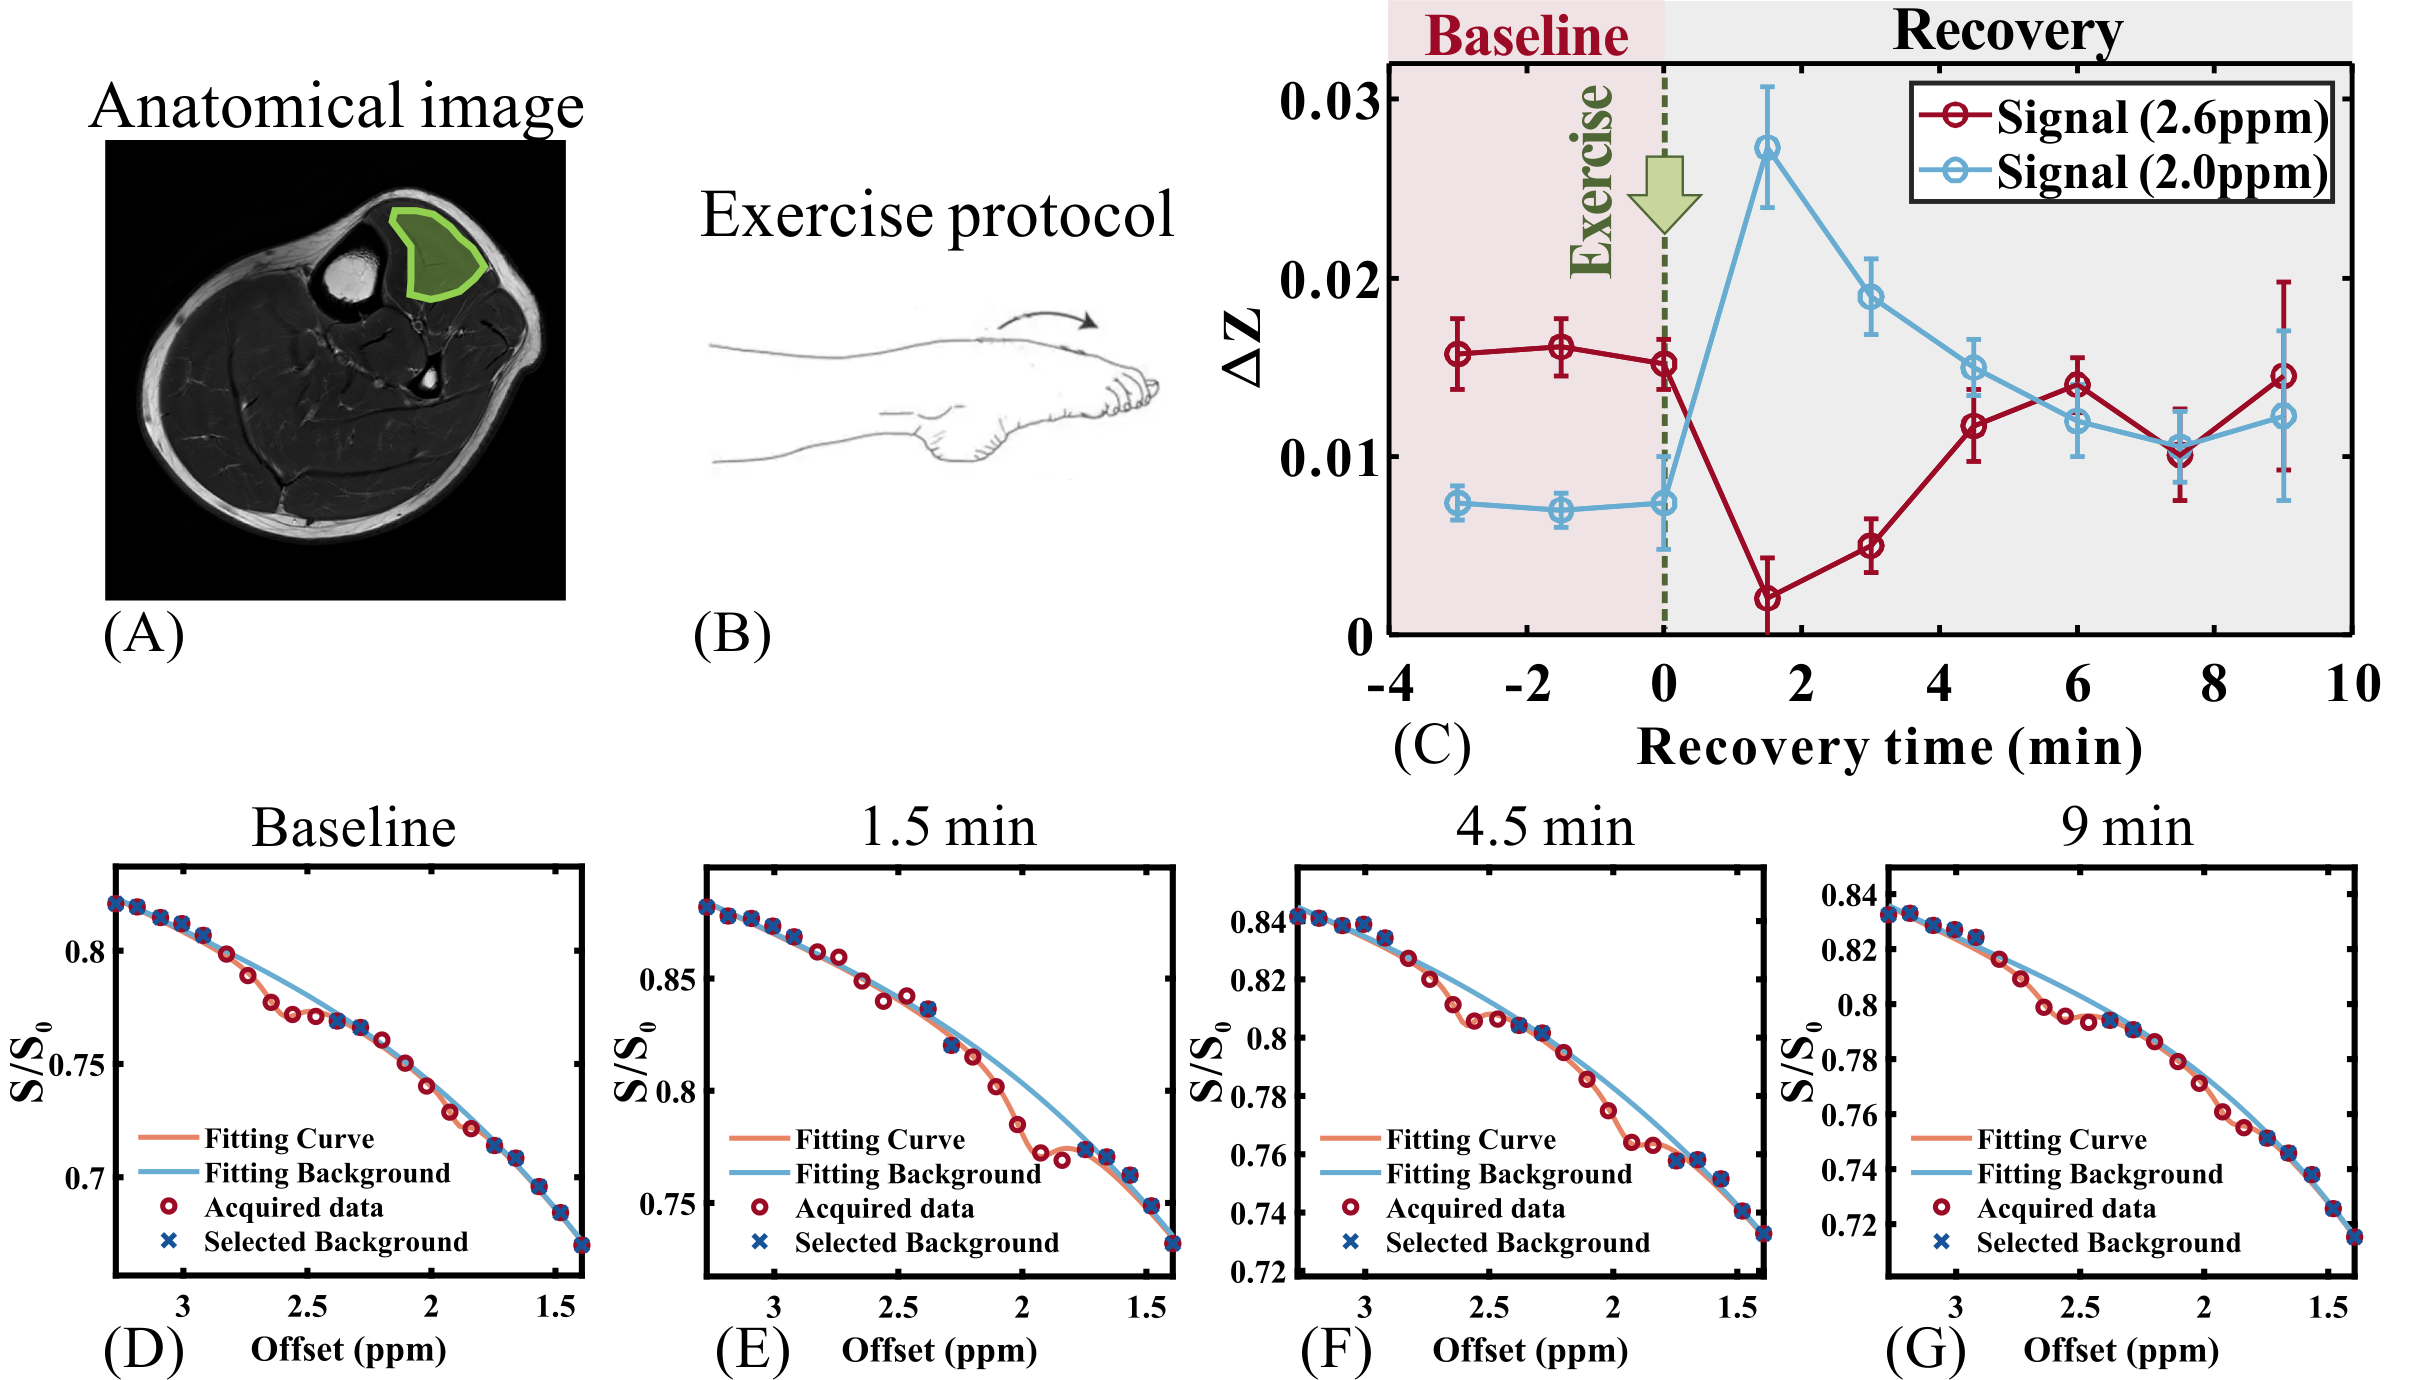
CEST experiment: The CEST imaging on human skeletal muscle was performed on a UIH Jupiter 5 T human MRI system using a 24-channel transmit/receive knee coil. Three healthy subjects (age: 23±2 years; weight: 75±4) were recruited for experiments, and one of them participated in the exercise study, after obtaining their informed written consent. For each CEST image, a continuous wave saturation pulse with a length of 2775 ms (unless otherwise stated) was applied with the frequency offsets stepping from 1.3 ppm to 3.5 ppm (25 points), followed by a single-shot FSE readout. TR/TE = 3000/6.9 ms, slice thickness = 10 mm, matrix size 96 × 96, and FOV 160× 160 mm2. The total time for each scan is 1.5 minutes.Exercise protocol: The subject in the supine position was instructed to complete a mild single-leg plantar flexion exercise in scanner, lifting an 8.5 kg weight by using calf muscles to push a foot pedal at a rate of 1.5 Hz for 120 s. CEST scans were conducted before and immediately after the in-scanner exercise.
Data analysis: After denoising by BOOST7, a two-peak PLOF method8 was implemented to extract the CEST signal at 2.6 ppm and 2.0 ppm from Z-spectrum.
Results and Discussion
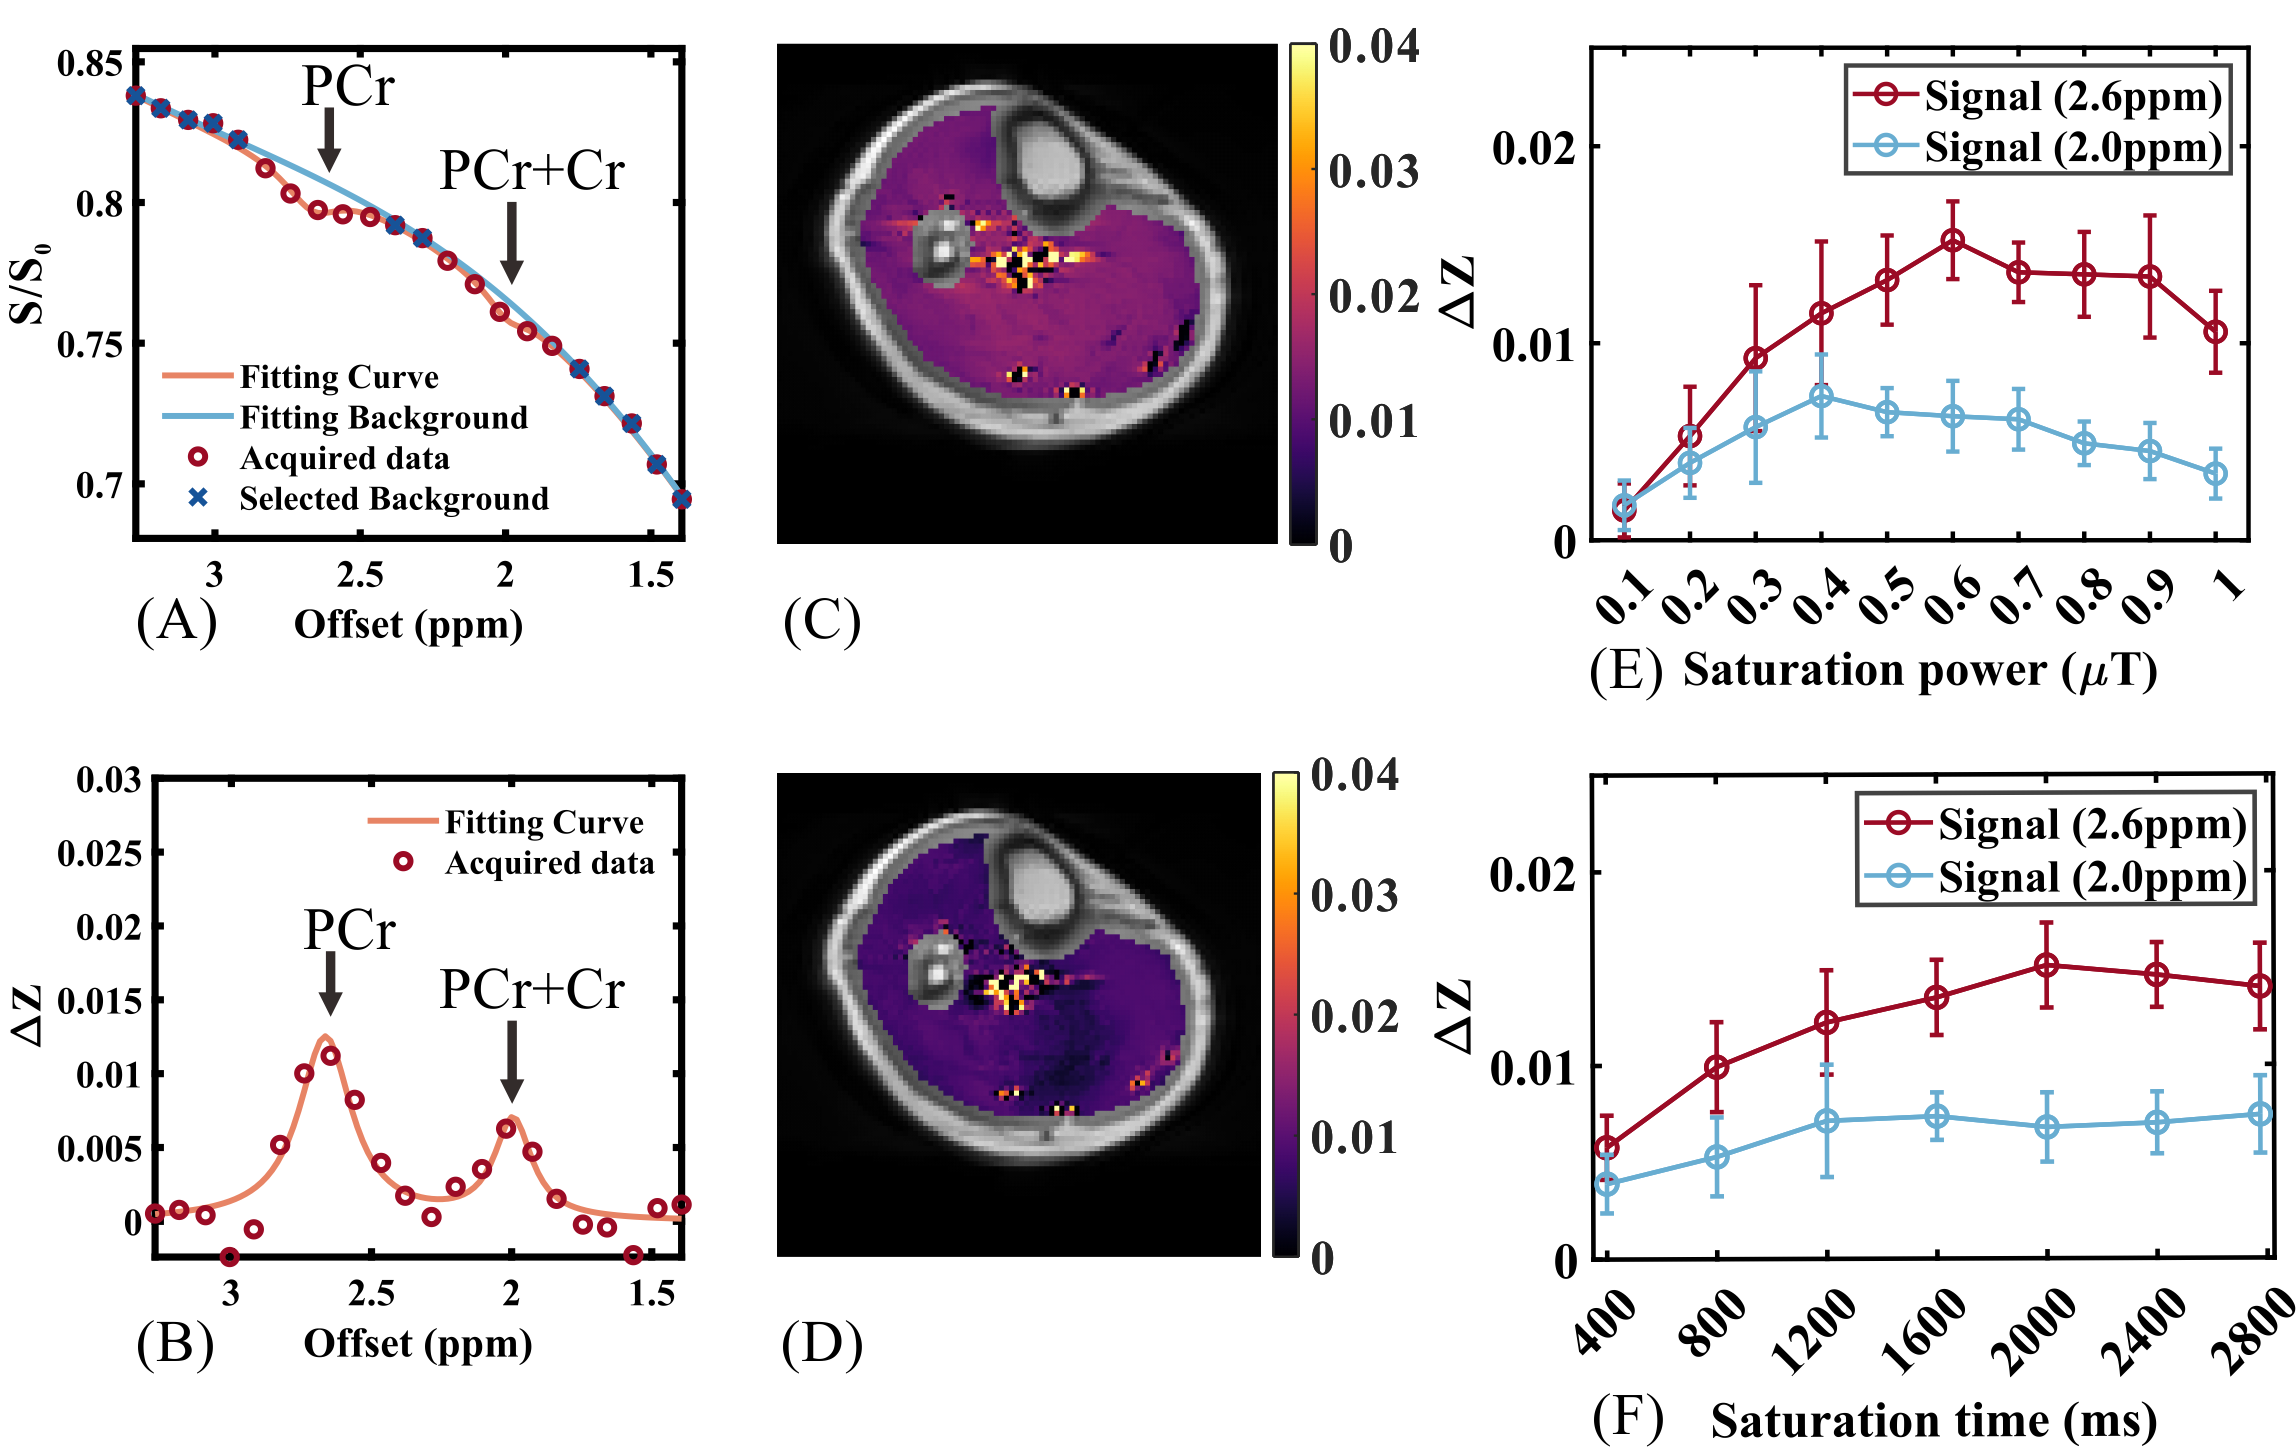
Figure 1A shows a partial Z-spectrum over human calf muscle at rest. Using the PLOF fitting8, the CEST signals at +2.0 ppm (PCr+Cr) and +2.6 ppm (PCr) were extracted and quantified as the peak heights (Figure 1B). A saturation power of 0.6 μT and saturation length of 2775 ms (TR = 3s) yielded satisfactory PCr and Cr contrasts, and were used in the following experiments (Figure 1E, F).The CEST signals for PCr and Cr in calf muscles were monitored dynamically before and after an in-scanner plantar flexion exercise (Figure 2). Immediately after exercise, the tibialis anterior (TA) region of the subject shows a disappearance of PCr signals at 2.6 ppm as well as an enhanced signal at 2.0 ppm (Figure 2D, E), indicating the complete conversion of PCr to Cr. For the first time, a distinct and clean Cr peak at 2 ppm, without the mixture of PCr, was observed on a clinical scanner. This supports that the +2.0 ppm CEST signal was mainly from slow-exchanging Cr in human muscle9. At recovery, the PCr peak at 2.6 ppm gradually returned to baseline, accompanied by the decrease of peak at 2.0 ppm. As illustrated in Figure 2C, we can observe a strong concurrence in the recovery kinetics of both Cr and PCr. However, at 10 mins post-exercise, the +2.0 ppm signal was still elevated compared with baseline, suggesting pH may play a role.
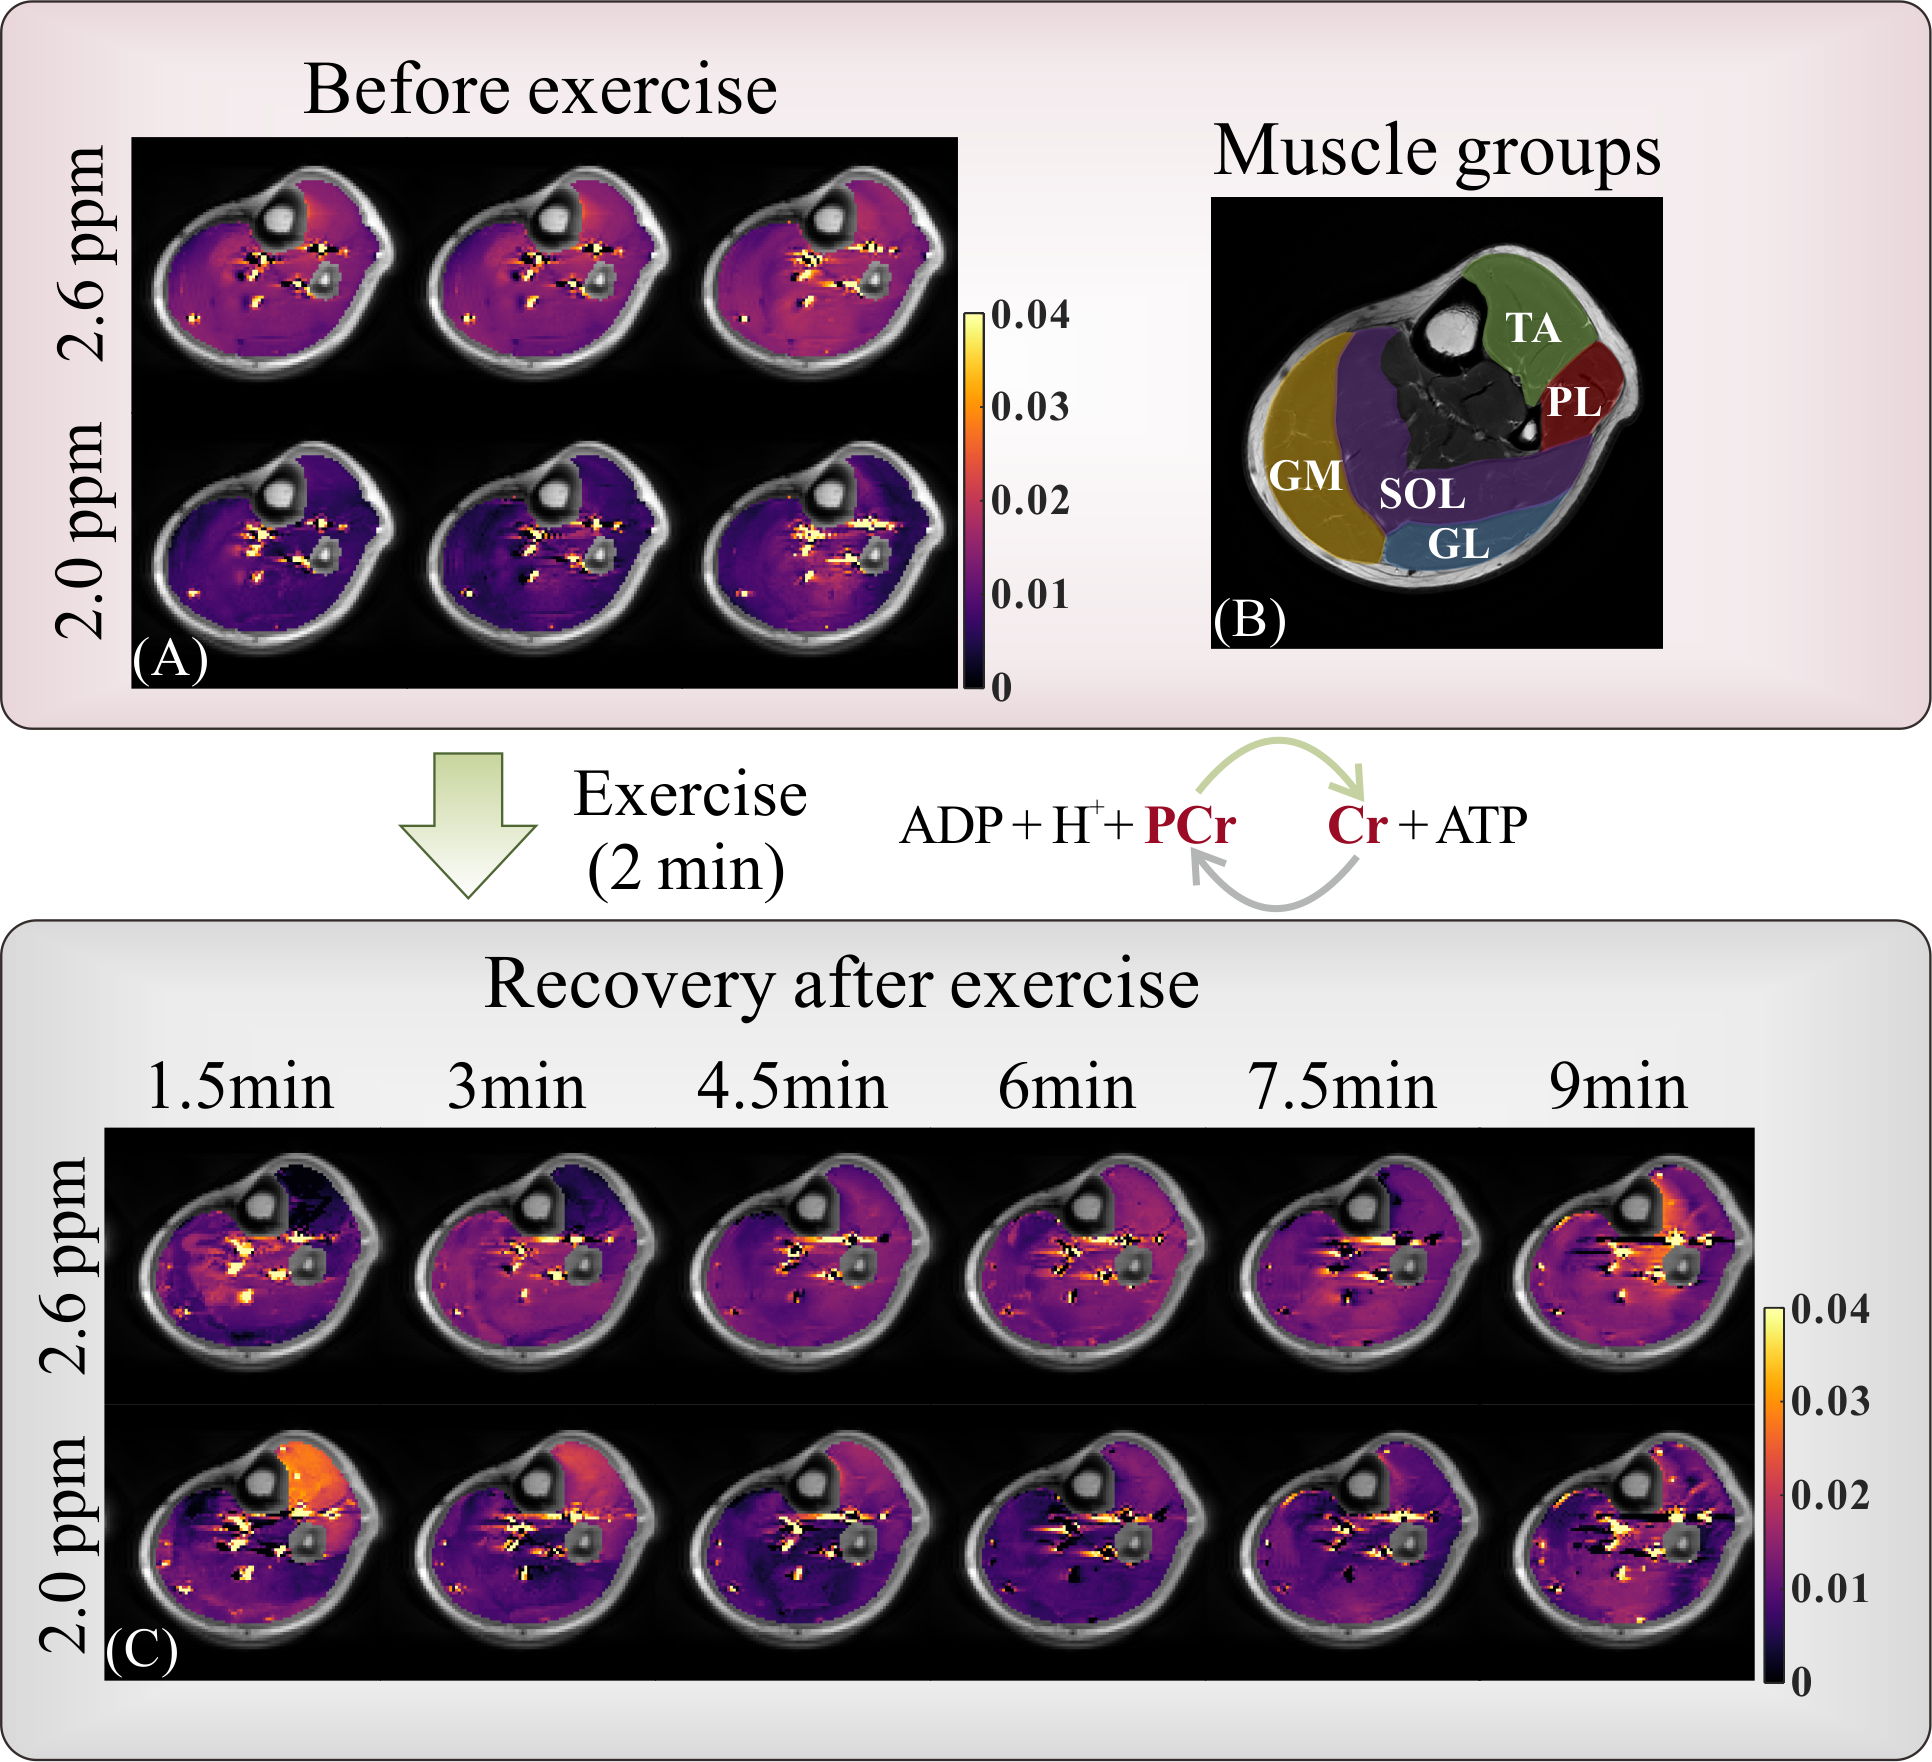
The CEST maps at baseline and recovery are shown in Figure 3. From the first time point post-exercise, the most pronounced PCr depletion is located in the TA and PL muscles, and the recovery time for these muscle groups was around 6 minutes. Moderate PCr and Cr changes were observed in GL and GM, with a recovery time of around 3 minutes, which is consistent with a previous study10. However, due to the limited time resolution (1.5 minutes), the accurate recovery rate cannot be calculated, which requires further study.
Conclusion
Here, we demonstrated that distinct and reliable PCrCEST and CrCEST peaks in human skeletal muscle can be simultaneously observed at 5T, with the potential to facilitate the diagnosis of metabolic dysfunction in muscles.Acknowledgements
This work is supported by National Natural Science Foundation of China, grant numbers: 82171904, 82302151; Shenzhen Science and Technology Program, grant number: JCYJ20220818101213029; Fujian Province Science and Technology Project, grant number: 2022J05013; Xiamen University Nanqiang Outstanding Talents Program; Xiamen University Nanqiang Excellent Doctoral Student Nurturing Program; and Key Laboratory for Magnetic Resonance and Multimodality Imaging of Guangdong Province, grant number: 2023B1212060052.References
1. Kogan F, Haris M, Singh A, Cai KJ, Debrosse C, Nanga RPR, Hariharan H, Reddy R. Method for High-Resolution Imaging of Creatine In Vivo Using Chemical Exchange Saturation Transfer. Magnetic Resonance in Medicine 2014;71(1):164-172.
2. Anderson JD, Epstein FH, Meyer CH, Hagspiel KD, Wang HK, Berr SS, Harthun NL, Weltman A, DiMaria JM, West AM, Kramer CM. Multifactorial Determinants of Functional Capacity in Peripheral Arterial Disease Uncoupling of Calf Muscle Perfusion and Metabolism. Journal of the American College of Cardiology 2009;54(7):628-635.
3. Bottomley PA, Panjrath GS, Lai SH, Hirsch GA, Wu K, Najjar SS, Steinberg A, Gerstenblith G, Weiss RG. Metabolic Rates of ATP Transfer Through Creatine Kinase (CK Flux) Predict Clinical Heart Failure Events and Death. Science Translational Medicine 2013;5(215).
4. Isbell DC, Berr SS, Toledano AY, Epstein FH, Meyer CH, Rogers WJ, Harthun NL, Hagspiel KD, Weltman A, Kramer CM. Delayed calf muscle phosphocreatine recovery after exercise identifies peripheral arterial disease. Journal of the American College of Cardiology 2006;47(11):2289-2295.
5. Kogan F, Haris M, Debrosse C, Singh A, Nanga RP, Cai KJ, Hariharan H, Reddy R. In Vivo Chemical Exchange Saturation Transfer Imaging of Creatine (CrCEST) in Skeletal Muscle at 3T. Journal of Magnetic Resonance Imaging 2014;40(3):596-602.
6. Chen L, Schär M, Chan KWY, Huang JP, Wei ZL, Lu HZ, Qin Q, Weiss RG, van Zijl PCM, Xu JD. In vivo imaging of phosphocreatine with artificial neural networks. Nature Communications 2020;11(1):1072.
7. Chen X, Wu J, Yang Y, Chen H, Zhou Y, Lin L, Wei Z, Xu J, Chen Z, Chen L. Boosting quantification accuracy of chemical exchange saturation transfer MRI with a spatial-spectral redundancy-based denoising method. NMR in biomedicine 2023:e5027. doi: 10.1002/nbm.5027
8. Chen L, Barker PB, Weiss RG, van Zijl PCM, Xu JD. Creatine and phosphocreatine mapping of mouse skeletal muscle by a polynomial and Lorentzian line-shape fitting CEST method. Magnetic Resonance in Medicine 2019;81(1):69-78.
9. Zhang ZQ, Wang KX, Park S, Li A, Li YG, Weiss RG, Xu JD. The exchange rate of creatine CEST in mouse brain. Magnetic Resonance in Medicine 2023;90(2):373-384.
10. Zamani P, Proto EA, Wilson N, Fazelinia H, Ding H, Spruce LA, Davila A, Hanff TC, Mazurek JA, Prenner SB, Desjardins B, Margulies KB, Kelly DP, Arany Z, Doulias PT, Elrod JW, Allen ME, McCormack SE, Schur GM, D'Aquilla K, Kumar D, Thakuri D, Prabhakaran K, Langham MC, Poole DC, Seeholzer SH, Reddy R, Ischiropoulos H, Chirinos JA. Multimodality assessment of heart failure with preserved ejection fraction skeletal muscle reveals differences in the machinery of energy fuel metabolism. Esc Heart Failure 2021;8(4):2698-2712.
Figures