4442
Multi-center comparison of whole-brain high-resolution CEST mapping at ultra-high field using PUSHUP saturation1German Center for Neurodegenerative Diseases (DZNE), Bonn, Germany, 2GIGA-Cyclotron Research Centre-In Vivo Imaging, University of Liège, Liege, Belgium, 3Department of Physics, Norwegian University of Science and Technology, Trondheim, Norway, 4Clinic of Radiology and Nuclear Medicine, St.Olavs University Hospital HF, Trondheim, Norway, 5Department of Physics and Astronomy, University of Bonn, Bonn, Germany
Synopsis
Keywords: CEST / APT / NOE, CEST & MT
Motivation: CEST suffers from saturation inhomogeneities, especially at ultra-high fields. Universal pulses enable calibration-free mitigation of these inhomogeneities. However, it is not obvious how well PUSHUP translates to different scanners.
Goal(s): The goal of this work is to evaluate the feasibility of PUSHUP-CEST to obtain homogeneous whole-brain, high-resolution CEST maps in multi-center studies.
Approach: PUSHUP was calculated using a joined database of three sites. Multiple CEST measurements were performed at each site. The mean CEST amplitudes were compared in four brain segments.
Results: The resulting CEST maps were homogeneous and without major image artifacts. No significant bias could be found between sites.
Impact: PUSHUP allows for high-resolution, whole-brain CEST mapping at 7T. The feasibility of PUSHUP saturation for multi-center CEST studies and the use of joined databases for pulse calculation are demonstrated. No site-bias is found. This fosters CEST mapping in large-scale studies.
Introduction
Whole-brain CEST experiments at ultra-high fields suffer from inhomogenous saturation. Consequently, parallel transmit (pTx)-based approaches have been suggested1,2. PUSH3 saturation uses multiple $$$B_1$$$ shims that homogenize $$$B_1^\text{rms}$$$. PUSHUP4 combines this with the universal pulse technique5. The aim of this work is to assess the feasibility of PUSHUP saturation for multi-center studies.Methods
In a preceding database study, $$$B_0$$$ and $$$B_1$$$ maps were measured at three different sites (1 Siemens 7TPlus, 2 Siemens Terra) in 30 subjects in total. The same type of 32-channel receive, 8-channel transmit coil (Nova Medical) was used. Based on this data, PUSHUP has been calculated and subsequently applied at all sites.The PUSHUP saturation module contained 120 cosine-filtered Gaussian pulses with 15ms duration with an inter-pulse delay of 15ms. Three PUSHUP subpulses have been applied. From the same database, universal binomial-11 GRAPE6 pulses were calculated and used as excitation pulses in a whole-brain multi-shot 3D-EPI readout7, following the saturation module (1.6mm isotropic resolution, volume $$$T_E$$$=4.7s, $$$T_R$$$=7.1ms).
In an ongoing repeatability study, 8, 8 and 7 healthy volunteers (19-61 years) participated at site-A (7TPlus), site-B and site-C, respectively. None of the subjects participated in the database study. Two $$$B_1$$$ amplitudes (80% and 120% of the target $$$B_1$$$ of 0.8uT) for PUSHUP saturation were acquired with 45 off-center frequencies each. EPI reference scans with inverted phase encoding have been acquired. The total acquisition time for the CEST experiments was below 8 minutes. Additionally, a MPRAGE8 and channel-wise $$$B_1$$$ maps were acquired in each subject, using 3DREAM9.
The MPRAGE acquisitions were segmented using antspynet10 and FSL fast11. From the antspynet segmentation cerebral gray matter (GM) and white matter (WM) were inferred. By intersecting the FSL white matter and gray matter segments with the cerebellum mask of antspynet, cerebellar gray matter (cGM) and white matter (cWM) masks were obtained.
From the measured $$$B_1$$$ maps, the $$$B_1^\text{rms}$$$ distribution was calculated. CEST image analysis included denoising12, distortion correction13, motion correction14, $$$B_0$$$-correction, $$$B_1$$$-correction15 and a 5-pool Lorentzian quantification16.
Results
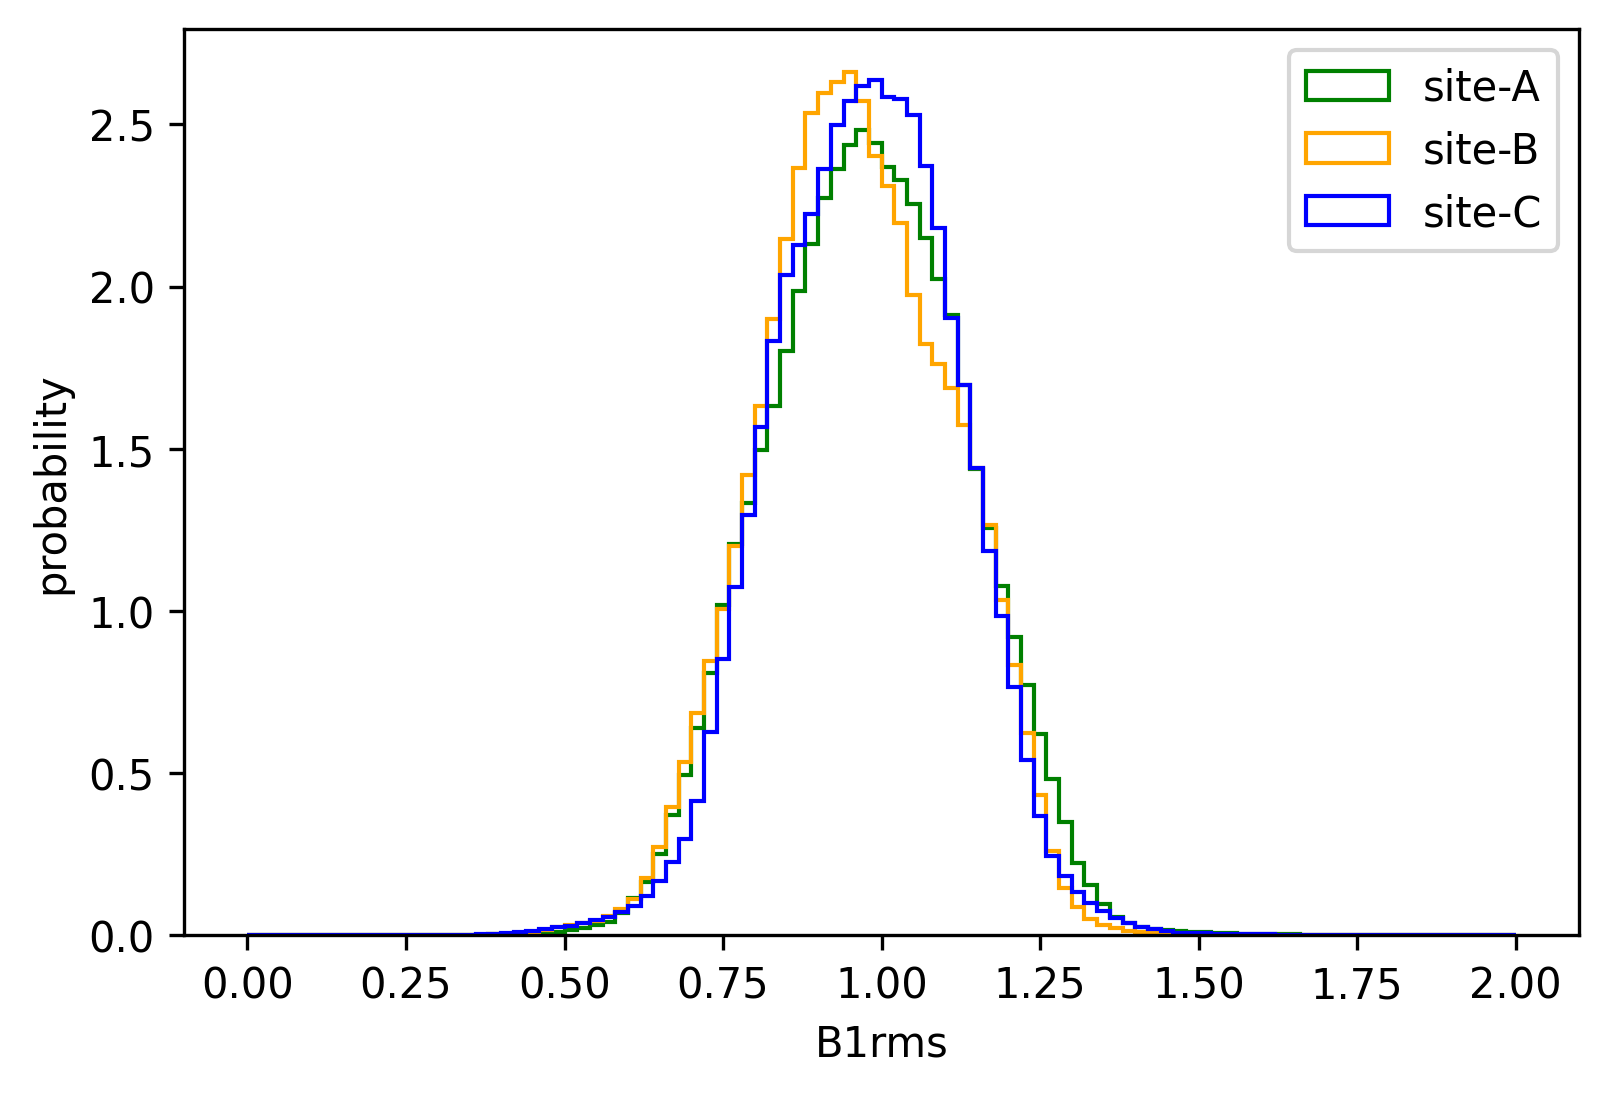
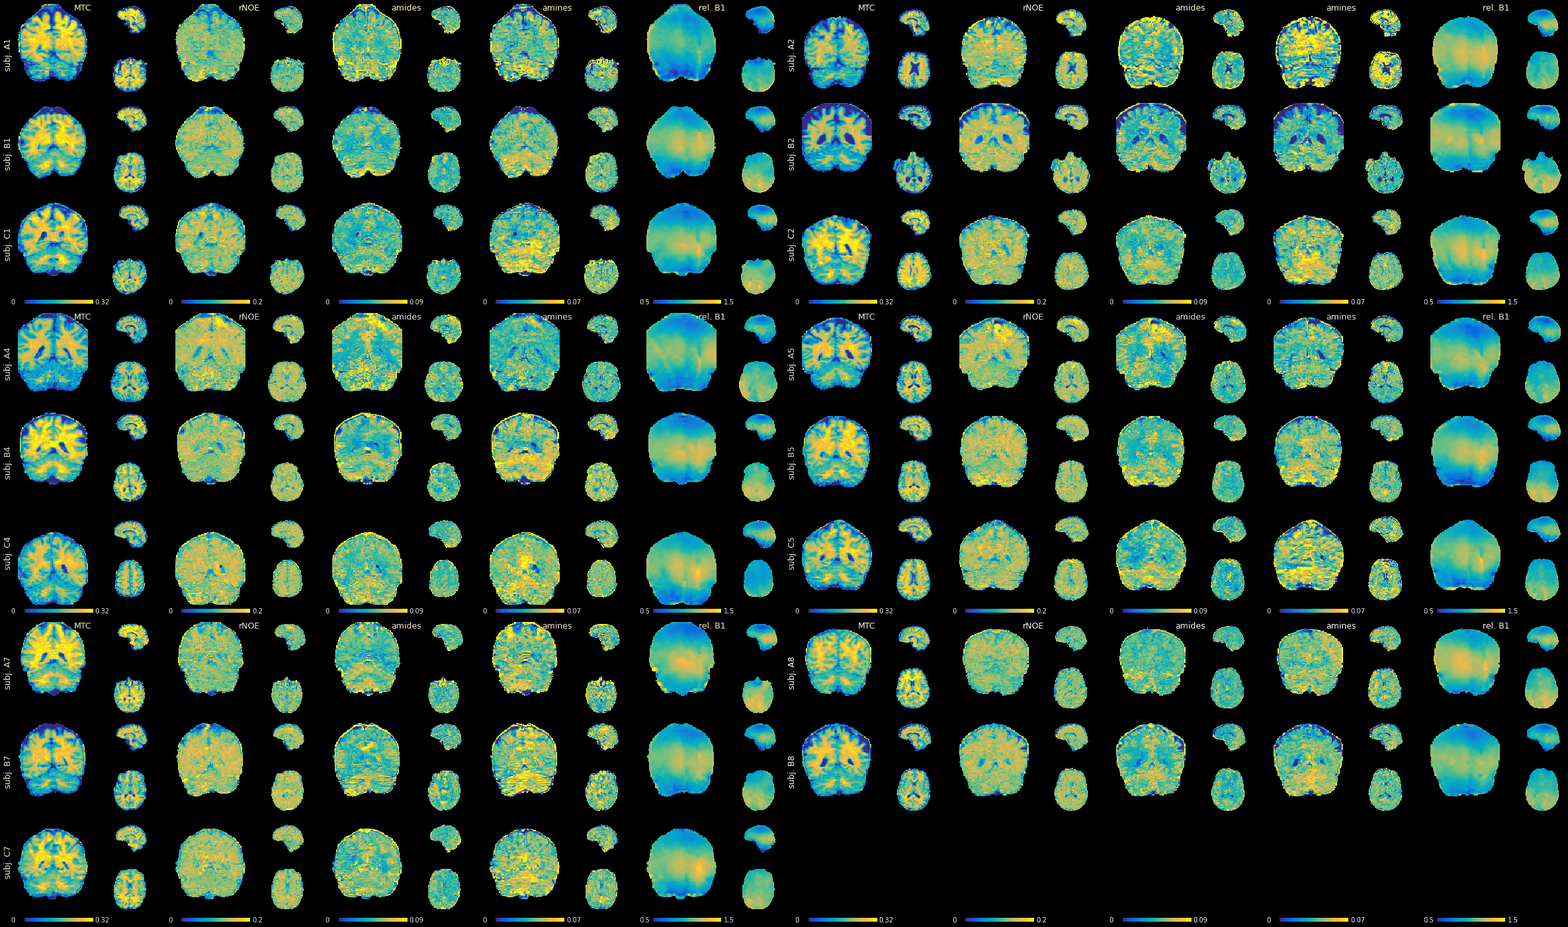
Figure 1 shows the relative $$$B_1^\text{rms}$$$ distribution of all subjects measured at the respective sites. The histograms look monomodal, but a small shoulder can be seen in the distribution of site-B. The peak of each distribution is around 1 and the distribution of site-A is slightly broader.The GIF in Figure 2 shows the CEST maps and the $$$B_1^\text{rms}$$$map of each measured subject. There is some amplitude variations in the $$$B_1^\text{rms}$$$ maps across subjects. The spatial distribution of the residual saturation inhomogeity is similar for all subjects and is much stronger in the longitudinal direction. No major image artifacts can be seen in the maps.
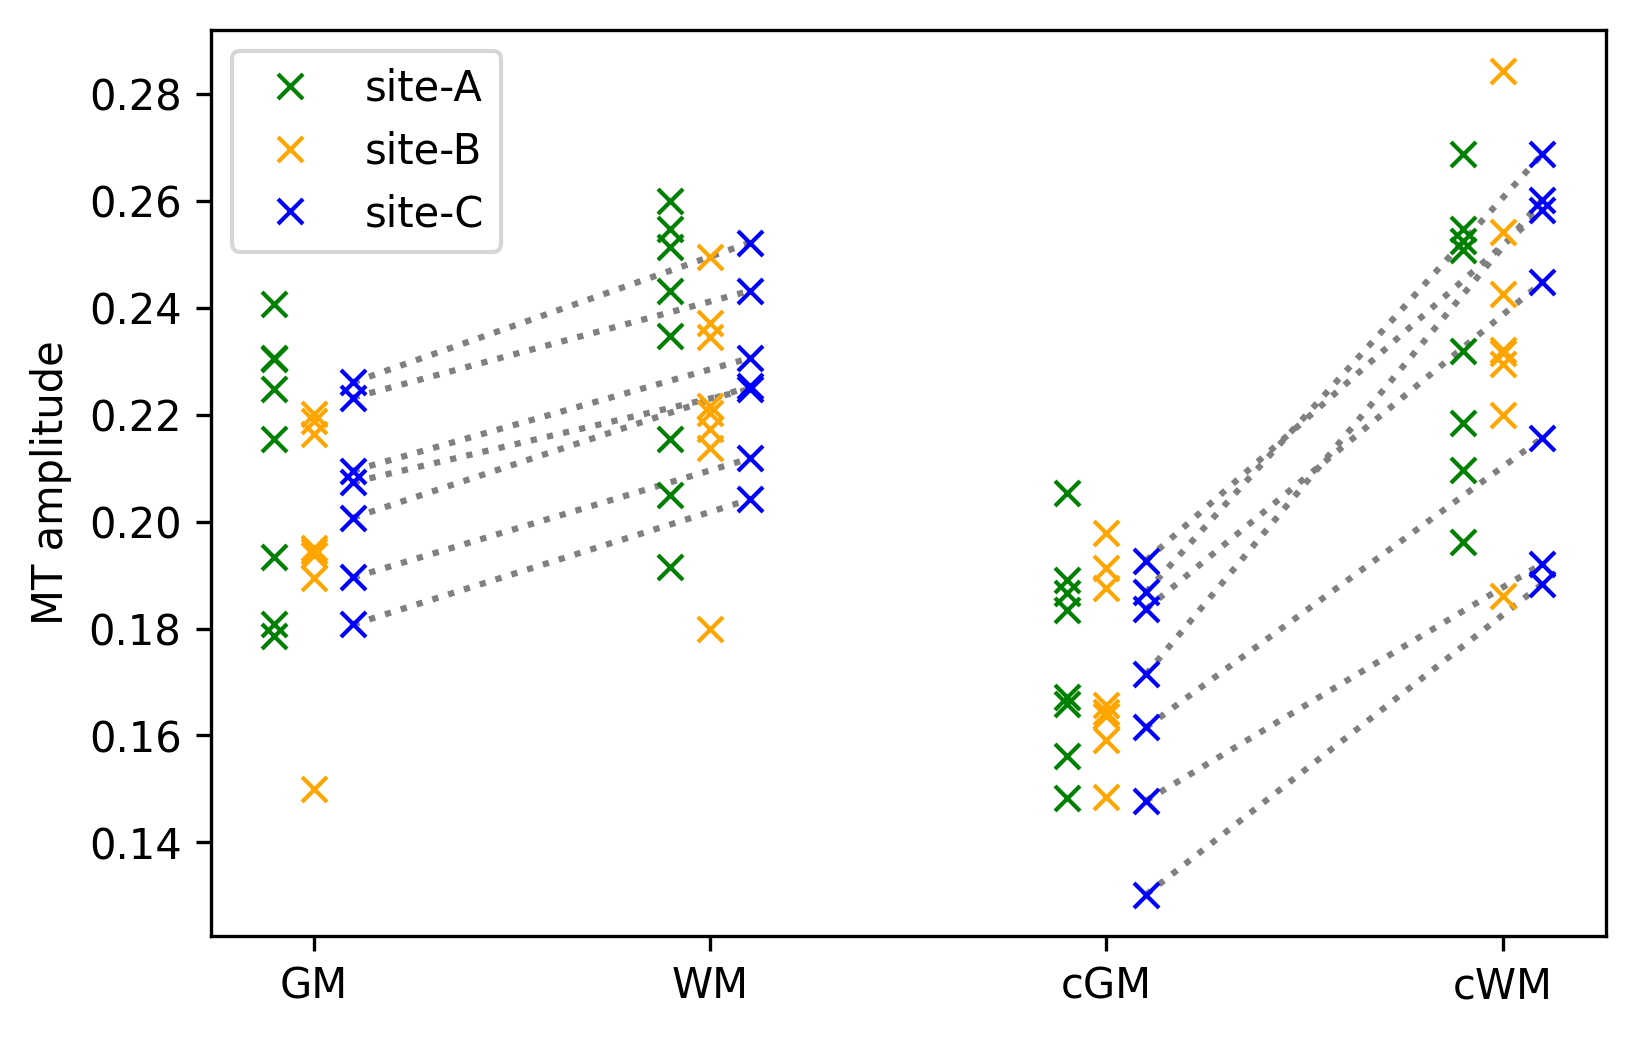
In Figure 3, the mean MT amplitude is depicted in each of the 4 segments (GM, WM, cGM, cWM) for each subject. Gray matter to white matter contrast is clearly visible in both the cerebellum and cerebrum. Wilcoxon ranksum tests showed no significant differences between across sites.
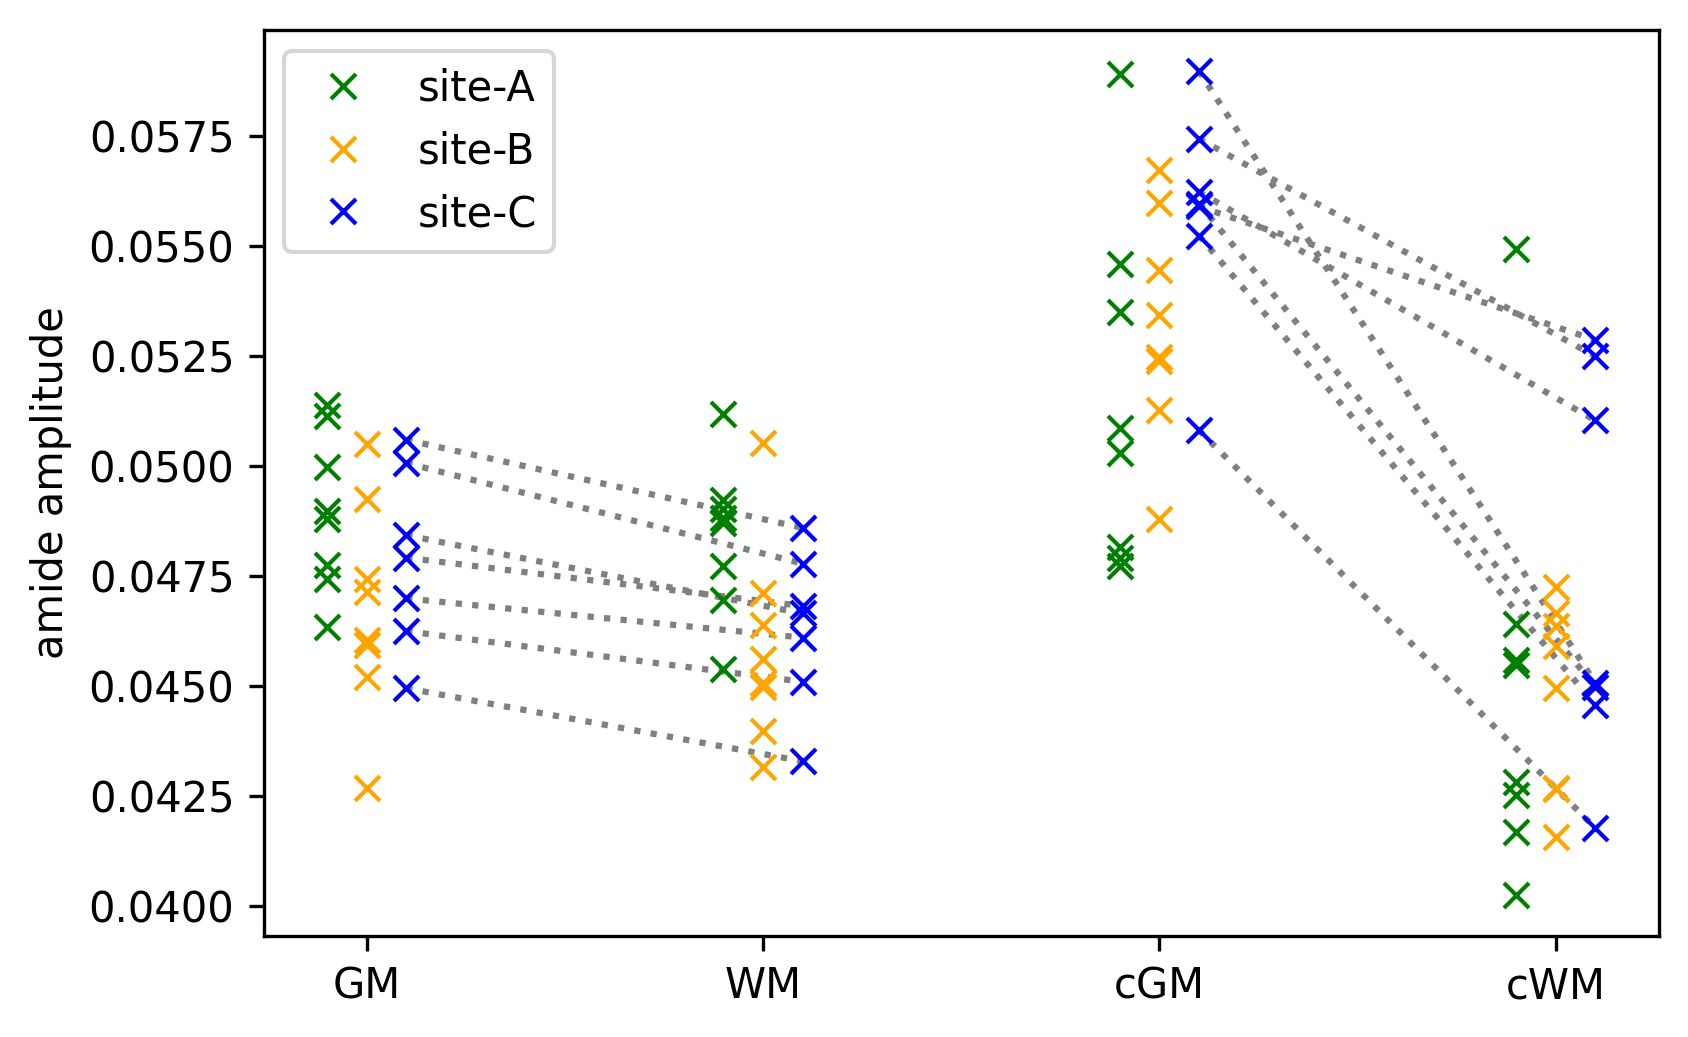
Figure 4 depicts the mean amide amplitude of each subject and segment. Again, the gray matter to white matter contrast is clearly visible. Wilcoxon ranksum tests showed some significant differences across sites, however, not after Bonferroni correction.
Discussion
Whole-brain CEST maps could be measured within 8 minutes of measurement time. No major image artifacts were seen. Clear gray matter to white matter contrast was seen in the CEST maps. No obvious dependence between the CEST maps to $$$B_1^\text{rms}$$$ indicates successful mitigation of residual saturation inhomogeity at all sites.Residual $$$B_1^\text{rms}$$$ inhomogeneity can be explained by coil geometry. The transmit coils are placed in a ring around longitudinal axis. Consequently, the drop in transmit field is similar in this direction for all coil elements. Using $$$B_1$$$ shims, this cannot be compensated for. The overall distribution of $$$B_1^\text{rms}$$$ is similar at all sites. No site-bias of the mean $$$B_1^\text{rms}$$$ could be found.
Analysis of the segmented CEST maps shows a clear gray matter to white matter contrast in both, the MT contrast and the amide contrast. The contrast is stronger in the cerebellum than in the cerebrum. No significant difference in mean MT signal could be identified in any of the brain regions between the sites. After Bonferroni correction, there were also no significant differences between the mean amide amplitude between sites. This indicates that PUSHUP saturation can be applied to multi-center studies. However, more data would allow for a more detailed analysis of potential differences.
Conclusion
PUSHUP saturation pulses, calculated from a multi-center database, could successfully be applied in a multi-center study. In a preliminary analysis of 23 subjects, no site-bias could be observed.Acknowledgements
This work received financial support through the German Federal Ministry of Education and Research (BMBF; funding code 01ED2109A) as part of the SCAIFIELD project under the aegis of the EU Joint Programme - Neurodegenerative Disease Research (JPND) (www.jpnd.eu).References
1. Tse Desmond H.Y., Silva Nuno Andre, Poser Benedikt A., Shah N. Jon. B1+ inhomogeneity mitigation in CEST using parallel transmission. Magnetic Resonance in Medicine. 2017;78(6)
2. Liebert Andrzej, Zaiss Moritz, Gumbrecht Rene, et al. Multiple interleaved mode saturation (MIMOSA) for B1+ inhomogeneity mitigation in chemical exchange saturation transfer. Magnetic Resonance in Medicine. 2019;82(2)
3. Leitão David, Tomi-Tricot Raphael, Bridgen Pip, et al. Parallel transmit pulse design for saturation homogeneity (PUSH) for magnetization transfer imaging at 7T. Magnetic Resonance in Medicine. 2022
4. Völzke Yannik et al PUSHUP-CEST: Calibration-free homogeneous saturation for ultra-high field CEST imaging. ISMRM 2023
5. Gras Vincent, Vignaud Alexandre, Amadon Alexis, Le Bihan Denis, Boulant Nicolas. Universal pulses: A new concept for calibration-free parallel transmission. Magnetic Resonance in Medicine. 2017;77(2):635–643.
6. Van Damme L, Mauconduit F, Chambrion T, Boulant N, Gras V. Universal nonselective excitation and refocusing pulses with improved robustness to off-resonance for Magnetic Resonance Imaging at 7 Tesla with parallel transmission. Magn Reson Med. 2021 Feb;85(2)
7. Akbey Suzan, Ehses Philipp, Stirnberg Rüdiger, Zaiss Moritz, Stöcker Tony. Whole-brain snapshot CEST imaging at 7 T using 3D-EPI. Magnetic Resonance in Medicine. 2019;82(5)
8. Mugler and Brookeman. Three-dimensional magnetization-prepared rapid gradient-echo imaging (3D MP RAGE). Magnetic Resonance in Medicine. 1990;15(1)
9. Ehses Philipp, Brenner Daniel, Stirnberg Rüdiger, Pracht Eberhard D., Stöcker Tony. Whole-brain $B_1$-mapping using three-dimensional DREAM. Magnetic Resonance in Medicine. 2019
10. Tustison Nicholas J., Cook Philip A., Holbrook Andrew J., et al. The ANTsX ecosystem for quantitative biological and medical imaging. Scientific reports. 2021;11(1)
11. Zhang, Y. and Brady, M. and Smith, S. Segmentation of brain MR images through a hidden Markov random field model and the expectation-maximization algorithm. IEEE Trans Med Imag, 20(1):45-57, 2001
12. Manjón José V., Coupé Pierrick, Martí-Bonmatí Luis, Collins D. Louis, Robles Montserrat. Adaptive non-local means denoising of MR images with spatially varying noise levels. Journal of Magnetic Resonance Imaging. 2010;31(1):192–203
13. Andersson Jesper L.R., Skare Stefan, Ashburner John. How to correct susceptibility distortions in spin-echo echo-planar images: Application to diffusion tensor imaging. NeuroImage. 2003;20(2):870–888
14. Jenkinson Mark, Bannister Peter, Brady Michael, Smith Stephen. Improved optimization for the robust and accurate linear registration and motion correction of brain images. NeuroImage. 2002;17(2)
15. Windschuh Johannes, Zaiss Moritz, Meissner Jan Eric, et al. Correction of B1-inhomogeneities for relaxation-compensated CEST imaging at 7T. NMR in Biomedicine. 2015;28(5):529–537.
16. Zaiss Moritz, Windschuh Johannes, Paech Daniel, et al. Relaxation-compensated CEST-MRI of the human brain at 7T: Unbiased insight into NOE and amide signal changes in human glioblastoma. NeuroImage. 2015
Figures