4441
A generalized QUCESOP method for amide and NOE quantification in rat brain tumor1Public Health Science and Engineering College,Tianjin University of Traditional Chinese Medicine, Tianjin, China, 2MR Research China, GEHealthcare, Beijing, China, 3Center for Biomedical Imaging Research, School of Medicine, Tsinghua University, Beijing, China, 4Center for MRI Research, Academy for Advanced Interdisciplinary Studies, Peking University, Beijing, China
Synopsis
Keywords: CEST / APT / NOE, CEST & MT
Motivation: Current CEST quantification methods only calculated the fractional concentration fb and the exchange rate kb for each solute pool, but consider R2b as a constant.
Goal(s): To quantify the change of b, kb and R2b corresponding to the amide and NOE pool in brain tumor imaging of rats.
Approach: Partial Z-spectra around the target frequency offsets were acquired using several saturation amplitudes, and the QUCESOP method was employed to fit the parameters of the amide solute and the “NOE solute” respectively.
Results: Tumor exhibited higher R2b and lower fb for “NOE solute”, with a slightly-elevated amide pool size, compared with the normal tissue.
Impact: Tumor displayed an increase of R2b and a decrease of fb for the “NOE solute”, that originated from the aliphatic protons on the macromolecular pool. The larger R2b may reflect the increased cell density in the tumor region.
Purpose
CEST imaging have being intensively studied in brain tumors, with the APTw imaging being the most successful type that got FDA-approval. Apart from the amide signal, recently the contribution from NOE signal that originated from macromolecular aliphatic protons have drawn many attentions1,2. Using advanced model-fitting methods including Lorentzian fitting, the BM model or the R1ρ relaxation mode, a decrease in fractional concentration (fb) for “the NOE solute” were reported1,2. However, these studies always consider the transversal relaxation rate (R2b) as a constant. Therefore, the interpretation of NOE signals at brain tumor remains unclear. Recently, it is indicated that the “NOE solute” could also be modeled by the R1ρ relaxation model3. In this study, the CE-parameters of the amide solute and the NOE solute in normal brain tissue and tumor tissue are quantified by using a generalized QUCESOP method.Method
C6 glioma cells were injected into six rats’ brain. A 9.4 T MRI scanner was used in the experiment. Continuous-waved pulse with a length of 1.5 s was taken as the saturation pulse in the CEST sequence. Partial Z-spectra around the target frequency offsets were acquired using five saturation amplitudes (0.4 μT, 0.7 μT, 1.0 μT, 1.3 μT, 1.6 μT). For amide, Δω is from +3.2 ppm to +4.0 ppm with a step of 0.05 ppm; for the NOE solute, Δω varied from -5.0 ppm to -3.0 ppm with a step of 0.1 ppm. SE-EPI with TR=2.0 s was used for a single-slice CEST imaging. A Z-spectrum from -15 ppm to +15 ppm was also acquired with B1=1.0 μT. B0, B1, T1 and T2 maps were also collected4. Similar to the QUCESOP method4, after transforming the Z-values to R1ρ values, pixel-wise fitting using the simplified R1ρ relaxation model was performed. The values of each fitted parameter in normal brain and tumor were averaged and compared by applying t-test. The ΔR1ρ calculation6 and the Lorentzian difference (LD) analysis7 was also applied on the Z-spectrum data.Result
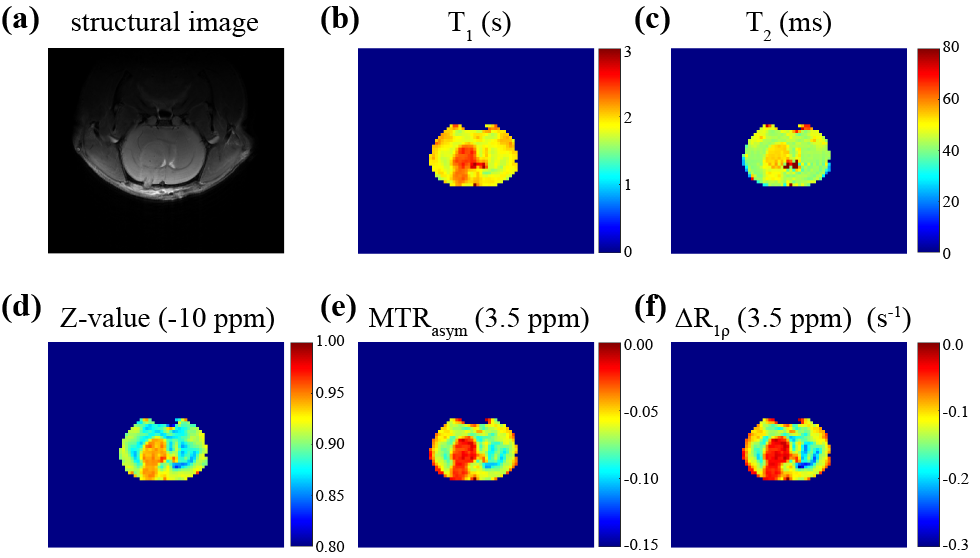
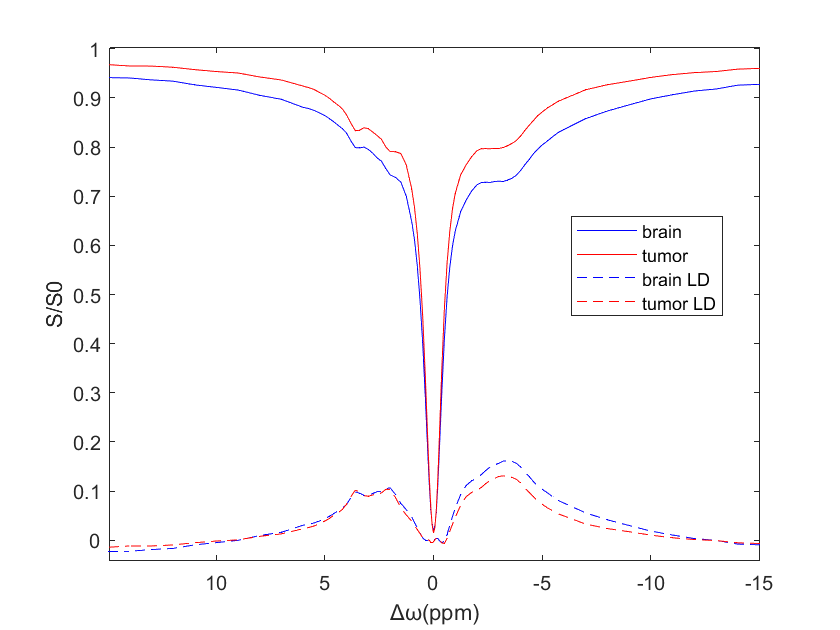
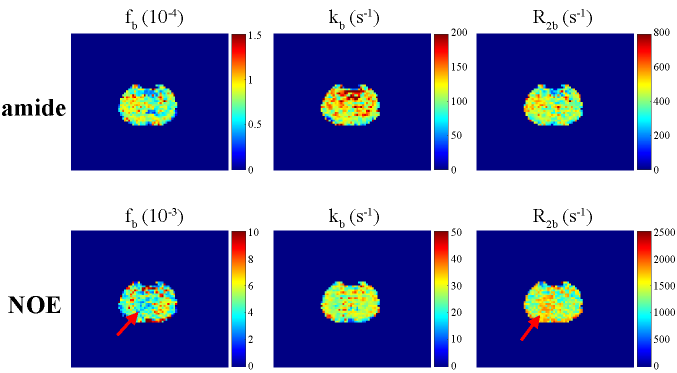
The values of T1 and T2 in tumor is higher than the normal brain tissue (Fig. 1b, 1c). Besides, MT image with Δω=-10 ppm, MTRasym and ΔR1ρ images with Δω=+3.5 ppm also clearly illustrate the tumor region (Fig. 1d-f). The LD result indicates a distinction in the NOE signal between tumor and normal brain tissue, while no difference of the amide signal could be found (Fig. 2). A significantly larger R2b in tumor tissue than in normal brain tissue is shown in Fig. 3 and Fig. 4. Besides, fb of the NOE solute is significantly smaller in tumor than in normal tissue, while fb of the amide solute increases in tumor than in normal tissue (Fig. 3, 4). The fb changes of NOE and amide are in line with the viewpoints of a reduced aliphatic macromolecules and an increment of mobile protein molecules in tumor region, respectively. There is no significant difference between the two types of tissue on the other parameters of amide and NOE solute.Discussion and Conclusion
This study calculated three parameters, fb, kb and R2b, or a dedicated description of “the NOE solute”. Although previous studies reported the decreased NOE signal at tumor region, the interpretation is challenging. Herein, we included both the peak and line-width information, and estimate fb, kb and R2b based on a simplified R1ρ model. The CEST signal acquisition strategy of using multiple saturation offset and multiple saturation power is crucial for quantification of the parameters. Noted that, in the current fitting algorithm, the “NOE solute” is simplified as a single chemical-exchanging pool, despite the fact that it contains multiple kinds of macromolecules and a relayed transfer process5. A more accurate models would be recommended for quantifying the NOE signal.Our study suggested an increased R2b, a reduced fb and an unchanged kb for “the NOE solute”. This may help explanation of Z-spectral changes in tumor region, i.e., the reduced fb may reflect myelin and neuronal loss, while the increased R2b suggest a higher cell-density in glioma.
Acknowledgements
This work was supported by the New Teachers’ Research Program of Tianjin University of Traditional Chinese Medicine (XJS2022116), Tianjin Municipal Education Commission Scientific Research Program (2022KJ162), National Key R&D Program of China 2022YFC3602500, 2022YFC3602503 and National Natural Science Foundation of China (NSFC) (Nos. 82071914). The authors thank the National Center for Protein Sciences at Peking University in Beijing, China, for assistance with the MRI data acquisition and data analyses.References
1. Zhou J, Zaiss M, et al Review and consensus recommendations on clinical APT-weighted imaging approaches at 3T: Application to brain tumors. Magn Reson Med. 2022; 88:546-574.
2. Junzhong Xu, Moritz Zaiss, Zhongliang Zu et al., On the origins of chemical exchange saturation transfer (CEST) contrast in tumors at 9.4 T, NMR Biomed. 2014; 27: 406-416.
3. Tao Jin, Seong-Gi Kim. Role of chemical exchange on the relayed nuclear Overhauser enhancement signal in saturation transfer MRI. Magn. Reson. Med. 2022. 87: 365-376.
4. Yi Wang, Pengyu Li, Jia-Hong Gao. Quantifying the fractional concentrations and exchange rates of small-linewidth CEST agents using the QUCESOP method under multi-solute conditions in MRI signals. Magn. Reson. Med. 2021; 85: 268-280.
5. Zhou Y, Bie C, van Zijl PCM, Xu J, et al. Detection of electrostatic molecular binding using the water proton signal. Magn Reson Med. 2022; 88:901-915.
6. Yi Wang, Yaoyu Zhang, et al. Perturbation of longitudinal relaxation rate in rotating frame (PLRF) analysis for quantification of chemical exchange saturation transfer signal in a transient state. Magn. Reson. Med. 2017; 78:1711–1723.
7. Yanrong Chen, Yaozong Sun, Chongxue Bie et al. Hierarchical K-means clustering method for accelerated Lorentzian estimation (KALE) in chemical exchange saturation transfer-magnetic resonance imaging quantification. Quant. Imaging Med. Surg. 2023; 13: 4350–4364.
Figures