4440
Can the Relayed Nuclear Overhauser Enhancement Effect at -1.6 ppm Provide Unique Contrast in an Ischemic Stroke Model?1Department of Mechatronics and Biomedical Engineering, Lee Kong Chian Faculty of Engineering and Science, Universiti Tunku Abdul Rahman, Kajang, Malaysia
Synopsis
Keywords: CEST / APT / NOE, CEST & MT
Motivation: NOE(-1.6 ppm) may provide vital information about a different stage of the ischemic cascade, allowing for a more in-depth analysis of ischemic injury.
Goal(s): To investigate whether NOE(-1.6 ppm) can uncover new insights into ischemic injury.
Approach: CEST data in an ischemic stroke model were acquired to compare the information provided by NOE(-1.6 ppm) with that obtained from PWI, DWI, and APT.
Results: NOE(-1.6 ppm) was observed to be lower in the ischemic region, with the deficit areas being equal to or larger than the ADC deficit areas but smaller than the AREX(3.5 ppm) deficit areas.
Impact: NOE(-1.6 ppm) offers unique contrast compared to PWI, DWI, and APT imaging in ischemic tissues. Altogether, the mismatches reveal four zones of increasing sizes within the ischemic tissue, potentially reflecting different pathophysiological information.
Introduction
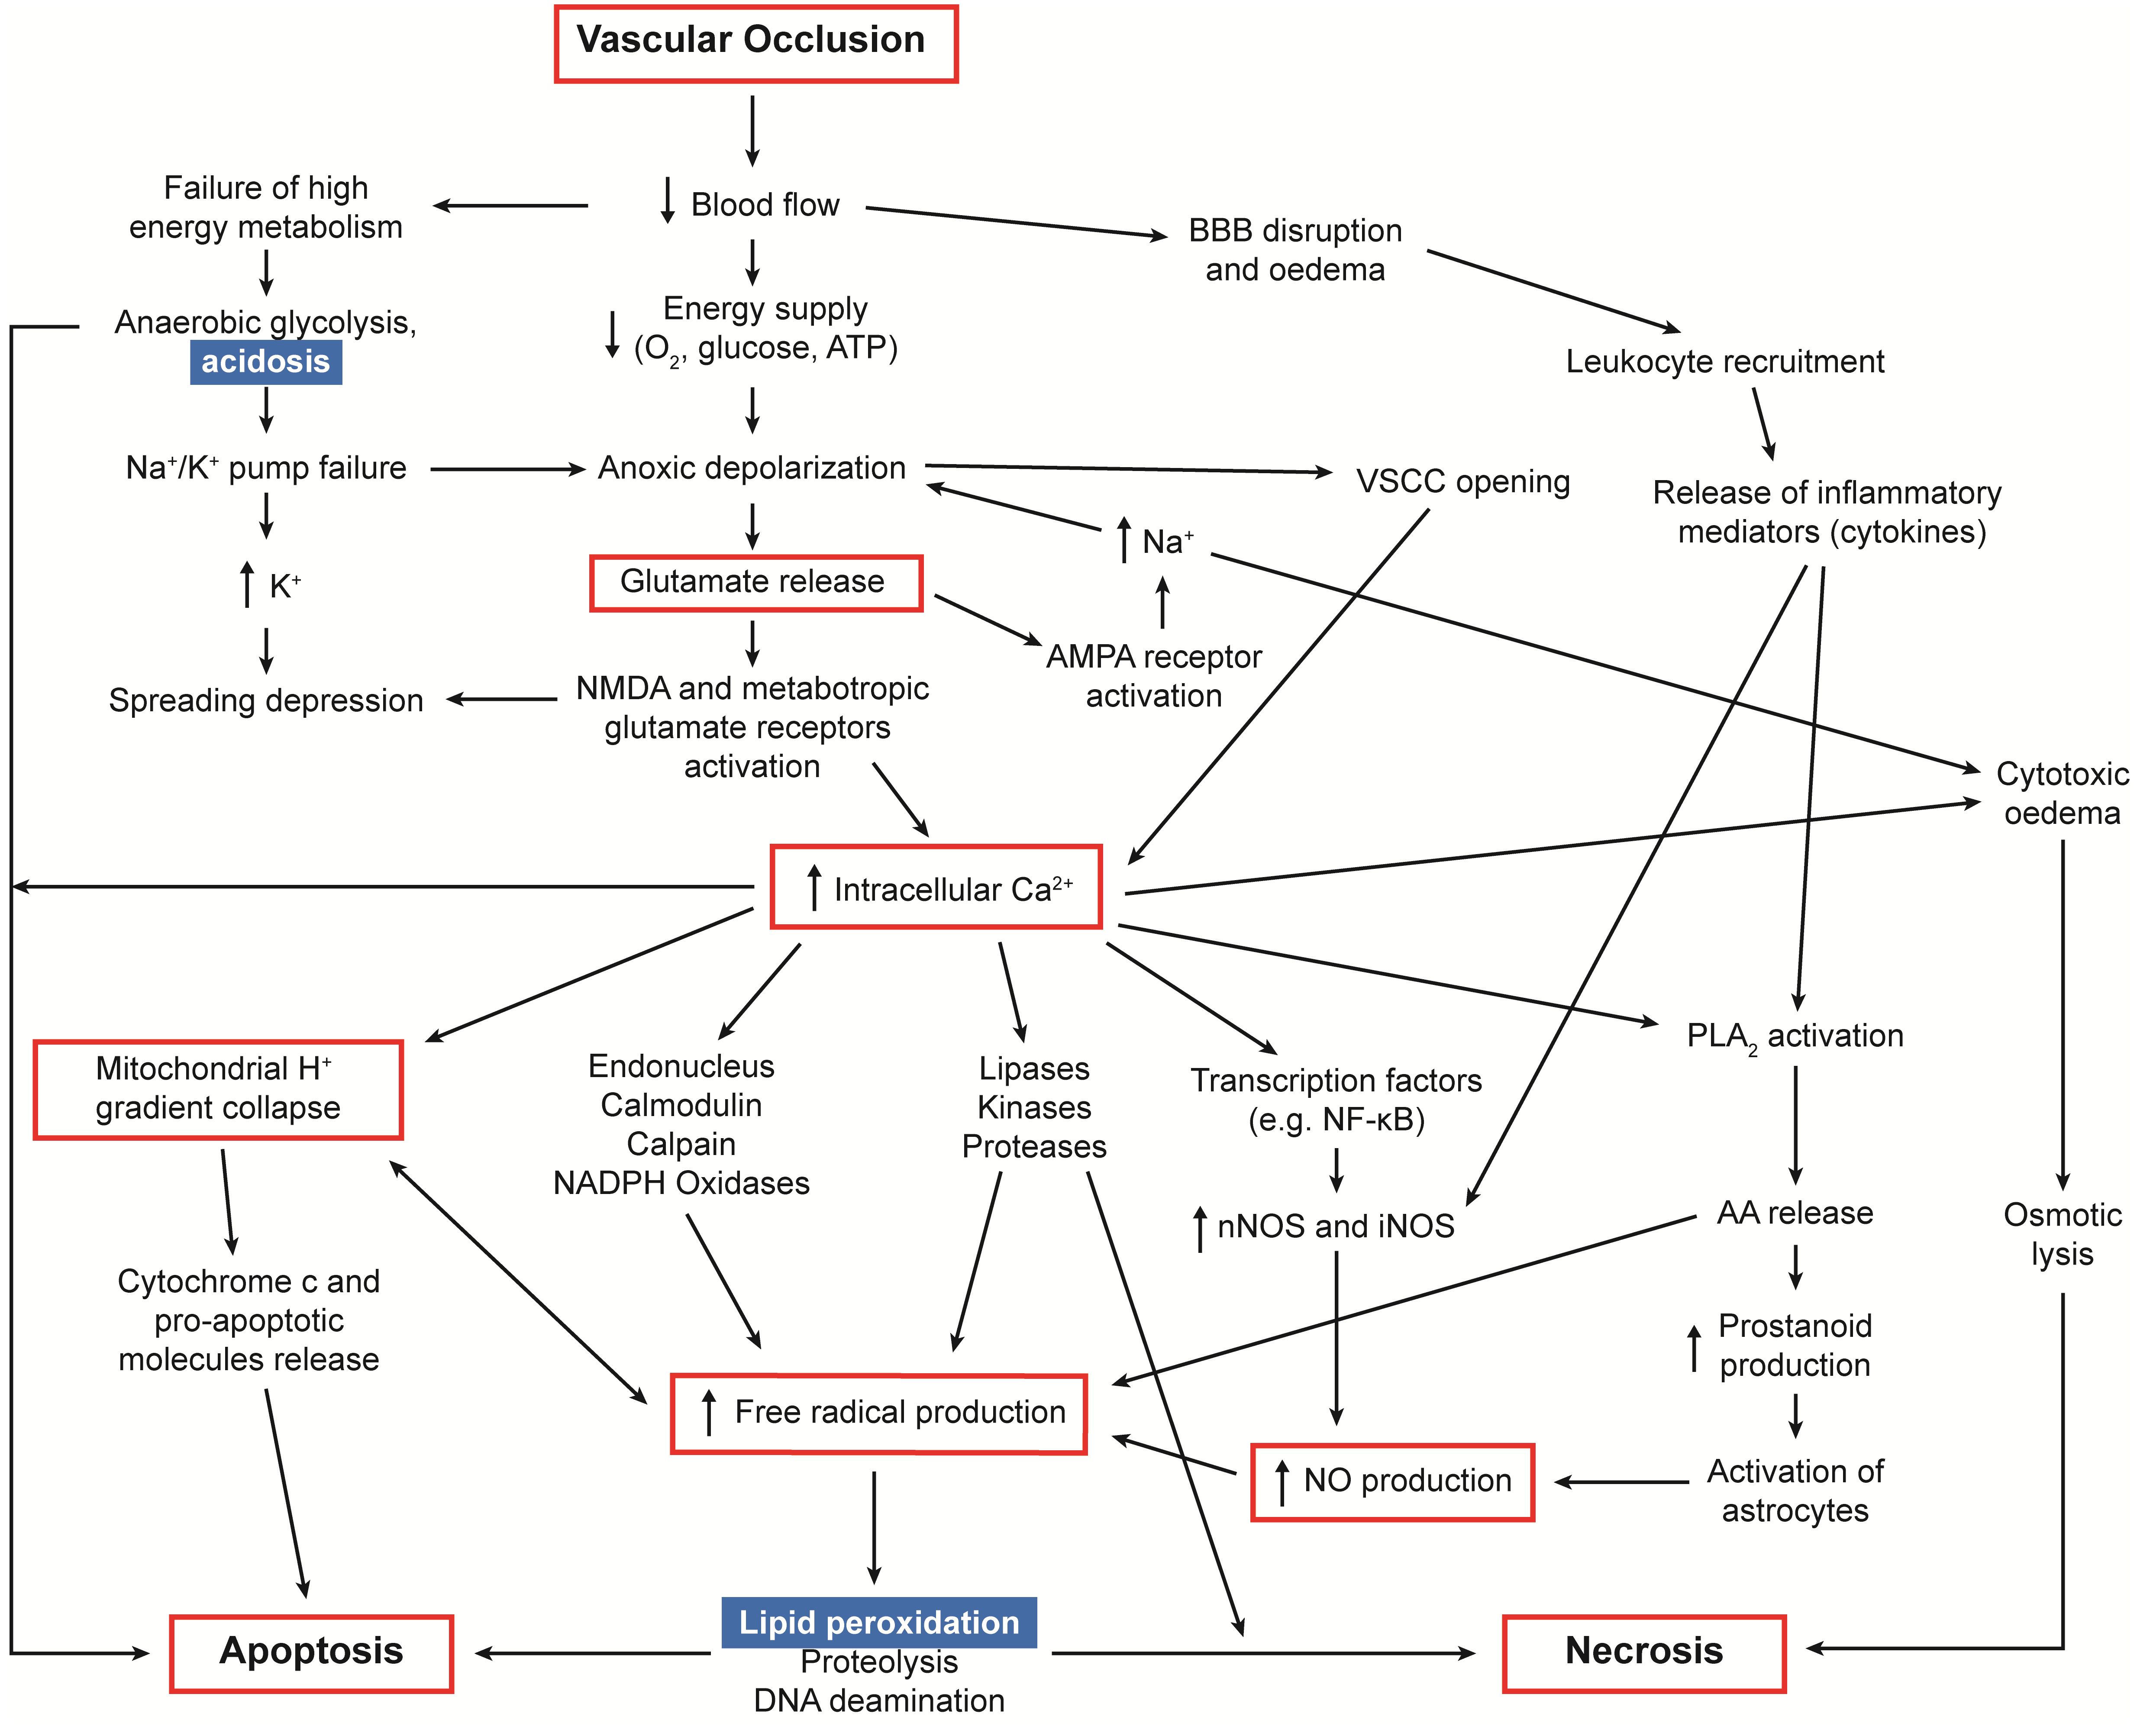
After an ischemic stroke, the brain undergoes a cascaded and complex physiological adaptation in an attempt to maintain tissue viability, known as the ischemic cascade (Figure 1) 1. Since lipid peroxidation occurs just before cell death, any saturation transfer mechanism related to membrane phospholipids may be sensitive to the subsequent changes in the membrane and can potentially act as a biomarker to identify tissue affected by lipid peroxidation and at immediate risk of cell death. Recent studies have shown that the relayed nuclear Overhauser enhancement effect at -1.6 ppm, NOE(-1.6 ppm), potentially arises from membrane choline phospholipids, although the exact pathway of the observed effect has yet to be elucidated 2,3. This may provide vital information about a different stage of the ischemic cascade, allowing for a more in-depth analysis of ischemic injury and, thus, a precise diagnosis. In this work, chemical exchange saturation transfer (CEST) data in an ischemic stroke model were acquired to study whether NOE(-1.6 ppm) can reveal information about ischemic injury, which may complement conventional magnetic resonance imaging (MRI) techniques such as diffusion-weighted imaging (DWI), perfusion-weighted imaging (PWI), and pH-weighted imaging, such as amide proton transfer (APT).Methods
DWI, PWI, CEST and T1 data were acquired from five rats that underwent MRI at 9.4 T after middle cerebral artery occlusion. The apparent diffusion coefficient (ADC), cerebral blood flow (CBF), and apparent exchange-dependent relaxations (AREX) at 3.5 ppm were calculated 1. NOE(-1.6 ppm) was quantified using a different approach, $$$NOE(-1.6 ppm) = \frac{\frac{1}{Z(-1.6 ppm)}-Z_{ref}}{T_{1w}}$$$, where $$${T_{1w}}$$$ is the water relaxation time and $$$Z_{ref}$$$ is the ratio of two nearby offsets that are far from 0 ppm instead of the opposite offset (1.6 ppm). This is because there might be contaminations from the amine effect (around 2 ppm) if the opposite offset was used as the reference 4.Results
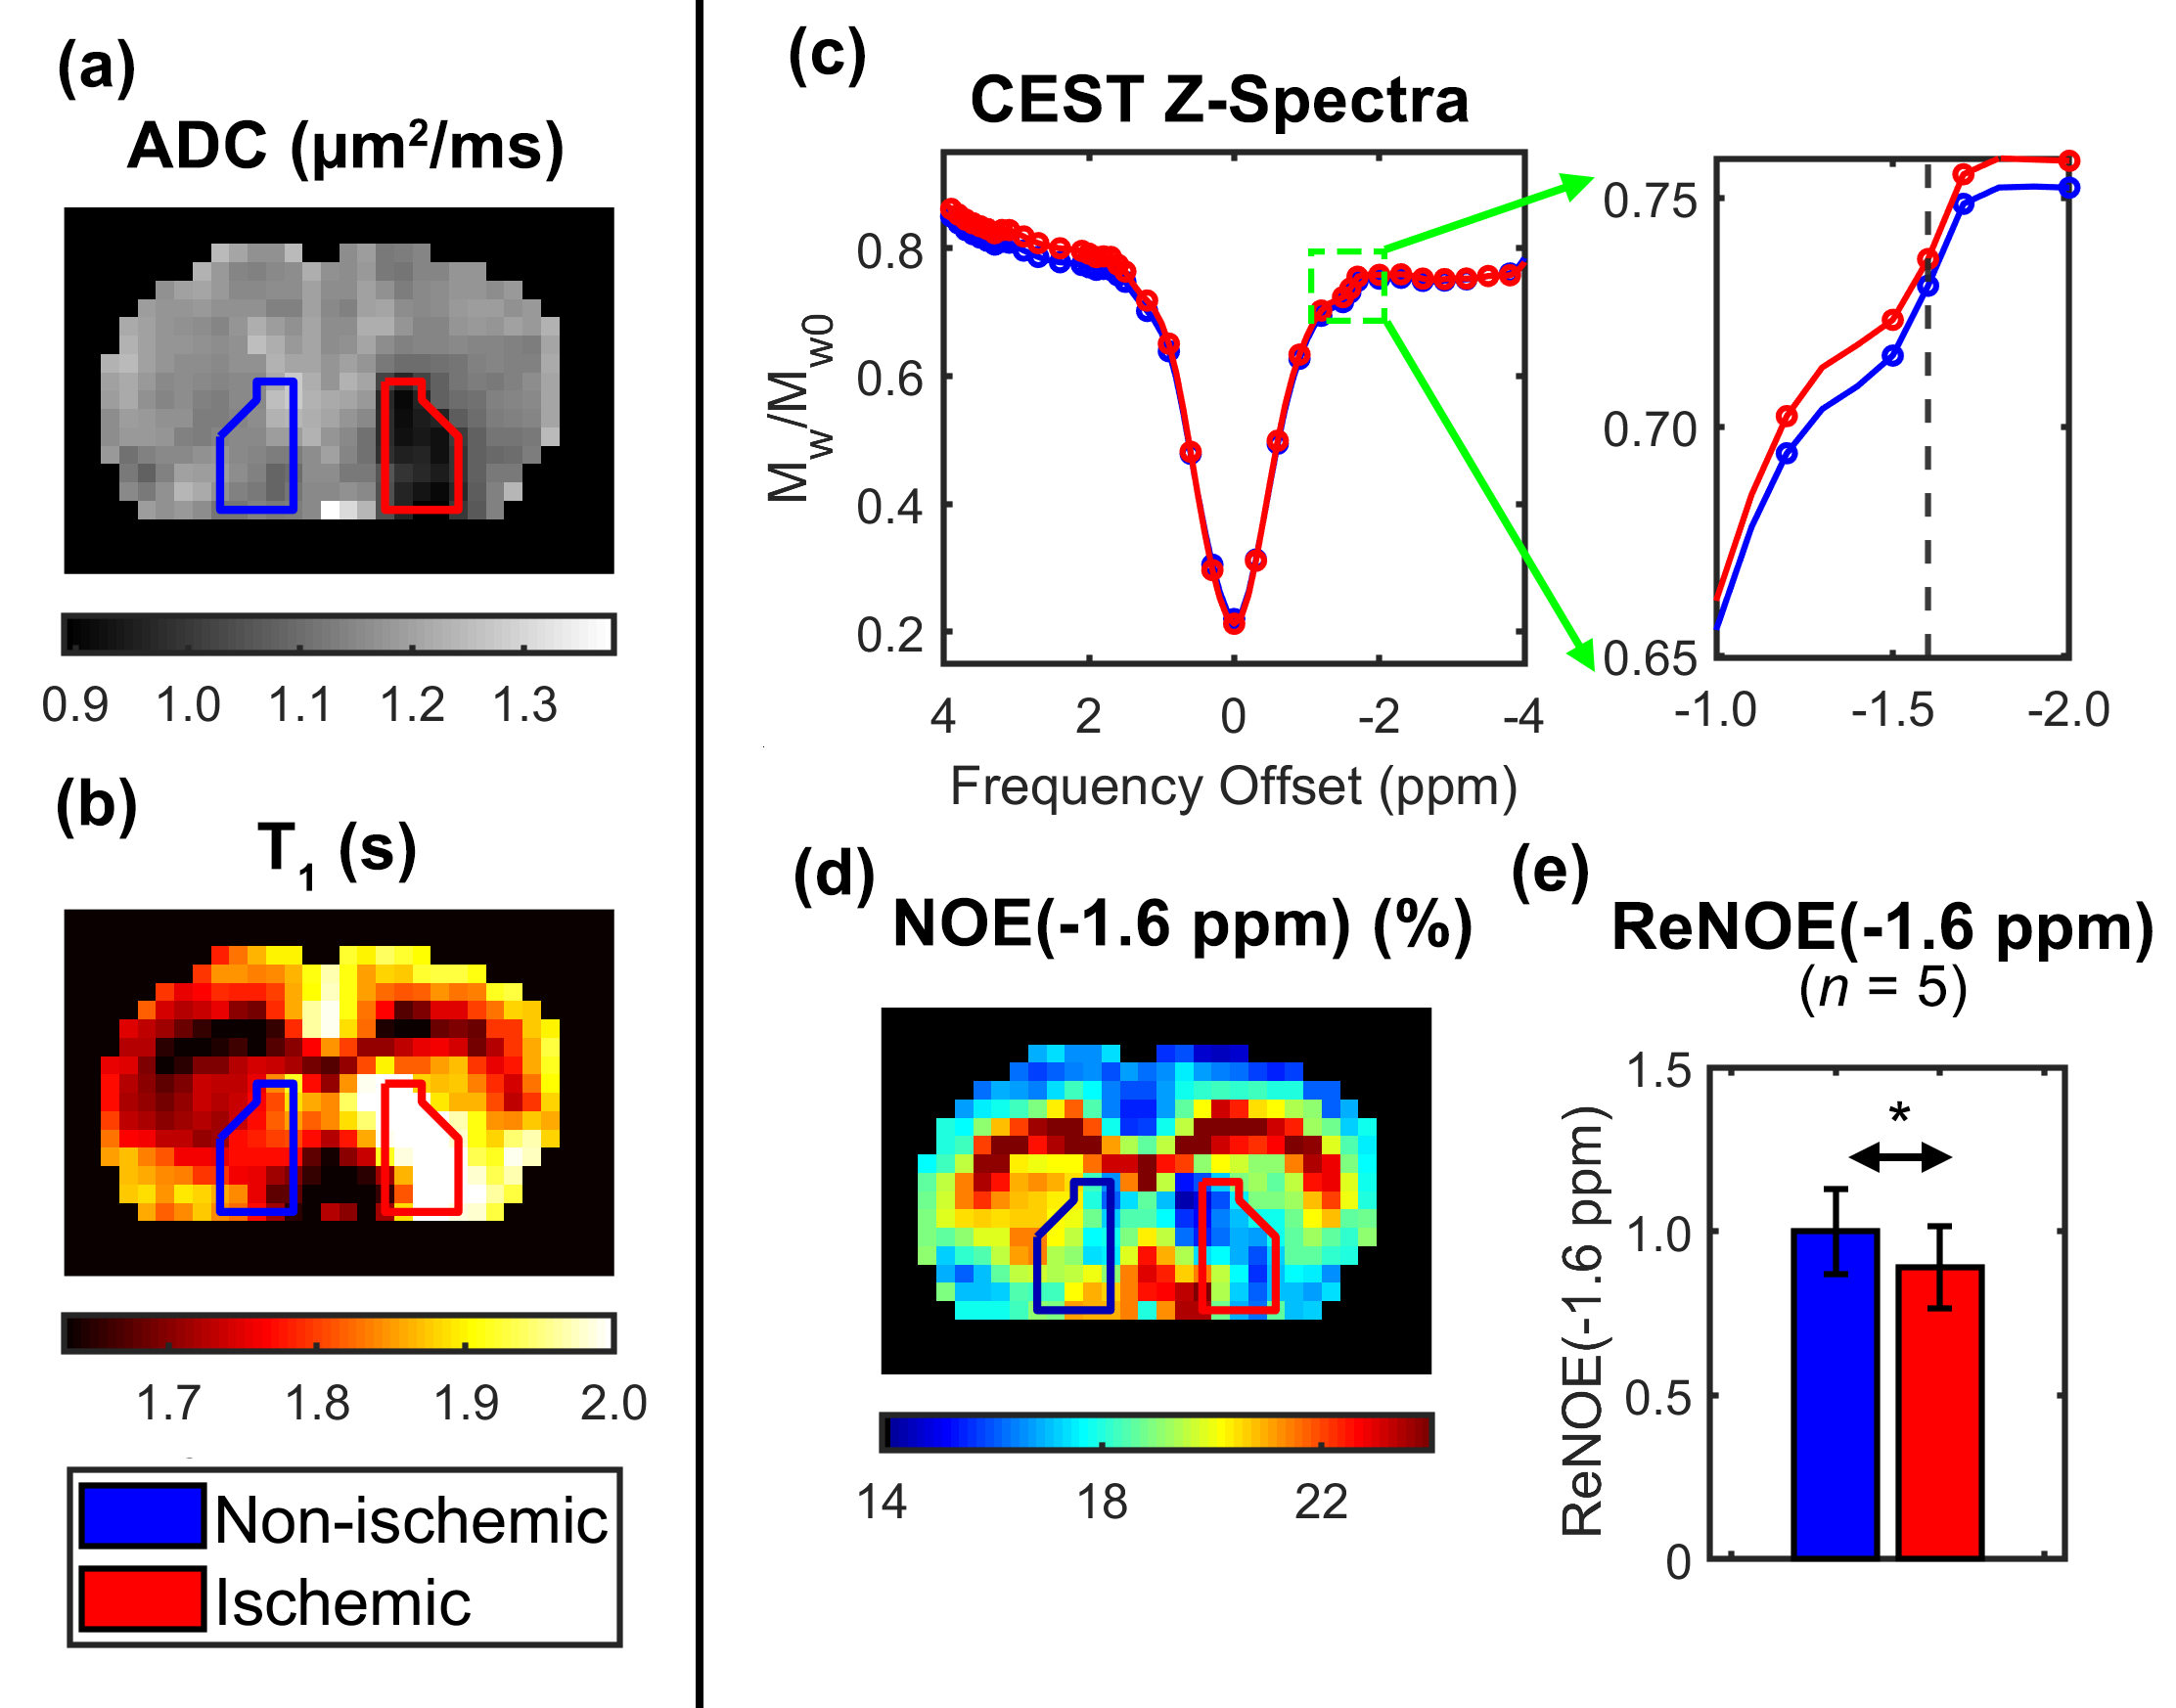
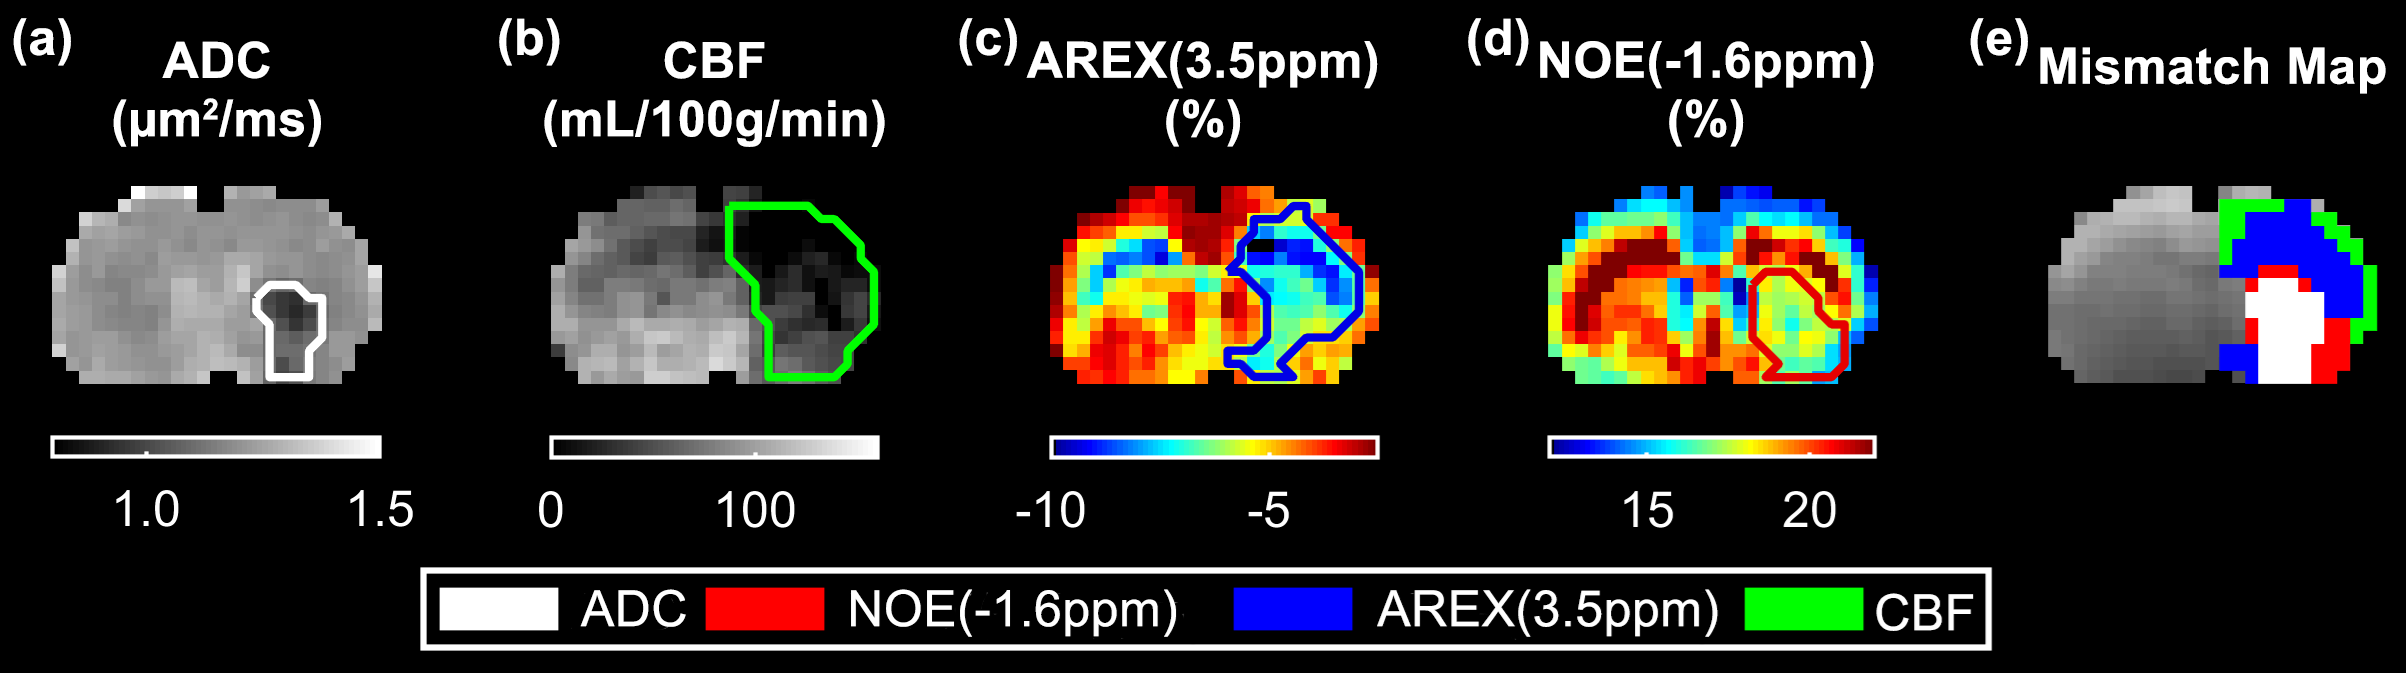
The z-spectra, quantified NOE(-1.6 ppm) map and the respective NOE signal in the ischemic and non-ischemic region of a representative animal, along with ADC and T1 map are shown in Figure 2. The NOE(-1.6 ppm) was found to be lower in the ischemic region. Figure 3 shows the ADC, CBF, AREX(3.5 ppm) and NOE(-1.6 ppm) map of a different rat. AREX(3.5 ppm) and NOE(-1.6 ppm) appeared hypointense and exhibited different signal patterns within the ischemic tissue. Notably, the NOE(-1.6 ppm) deficit areas were equal to or larger than the ADC deficit areas but smaller than the AREX(3.5 ppm) deficit areas as shown in the mismatch map (Figure 3e). This suggested that NOE(-1.6 ppm) might further delineate the acidotic tissue estimated using AREX(3.5 ppm).Discussion
Since NOE(-1.6 ppm) is closely related to membrane phospholipids, it has the potential to highlight at-risk tissue affected by lipid peroxidation and membrane damage. Altogether, the ADC/NOE(-1.6 ppm)/AREX(3.5 ppm)/CBF mismatches reveal four zones of increasing sizes within the ischemic tissue, potentially reflecting different pathophysiological information.Conclusion
Using CEST coupled with DWI and PWI, the ischemic tissue may thus potentially be separated into four zones to better understand the pathophysiology post stroke and improve ischemic tissue fate definition. However, further studies are still needed to elucidate the origin and observed changes in NOE(-1.6 ppm) and to establish a reliable method for quantifying this small signal.Acknowledgements
This work was supported by the Ministry of Higher Education Malaysia under the Fundamental Research Grant Scheme (No. FRGS/1/2021/ICT02/UTAR/02/). We would also like to acknowledge Dr Lee Sze Foo, Dr James Larkin and Dr Brad Sutherland for their help in preparing this abstract.References
- Foo LS, Larkin JR, Sutherland BA, et al. Investigation of relayed nuclear Overhauser enhancement effect at −1.6 ppm in an ischemic stroke model. Quant Imaging Med Surg. 2024. doi:10.21037/QIMS-23-510
- Zu Z, Lin EC, Louie EA, et al. Relayed nuclear Overhauser enhancement sensitivity to membrane Cho phospholipids. Magn Reson Med. 2020;84(4):1961-1976. doi:https://doi.org/10.1002/mrm.28258
- Chang YC, Liu HQ, Chang JH, Chang YY, Lin EC. Role of the cholesterol hydroxyl group in the chemical exchange saturation transfer signal at −1.6 ppm. NMR Biomed. 2020;33(9):e4356. doi:https://doi.org/10.1002/nbm.4356
- Jin T, Wang P, Zong X, Kim SG. Magnetic resonance imaging of the Amine–Proton EXchange (APEX) dependent contrast. Neuroimage. 2012;59(2):1218-1227. doi:https://doi.org/10.1016/j.neuroimage.2011.08.014
Figures