4439
Glucose Chemical Exchange Saturation Transfer MRI for Predicting the Histological Grade of Rectal Cancer1Henan Provincial People’s Hospital, zhengzhou, China, 2Philips Healthcare, Beijing, China
Synopsis
Keywords: CEST / APT / NOE, CEST & MT
Motivation: The histological grade of rectal cancer has a considerable involvement in treatment strategies and prognosis in relevant patients.
Goal(s): To evaluate the utility of glucose chemical exchange saturation transfer (glucoCEST) MRI with non-contrast injection in predicting the histological grade of rectal cancer.
Approach: This prospective analysis included 60 patients with rectal cancer who underwent pelvic glucoCEST, APTWI, and DWI.
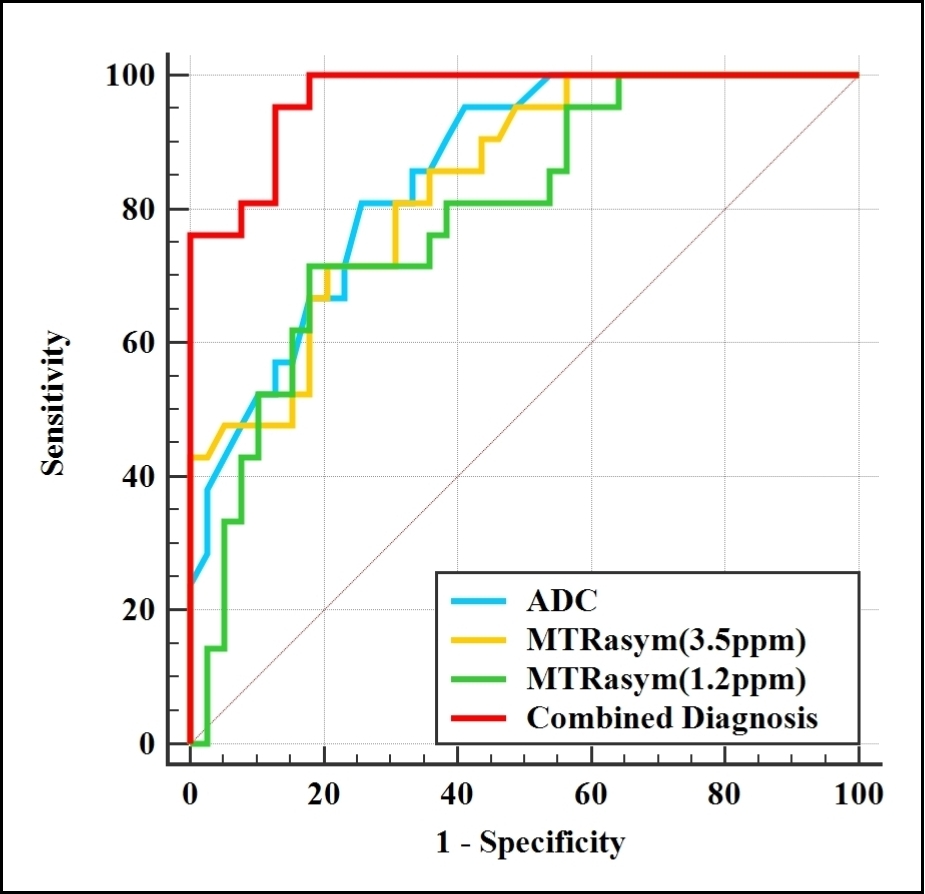
Results: Elevated MTRasym (1.2 ppm), MTRasym (3.5 ppm) values and lower ADC values were observed in the high-grade group compared with low-grade cases (all P < 0.01). The AUCs of MTRasym (1.2 ppm), MTRasym (3.5 ppm), and ADC were 0.792, 0.839, and 0.855, respectively.
Impact: These preliminary data demonstrate that glucoCEST MRI without contrast injection has the potential to provide a non-invasive assessment of histological grade in rectal cancer and add value to current tools used for the differentiation between high- and low-grade rectal cancer.
Introduction
The histological grade of rectal cancer has a considerable involvement in treatment strategies and prognosis in relevant patients [1]. Glucose chemical exchange saturation transfer (glucoCEST), another subtype of the CEST technique, can detect glucose concentration [2]. To the best of our knowledge, there is a lack of substantiated evidence to support the use of glucoCEST as a reliable tool for assessing histological grade in rectal cancer patients. The aim of this study was to evaluate the utility of glucoCEST in predicting the histological grade of rectal cancer in clinic. In addition, this study investigated the diagnostic efficacy of glucoCEST versus amide proton transfer-weighted imaging (APTWI) and diffusion-weighted imaging (DWI), in order to provide a new reference for relevant clinical studies.Material and Methods
A total of 21 high-grade and 39 low-grade rectal cancer cases were included, and clinical data, including gender, age, maximum lesion diameter, classification, location, and tumor stage, were collected. MRI was obtained with a 16-channel phased array torso coil on a 3.0T MR scanner (Ingenia 3.0T, Philips Healthcare, Best, Netherlands). DWI was performed with b = 0, 1000 s/mm2. APTWI was performed with a 3D single-shot TSE-Dixon pulse SPIR fat suppression. The duration of saturation pulse train for the APTWI sequence was 1 s, with a B1 root mean square (B1, rms) of 1.0 μT. Seven saturation frequency offsets (± 3.5, ± 3.42, ± 3.58, − 1560 ppm) were applied to acquire APTWI images. GlucoCEST was performed with a 2D single-shot TSE-mDixon sequence with SPIR fat suppression. The saturation frequency and duration of radiofrequency saturation pulse train for the glucoCEST sequence were 1.2 ppm and 1 s, respectively, and B1 root mean square (B1, rms) was 2.0 μT. To acquire a z-spectrum, imaging was repeated at 20 saturation frequency offsets of -5, -3.5, -3, -2, -1.5, -1.2, -0.8, -0.5, -0.25, 0, 0.25, 0.5, 0.8, 1.2, 1.5, 2, 3, 3.5, 5 ppm, as well as one offset far from the resonant frequency (1024.0 ppm).R (version 3.5.3; R Foundation, Auckland, Zealand) was used for data analysis. The Mann-Whitney U test and chi-square test were used to analyse the differences of continuous or categoric variables, respectively. The diagnostic efficacy was evaluated using the area under the receiver operating characteristic curve (AUC), and AUCs were compared by the DeLong test. Logistic regression (LR) analysis was employed to identify independent predictors and generate a multi-parameter composite diagnostic tool. A control model was built by bootstrapping (1000 samples), and its performance was assessed by calibration curve analysis, decision curve analysis (DCA), and ROC curve analysis. Statistical significance was set at P < 0.05.
Results
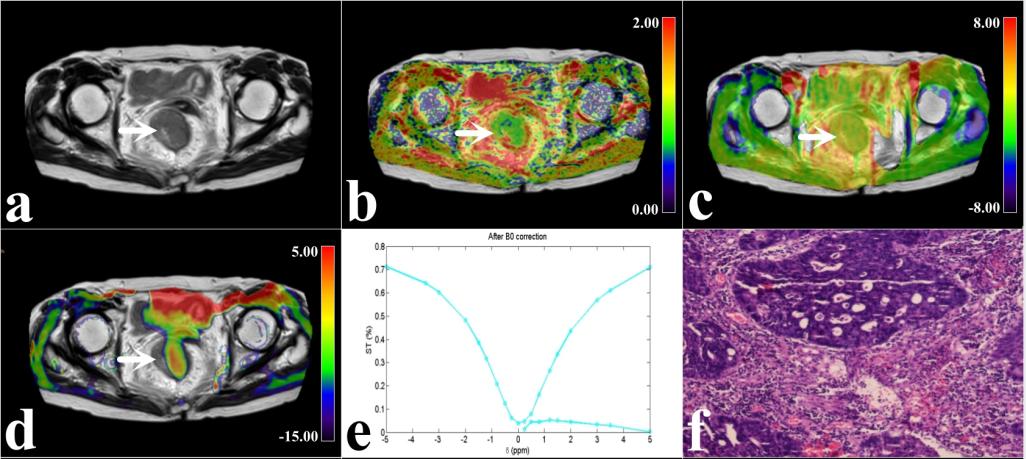
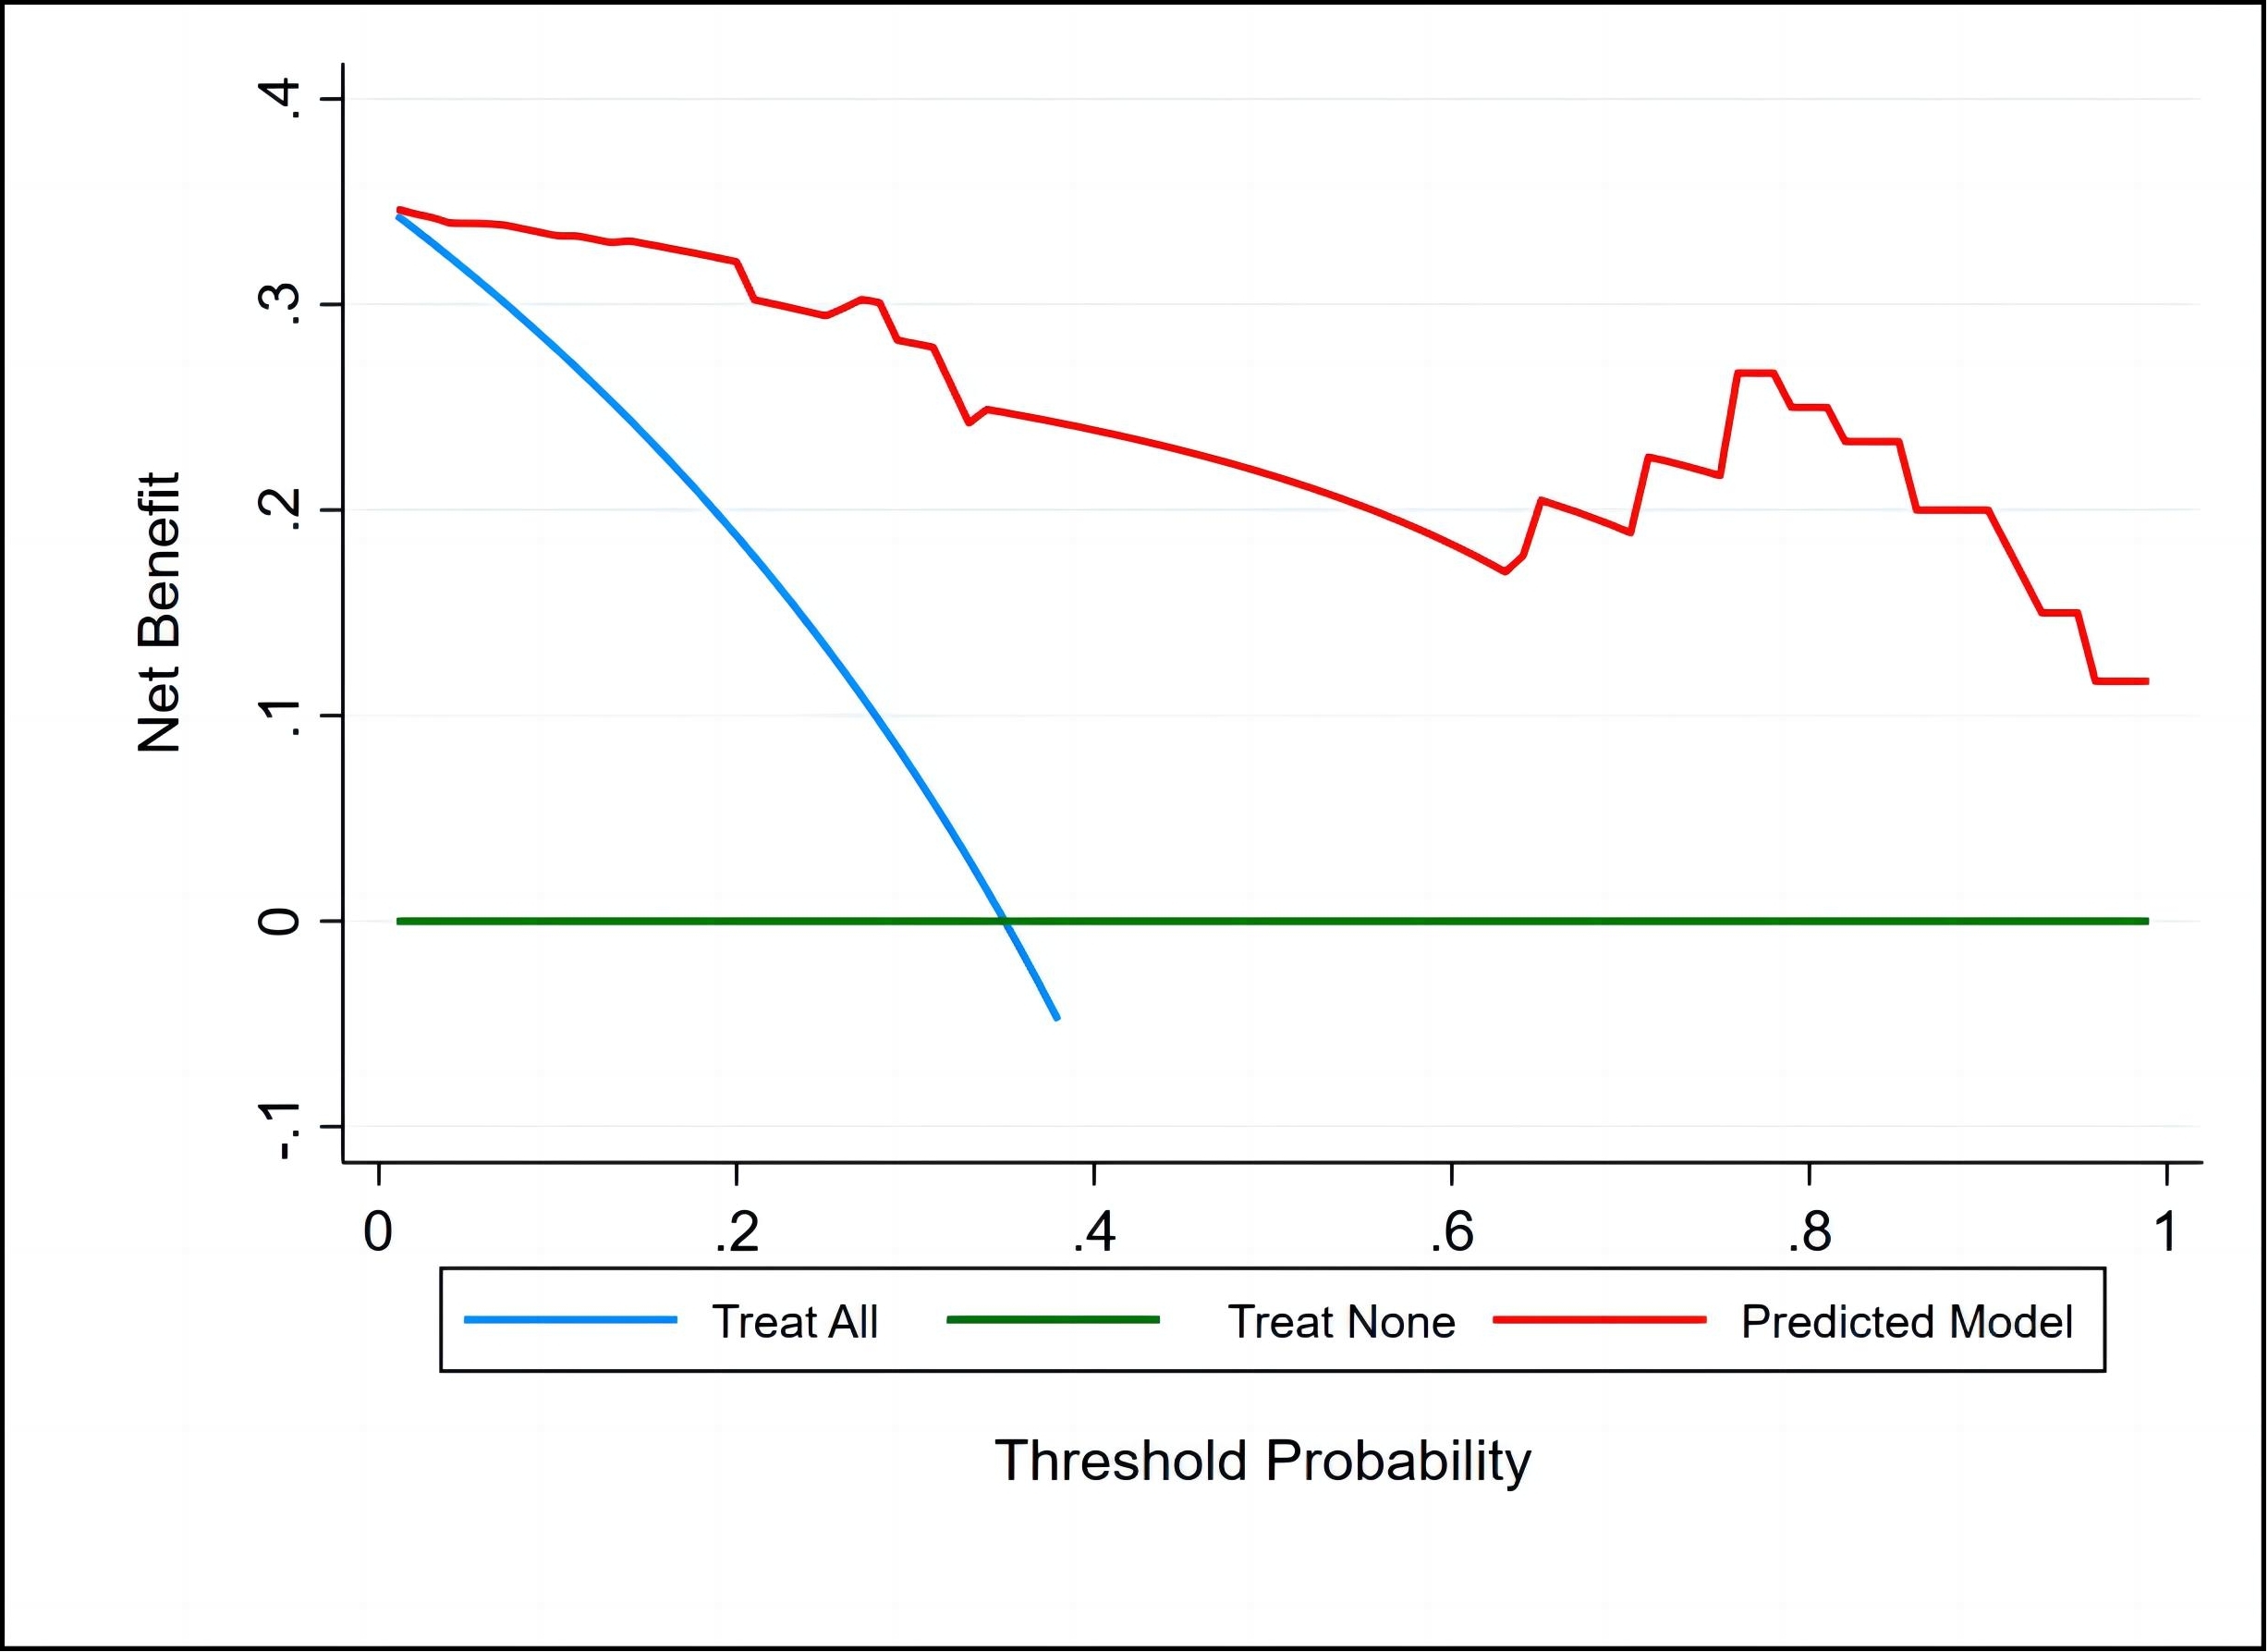
Elevated MTRasym (1.2 ppm) [2.20 (-1.76, 7.41) vs -3.23 (-8.14, 0.61)], MTRasym (3.5 ppm) [1.88 (1.29, 5.45) vs 0.83 (0.37, 1.46)] values and lower ADC [(0.95 ± 0.19) vs (1.32 ± 0.32)] values were observed in the high-grade group compared with low-grade group (all P < 0.01). Multivariate analysis demonstrated that ADC, MTRasym (3.5 ppm), and MTRasym (1.2 ppm) were independent predictors (P = 0.018, 0.040, and 0.042, respectively). For differentiating between high- and low-grade rectal cancer cases, the combination of independent predictors showed the best diagnostic performance (AUC = 0.969; sensitivity, 95.24%; specificity, 87.18%), surpassing ADC, MTRasym (3.5 ppm), and MTRasym (1.2 ppm) with statistical significance (AUCs = 0.855, 0.839, and 0.792, respectively; Z = 2.737, 2.788, and 2.991, respectively, all P < 0.05, respectively). The good consistency and reliability of the combination of independent predictors were demonstrated by calibration curve analysis and DCA(Figure 1, 2, and 3).Discussion
In this study, we firstly applied glucoCEST to determine histological grade in rectal cancer cases, and a significant increase in MTRasym (1.2 ppm) was found in the high-grade rectal cancer group compared with low-grade rectal cancer cases. This finding might be attributed to higher hydroxyl concentrations in high-grade tumors, which are characterized by faster cell proliferation, increased glucose metabolism, and more significant hypoxia [3, 4]. The increased T1 relaxation time may also enhance the signal intensity of glucoCEST [5]. Li et al. reported that T1 relaxation time was increased in the high-grade rectal cancer group compared with low-grade rectal cancer cases [6]. Therefore, we speculate that the difference in T1 relaxation time might also contribute to the variation of MTRasym (1.2 ppm) between high- and low-grade rectal cancers in this study.Conclusion
The glucoCEST MRI method facilitates the assessment of histological grade in rectal cancer and offers additional information to improve the diagnostic performance of APTWI and DWI, which is expected to be a promising imaging marker.Acknowledgements
The National Key R&D Program of China (2017YFE0103600), the National Natural Science Foundation of China (81720108021 and 31470047), the Zhongyuan Thousand Talents Plan Project - Basic Research Leader Talent (ZYQR201810117), the Zhengzhou Collaborative Innovation Major Project (20XTZX05015), the Key Project of Henan Province Medical Science and Technology Project (LHGJ20190602), and the Henan provincial science and technology research projects (212102310689).References
1. Song JH, Kim SH, Lee JH, et al. Significance of histologic tumor grade in rectal cancer treated with preoperative chemoradiotherapy followed by curative surgery: A multi-institutional retrospective study. Radiother Oncol. 2016;118(2):387-392. doi:10.1016/j. radonc.2015.11.028
2. Nasrallah FA, Pagès G, Kuchel PW, Golay X, Chuang KH. Imaging brain deoxyglucose uptake and metabolism by glucoCEST MRI. J Cereb Blood Flow Metab. 2013;33(8):1270-1278. doi:10.1038/jcbfm.2013.79.
3. Jin T, Mehrens H, Wang P, Kim SG. Glucose metabolism-weighted imaging with chemical exchange-sensitive MRI of 2-deoxyglucose (2DG) in brain: Sensitivity and biological sources. Neuroimage. 2016; 143:82-90. doi:10.1016/j. neuroimage. 2016. 08.040.
4. Chan KW, McMahon MT, Kato Y, et al. Natural D-glucose as a biodegradable MRI contrast agent for detecting cancer. Magn Reson Med. 2012;68(6):1764-1773. doi:10.1002/mrm.24520.
5. Sun XY, Chen TX, Chang C, et al. SUVmax of 18FDG PET/CT Predicts Histological Grade of Lung Adenocarcinoma. Acad Radiol. 2021;28(1):49-57. doi: 10.1016/j.acra.2020.01.030.
6. Satoh K, Sadowski SM, Dieckmann W, et al. 18F-FDG PET/CT Volumetric Parameters are Associated with Tumor Grade and Metastasis in Pancreatic Neuroendocrine Tumors in von Hippel-Lindau Disease. Ann Surg Oncol. 2016;23(Suppl 5):714-721. doi:10.1245/s10434-016-5541-4.
Figures