4438
Amide proton transfer imaging corrected by apparent diffusion coefficient to detect response of chemotherapy in bone and soft tissue sarcomas1Department of Clinical Radiology, Graduate School of Medical Sciences, Kyushu University, Fukuoka, Japan, 2Department of Health Sciences, Graduate School of Medical Sciences, Kyushu University, Fukuoka, Japan, 3Department of Orthopaedic Surgery, Graduate School of Medical Sciences, Kyushu University, Fukuoka, Japan, 4Department of Anatomic Pathology, Graduate School of Medical Sciences, Kyushu University, Fukuoka, Japan
Synopsis
Keywords: CEST / APT / NOE, CEST & MT, bone and soft tissue sarcoma
Motivation: Evaluating the response to chemotherapy based on volume changes is often difficult in bone and soft tissue sarcomas; therefore, new molecular imaging techniques are required.
Goal(s): To investigate whether amide proton transfer (APT) imaging combined with apparent diffusion coefficient (ADC) accurately reflects treatment efficacy in bone and soft tissue sarcomas.
Approach: An MRI was performed before and after chemotherapy in 12 patients who received preoperative chemotherapy. Tumor volume, APT, and ADC were compared before and after treatment and correlated with postoperative pathology specimens.
Results: Only APT imaging with ADC correction correctly reflected the effect of preoperative chemotherapy.
Impact: The present study demonstrates that a new molecular imaging technique can accurately determine the efficacy of chemotherapy for bone and soft tissue sarcomas. This will help to determine the optimal course of treatment and improve patient prognosis.
Introduction
Evaluating the response to chemotherapy based on volume changes is often difficult in bone and soft tissue sarcomas, because they contain large amounts of stroma in addition to tumor cells.Amide proton transfer (APT) imaging involves the visualization of proton exchange between free tissue water and amide groups (-NH) of endogenous mobile proteins and peptides1. We previously reported that APT imaging can detect the effects of chemotherapy in a mouse model of brain tumors prior to volume changes2.
However, accurate assessment by APT imaging can be compromised by structural heterogeneity, such as edema, necrosis, hemorrhage, and cysts, associated with treatment3. We previously reported that apparent diffusion coefficient (ADC) correction of APT reduces the effect of these tissue heterogeneities and improves the diagnostic performance in brain tumors4, 5.
We hypothesized that ADC-corrected APT would also be useful for determining the efficacy of preoperative chemotherapy for bone and soft tissue sarcomas. This study aimed to evaluate the utility of APT and ADC-corrected APT imaging for determining the response of bone and soft tissue sarcomas to preoperative chemotherapy.
Methods
<Subjects> This study included 12 patients with bone and soft tissue sarcomas who underwent preoperative chemotherapy. They were classified postoperatively into two groups based on histopathological analysis: responders (≤ 50% viable cells after chemotherapy) and non-responders (> 50% viable cells).<Image Acquisition> Subjects were scanned before and after preoperative chemotherapy using 3T MRI systems (Ingenuity TF and Ingenia, Philips Healthcare, Best, Netherlands). Transverse 2D-T2WI covering the entire tumor volume and DWI with single-shot EPI (b = 0 and 1000) were performed to generate an ADC map. APT imaging was performed using the 3D fast spin-echo Dixon method6. Briefly, we applied a saturation pulse (duration:2.0s, power:2.0μT) at seven different frequency offsets: ± 2.7 ppm, ± 3.5 ppm, ± 4.3 ppm, and -1560 ppm, and repeated the scan three times at +3.5 ppm with echo shifts (ΔTE = 0.4 ms) for Dixon B0 mapping. APT imaging was generated from the B0-corrected MTR asymmetry at ± 3.5 ppm. Other parameters were as follows: voxel size = 2.1– 2.8 mm, slice thickness = 4.4 – 6.0 mm, slices = 10, and scan duration < 5 m 12 s.
<Image Processing> We divided the APT image by the ADC map to generate APT/ADC maps. On T2WI, we manually delineated the regions of interest (ROIs) along the inner edge of the tumor boundary and copied these ROIs onto other images. The APT, ADC, and APT/ADC values were recorded on a voxel-by-voxel basis across all slices. The tumor volumes, 10th percentile of the ADC (ADC 10%), 90th percentile of the APT (APT 90%), and 90th percentile of the APT/ADC (APT/ADC 90%) were compared before and after chemotherapy in responders and non-responders.
Results
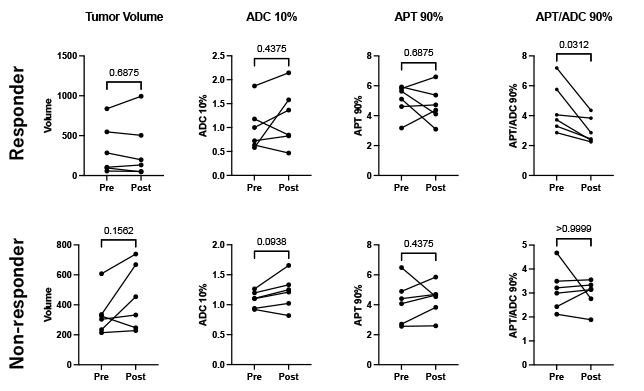
Based on postoperative histopathological analysis, six of the 12 patients were classified as responders, and six were classified as non-responders.In the responder group, APT/ADC 90% showed a significant decrease after chemotherapy (4.48 ± 1.66 vs. 3.02 ± 0.88, P < 0.05). Other parameters were not significantly different between pre- and post-treatment in either responders or non-responders (Figure 1).
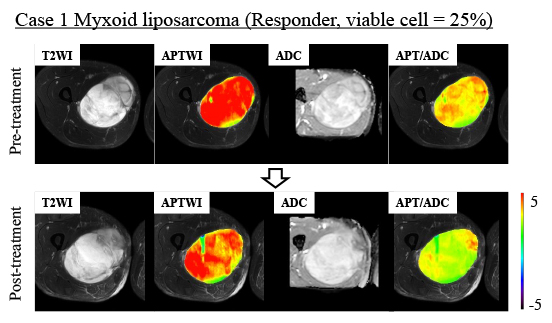
A case of myxoid liposarcoma is shown in Figure 2. There was little change in tumor volume with chemotherapy; however, a reduction in APT and a slight increase in ADC were observed. The APT/ADC also decreased, which may reflect the effect of the treatment.
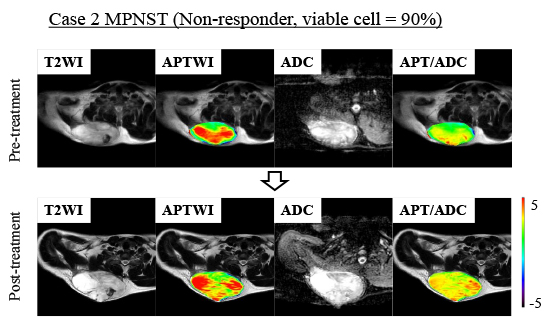
Figure 3 shows a case of malignant peripheral nerve sheath tumor (MPNST). Despite chemotherapy, the tumor volume increased, APT was slightly elevated, ADC decreased, and the APT/ADC ratio was slightly elevated. These findings suggested resistance to treatment.
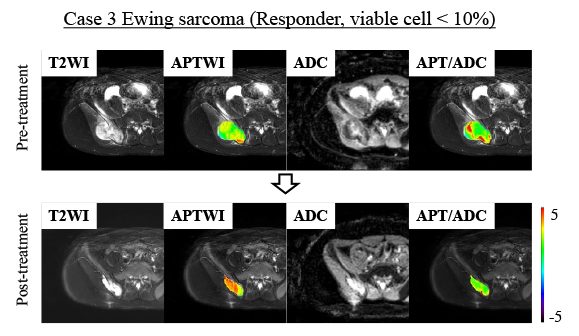
A case of Ewing’s sarcoma is shown in Figure 4. Despite the reduction in tumor volume with chemotherapy, APT levels increase because of treatment-induced necrosis and edema. However, ADC was also elevated, and after correction, APT/ADC decreased to correctly reflect the effect of chemotherapy.
Discussion
APTWI from MTR asymmetry is influenced by a variety of factors derived from differences in background tissue architecture, conventional MT effects, T1/T2, and direct water saturation, in addition to the pure APT signal3. Therefore, APT tends to be overestimated in areas of edema, necrosis, hemorrhage, or cysts and underestimated in areas of high cell density and solid components.ADC reflects the tissue architecture and is thought to be inversely correlated with tumor cell density. Therefore, dividing the APTWI by the ADC was expected to reduce the signal influence of treatment-induced tissue heterogeneity.
Conclusion
APT combined with ADC can detect differences in the response of patients with bone and soft tissue sarcomas treated with preoperative chemotherapy.Acknowledgements
This work was supported by JSPS KAKENHI Grant Number JP19K08228 and Research Fund from Philips Japan Ltd.References
1. Vinogradov E, Sherry AD, Lenkinski RE. CEST: from basic principles to applications, challenges and opportunities. Journal of magnetic resonance (San Diego, Calif : 1997) 2013;229:155-172.
2. Sagiyama K, Mashimo T, Togao O, et al. In vivo chemical exchange saturation transfer imaging allows early detection of a therapeutic response in glioblastoma. Proc Natl Acad Sci U S A 2014;111(12):4542-4547.
3. Zhou J, Zaiss M, Knutsson L, et al. Review and consensus recommendations on clinical APT-weighted imaging approaches at 3T: Application to brain tumors. Magnetic resonance in medicine : official journal of the Society of Magnetic Resonance in Medicine / Society of Magnetic Resonance in Medicine 2022;88(2):546-574.
4. Sagiyama K, Watanabe Y, Kamei R, et al. Voxel-wise comparison of amide proton transfer (APT) weighted image and fluorodeoxyglucose (FDG)-PET in brain tumors with a PET/MR system. Proc. Intl. Soc. Mag. Reson. Med. 25 (2017)
5. Sagiyama K, Togao O, Kamitani T, et al. Amide proton transfer image corrected by apparent diffusion coefficient improved diagnostic performance in grading brain tumors on a PET/MR system. Proc. Intl. Soc. Mag. Reson. Med. 31 (2023)
6. Togao O, Keupp J, Hiwatashi A, et al. Amide proton transfer imaging of brain tumors using a self-corrected 3D fast spin-echo dixon method: Comparison With separate B0 correction. Magnetic resonance in medicine : official journal of the Society of Magnetic Resonance in Medicine / Society of Magnetic Resonance in Medicine 2017;77(6):2272-2279.
Figures