4431
Modeling fat-water R1 relaxation in Fat DESPOT from complex signal1McGill University, Montreal, QC, Canada, 2McGill University Health Center, Montreal, QC, Canada, 3McGill University, Montréal, QC, Canada
Synopsis
Keywords: Quantitative Imaging, Quantitative Imaging
Motivation: Fat DESPOT, a fat and water R1 mapping technique, has been proposed to image tumor hypoxia through the oxygen-induced change in fat R1.
Goal(s): Using the complex signal for Fat DESPOT doubles the usable data for each acquisition, reducing the total number of acquisitions required and scan time.
Approach: The published magnitude approach to fat DESPOT was compared to the complex approach in simulations and phantom experiments.
Results: Compared to the magnitude approach, the complex approach to Fat DESPOT increased the precision and accuracy of fat R1 estimates in simulations and phantom experiments and increased the accuracy of PDFF in phantom experiments.
Impact: This study suggests that the complex approach to fat DESPOT R1 measurements could reduce imaging time without compromising PDFF or R1f estimates. It could therefore offer sensitive and versatile R1-based tumor hypoxia mapping in potentially clinically feasible scan times.
Introduction
Dissolved oxygen content is an important biomarker of numerous diseases, including diabetes1, lung disease2, and fatty liver disease3. In oncology, hypoxia, a common feature of solid tumors, can be predictive of adverse outcomes4, and reduces the efficacy of radiation therapy5. Mapping tumor hypoxia could improve radiation therapy outcomes by allowing physicians to modulate the dose delivered to hypoxic tumor volumes6. Our group has proposed Fat DESPOT (fat-water separated Driven Equilibrium Single Pulse Observation of T1) to map hypoxia by measuring the voxel-wise change in R1 of fat and water due to oxygenation simultaneously. This method allows for high resolution, high sensitivity R1 mapping for a wide range of fat fractions (FF)7. The published Fat DESPOT approach uses the magnitude of the MRI signal for its fitting algorithm and was demonstrated with two six-echo acquisitions per flip angle to acquire sufficient data with appropriate echo spacing to be fitted with the joint fat-water relaxation model separation. However, fitting to the complex MRI signal rather than the magnitude of the signal would offer a two-fold increase in available data as the imaginary and real components of the signal are not merged. This would bring us closer to clinically viable measurement times by acquiring data in a single acquisition per flip angle. To assess the viability of the complex approach to Fat DESPOT, simulations and phantom experiments were performed.Methods
Complex and magnitude approaches were compared in simulations using a virtual phantom where R2* and R1 of water (R1W). Simulations were completed for FFs between 0 and 100% and for R1 of fat (R1f) between 0.5 and 5 s-1. A 12-echo acquisition, following the published acquisition protocol7, was analyzed using the magnitude approach to Fat DESPOT. An alternative 8-echo acquisition was simulated and analyzed with the complex approach. Parameters of both acquisitions are included in Table 1. In both simulations, noise was added to achieve an SNR of 50 and 1000 iterations were completed for each FF and R1f combination to allow for statistical observation. To compare the complex and magnitude approaches experimentally, we constructed a phantom in which FF was modulated by placing emulsions of varying peanut oil and distilled water-agar solution ratios into 50 ml vials, used as inserts immersed in water8. The water-agar solution was doped with gadobutrol (Gadovist, Bayer Healthcare). Six FFs ranging from 0 to 100% fat were achieved. Two pure water phantoms were included, doped with different concentrations of gadobutrol to modulate the R1w. Phantom measurements were taken using a 3 T scanner (Ingenia, Philips Healthcare) with a multi-echo, variable flip angle gradient echo protocol. An additional multi-echo measurement was used to determine the reference proton density FF (PDFF) of each vial. All acquisition protocols are described in Table 1.Results and Discussion
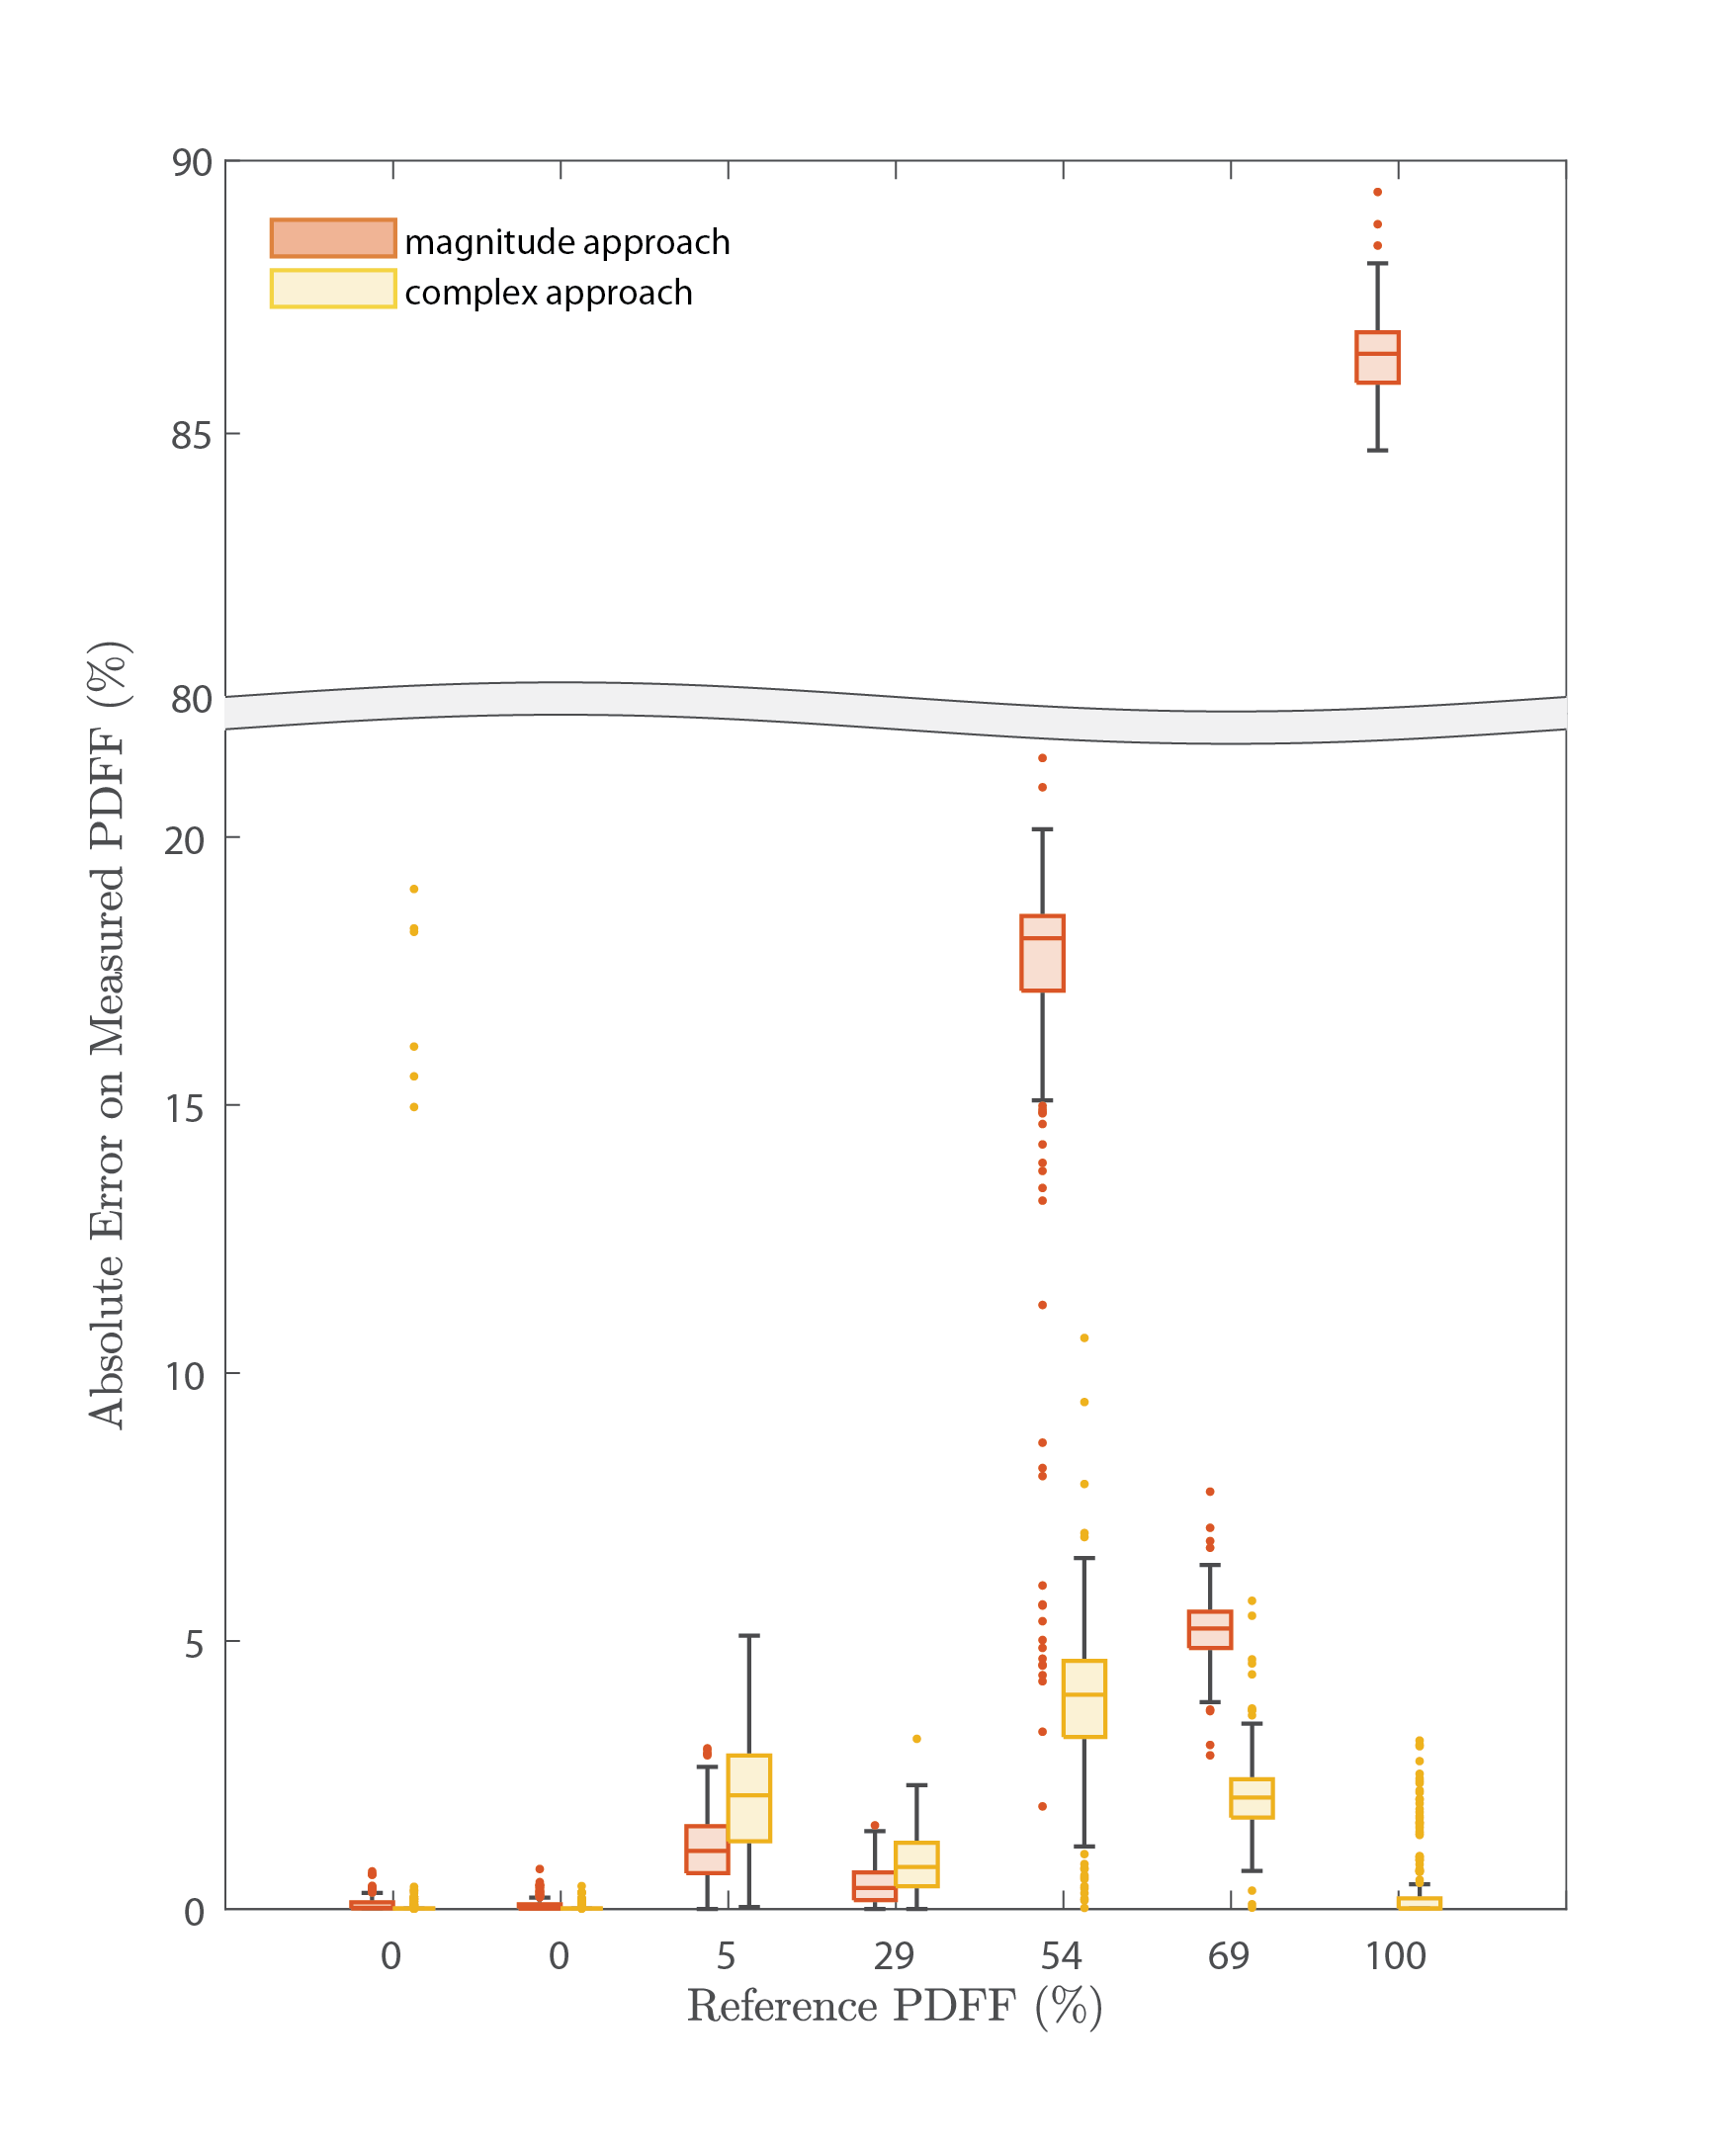
When simulated, the complex approach using 8 echoes has a smaller relative error and standard deviation compared to the magnitude approach using 12 echoes for R1f (Fig.1). This is most evident in FFs between 60 and 90%, where simulations predict relative error above 60% for a range of R1f values. Additionally, in low FF environments, the range of R1f values where Fat DESPOT returns accurate estimates (relative error < 20%) is extended using the complex approach. Experimentally, for the same 8-echo protocol, the complex approach to Fat DESPOT showed a slight increase in R1f from FF=5% to 29% with little variation above FF=29%, while significant variation was observed using the magnitude approach (Fig 2). The R1f behaviour observed with the complex approach is consistent with the behaviour expected of the dominant methylene peak from previous spectroscopic R1 measurements9. Furthermore, the complex approach to Fat DESPOT returned highly accurate PDFF estimates (absolute error < 2%) when compared to the reference for all FFs, while the absolute error using the magnitude approach was very high in some FFs (Fig 3.)Conclusion
The complex approach to fat DESPOT returns more precise and accurate measures of R1f in simulations and phantom experiments and more accurate PDFFs in phantom experiments than the magnitude approach. Furthermore, while the previously suggested Fat DEPOT acquisition protocol involved eight 6-echo acquisitions, taking approximately 4 minutes each7, the protocol for complex Fat DESPOT discussed here requires four 8-echo acquisitions taking approximately 6 minutes each, resulting in a 25% reduction in scan time. This complex fitting approach, paired with additional time-reduction techniques, such as parallel imaging, could make Fat DESPOT a viable clinical technique for MR oximetry.Acknowledgements
The Authors Acknowledge the developers of the ISMRM fat-water toolbox (http://www.ismrm.org/workshops/FatWater12/data.htm), the Research Institute of the McGill University Health Centre, the McGill University Hospital Center Glen Site MRI Research platform where we collected data, and the Natural Science and Engineering Research Council of Canada (NSERC).References
1. Morozov, D., Quirk, J. D., & Beeman, S. C. (2020). Toward noninvasive quantification of adipose tissue oxygenation with MRI. International journal of obesity, 44(8), 1776-1783.2. Bhattacharya, I., Ramasawmy, R., Javed, A., Chen, M. Y., Benkert, T., Majeed, W., ... & Campbell‐Washburn, A. E. (2021). Oxygen‐enhanced functional lung imaging using a contemporary 0.55 T MRI system. NMR in Biomedicine, 34(8), e4562.
3. Franconi, F., Lemaire, L., Saint‐Jalmes, H., & Saulnier, P. (2018). Tissue oxygenation mapping by combined chemical shift and T1 magnetic resonance imaging. Magnetic Resonance in Medicine, 79(4), 1981-1991.
4. Vaupel, P., & Mayer, A. (2007). Hypoxia in cancer: significance and impact on clinical outcome. Cancer and Metastasis Reviews, 26, 225-239.
5. B. S., & Horsman, M. R. (2020). Tumor hypoxia: impact on radiation therapy and molecular pathways. Frontiers in oncology, 10, 562.
6. Arai, T. J., Yang, D. M., Campbell III, J. W., Chiu, T., Cheng, X., Stojadinovic, S., ... & Mason, R. P. (2021). Oxygen-sensitive MRI: a predictive imaging biomarker for tumor radiation response?. International Journal of Radiation Oncology* Biology* Physics, 110(5), 1519-1529.
7. Fortier, V., & Levesque, I. R. (2023). MR-oximetry with fat DESPOT. Magnetic Resonance Imaging, 97, 112-121
8. Bush, E. C., Gifford, A., Coolbaugh, C. L., Towse, T. F., Damon, B. M., & Welch, E. B. (2018). Fat-water phantoms for magnetic resonance imaging validation: a flexible and scalable protocol. JoVE (Journal of Visualized Experiments), (139), e57704.
9. Fortier, V., & Levesque, I. R. (2022). Longitudinal relaxation in fat‐water mixtures and its dependence on fat content at 3 T. NMR in Biomedicine, 35(2), e4629.
10. Wang, L., Schweitzer, M. E., Padua, A., & Regatte, R. R. (2008). Rapid 3D‐T1 mapping of cartilage with variable flip angle and parallel imaging at 3.0 T. Journal of Magnetic Resonance Imaging: An Official Journal of the International Society for Magnetic Resonance in Medicine, 27(1), 154-161
Figures
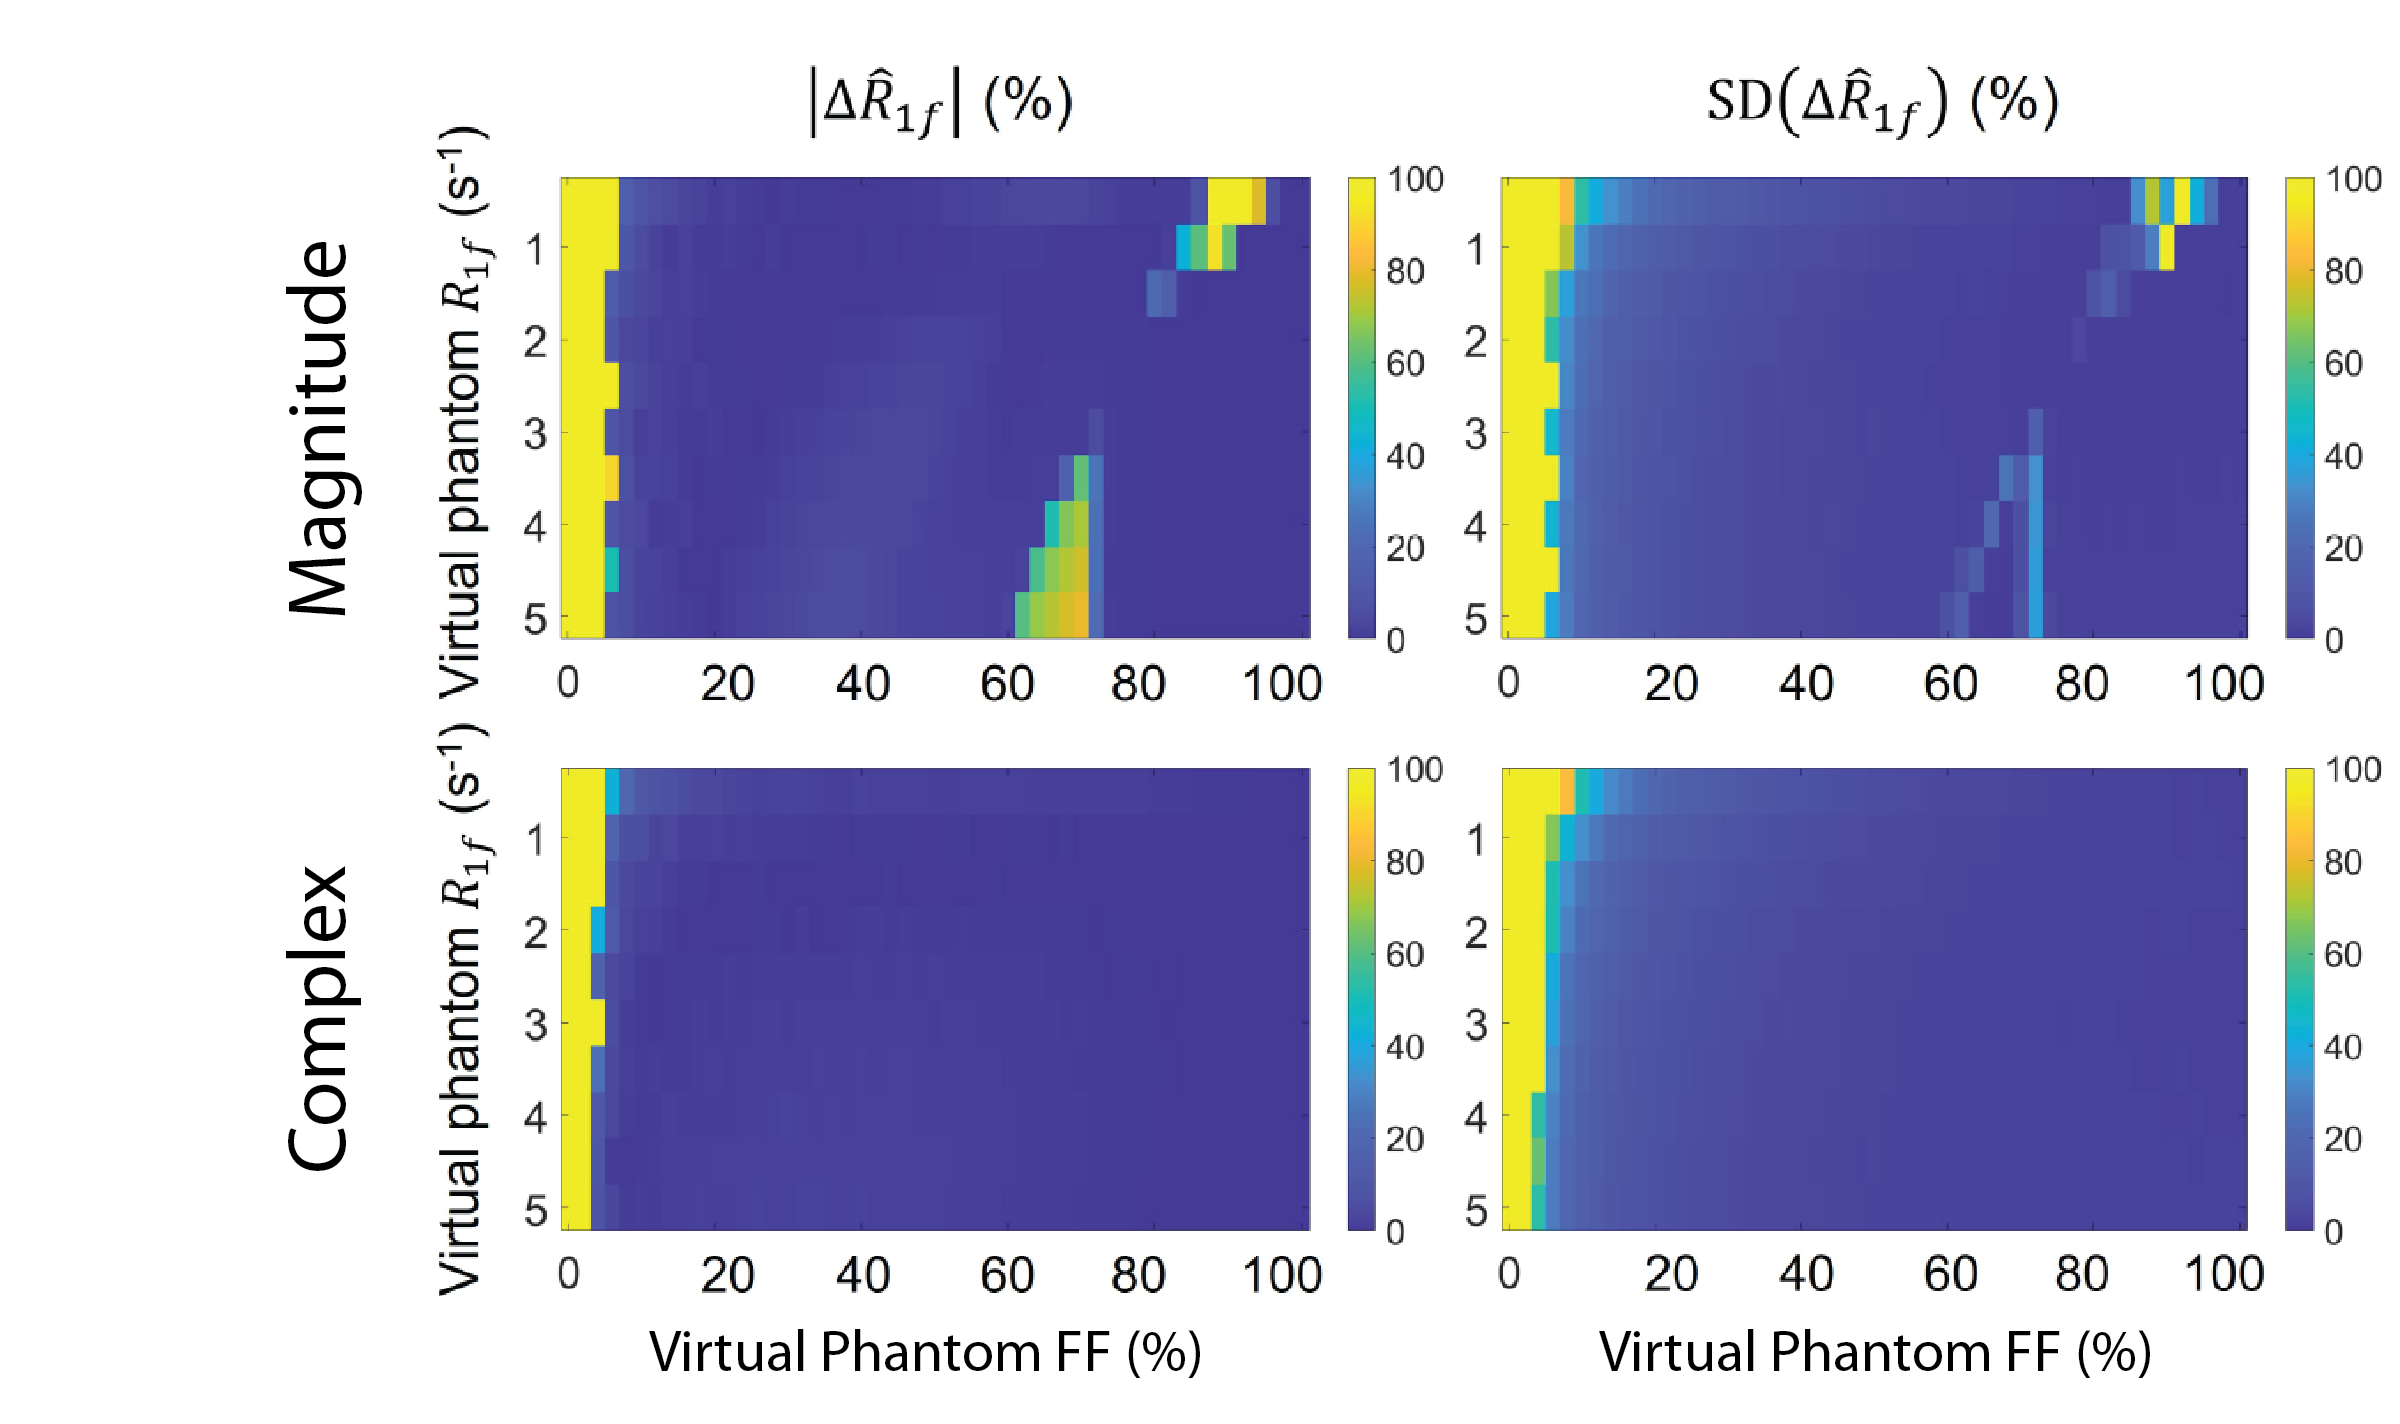
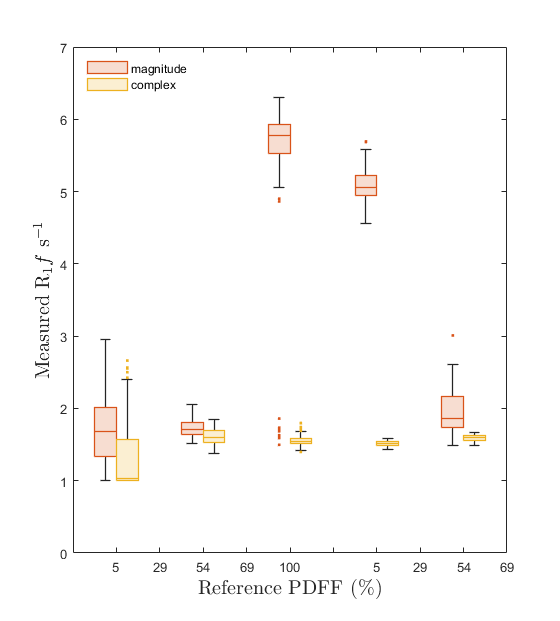
Figure 2: Box plots of the experimental R1f estimate using the magnitude and complex approaches to fat DESPOT. R1f estimates are taken over the full cross-section of each vial containing a fat-water mixture, averaging three central slices. Measurements were obtained using an 8-echo acquisition with TE1 = 1.9 ms, ΔTE = 1.8 ms, and TR = 24 ms.