4429
Signal interferences in Actual Flip Angle Imaging (AFI) of polyvinylpyrrolidone (PVP) solutions1Physikalisch-Technische Bundesanstalt, Braunschweig and Berlin, Germany, 2Medical Physics in Radiology, German Cancer Research Center (DKFZ), Heidelberg, Germany, 3University of Minnesota, Center for Magnetic Resonance Research, Minneapolis, MN, United States
Synopsis
Keywords: Quantitative Imaging, High-Field MRI, B1+ mapping, Actual Flip Angle Imaging (AFI)
Motivation: Polyvinylpyrrolidone (PVP) solutions have dielectric properties similar to human tissue and therefore are widely used for validating electromagnetic simulations in phantoms. For validating the flip angle in such applications, actual flip angle imaging (AFI) is highly suitable.
Goal(s): This work investigates measurement errors of AFI with PVP solutions.
Approach: Different PVP/H2O ratios are investigated at 3T, with different RF-spoiling phase increments, and with NMR spectroscopy.
Results: NMR spectra show the existence of off-resonant PVP signals. Integrating two isochromat ensembles with different frequencies into an EPG-simulation qualitatively explain the measured signals and resulting flip angle errors in AFI.
Impact: Understanding the cause of unexpected measurement errors of actual flip angle imaging with polyvinylpyrrolidone solutions will improve their use for the validation of new B1+ mapping techniques or new transmit arrays.
Introduction
MRI at ultra-high fields (≥7T) yields heterogeneous B1+ fields leading to position-dependent flip angle (FA) distributions1. A fast and frequently used 3D-sequence for measuring FAs is actual flip-angle imaging2 (AFI). In phantoms, AFI is used for accurate quantifications e.g., to validate B1+ fields of UHF transmit arrays3,4. Suitable phantom fillings with tissue-equivalent dielectric properties (ε, σ) are polyvinylpyrrolidone (PVP) solutions5 with PVP/water fractions of 30-50% as in4,6. Own AFI measurements with certain RF spoil-phase increments (Φ0), however, showed considerable deviations from the expected FAs without the presence of ghosting artefacts as reported in ref7.In this work, we investigate the accuracy and systematic errors of AFI in PVP phantoms. Therefore, we extended the approach from Yarnykh8 to cover multiple precession frequencies. This is done using extended phase graph9 (EPG) simulations and phantom validation measurements.
Methods
AFI acquisition: All scans were performed at 3T (Verio, Siemens) using a 32-channel head coil. A non-selective 3D Cartesian AFI was applied with: field-of-view(FOV)=256x128x160mm; resolution=2x2x5mm; TE/TR1/TR2=1.90/25/125ms; nominal FA=60°; spoiler-gradient-areas (read direction): AG1/AG2=117.5/587.5mT$$$\cdot$$$ms/m. The phantom consists of four pairs of tubes: four water-filled tubes (termed W1-W4) with Gadolinium-based contrast agent (ADC=1.9$$$\,\cdot$$$10-3mm2/s at 293K) and four PVP/water-filled tubes (PVP1=23% weight (wt) PVP, ADC=0.99$$$\,\cdot$$$10-3mm2/s; PVP2=38wt.%PVP, ADC=0.53$$$\,\cdot$$$10-3mm2/s; PVP3=44wt.%PVP, ADC=0.35$$$\,\cdot$$$10-3mm2/s; PVP1=50wt.%PVP, ADC=0.24$$$\,\cdot$$$10-3mm2/s at 293K). Pairs have similar T1-values (W1/PVP1=1230/1210ms; W2/PVP2=760/680ms; W3/PVP3=550/500ms; W4/PVP4=420/380ms).AFI measurements were performed with Φ0 ranging from 0°-160° in 20°-steps. FAs inside each tube were averaged.
FA Reference: FA reference maps were acquired using the same setup and an accurate but slow preparation-pulse method10 (PEX) (FOV=256x128x5mm; resolution=2x2x5mm; TE/TR=3.40/8000ms). RF voltages of the rectangular preparation pulses were changed in steps of 50V (range 0-350V). FAs were averaged in each tube.
NMR Spectroscopy: 1H-NMR spectra of two PVP/D2O samples (20, 50wt.%PVP, T=298K) were acquired at a 1.88T spectrometer (Fourier80, Bruker). T1-times of the PVP resonances were measured by inversion recovery (TI=0-200ms, 20 timesteps).
EPG Simulation: Two 1D-EPG simulations, including diffusion, were performed:
i) using parameters (T1/T2/ADC) for PVP1-PVP4 and a single precession frequency to simulate the AFI signals S1/2 for different Φ0. FAs of the simulated RF-pulses were set to the FAs of the reference method.
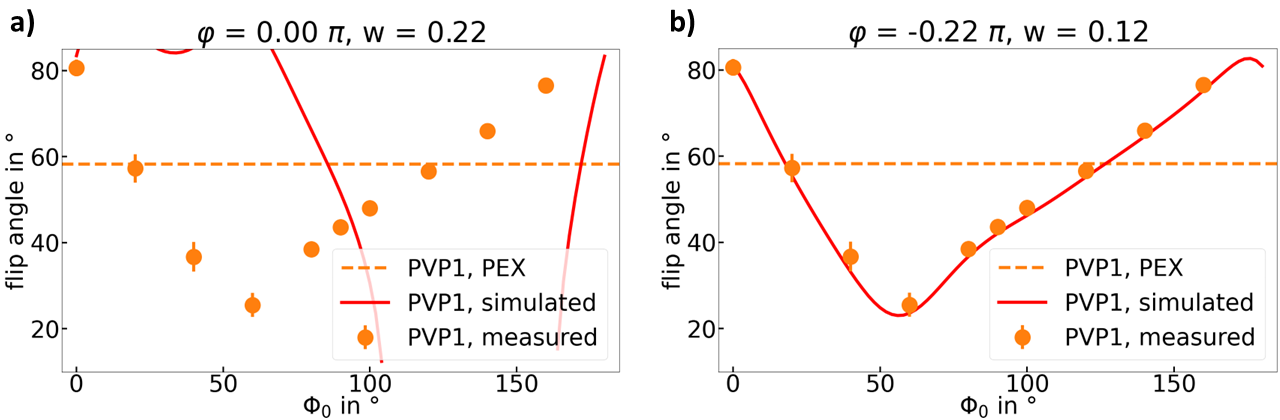
ii) For PVP1 showing the strongest effect, simulations for two precession frequencies with difference ∆ν were performed and signals were combined by:
$$S_{1/2}=S_{1/2,a}(T1_a,T2_a,ADC)+w\,\cdot\,S_{1/2,b}(T1_b,T2_b,ADC,\Delta\nu)e^{i(\Delta\nu\,\cdot\,TE+\varphi)}$$ with a weighting factor w and an additional phase term (Δν$$$\cdot$$$TE plus optional fitting phase φ) for S1/2,b. EPG simulations of S1/2,a were performed with T1/T2/ADC as in i). For S1/2,b (Δν=320Hz), values of T1b/T2b=100/6ms were used to resemble the PVP resonance from the 20wt.% PVP 1H-NMR spectrum.
Results and Discussion
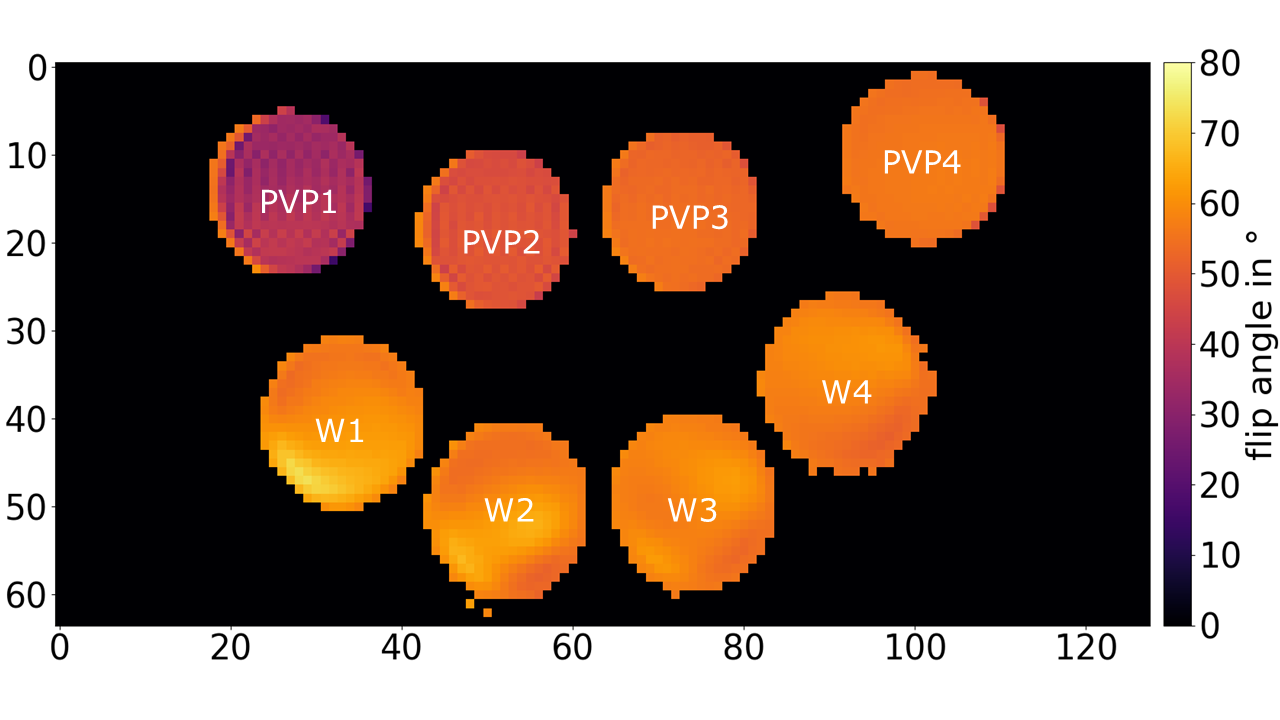
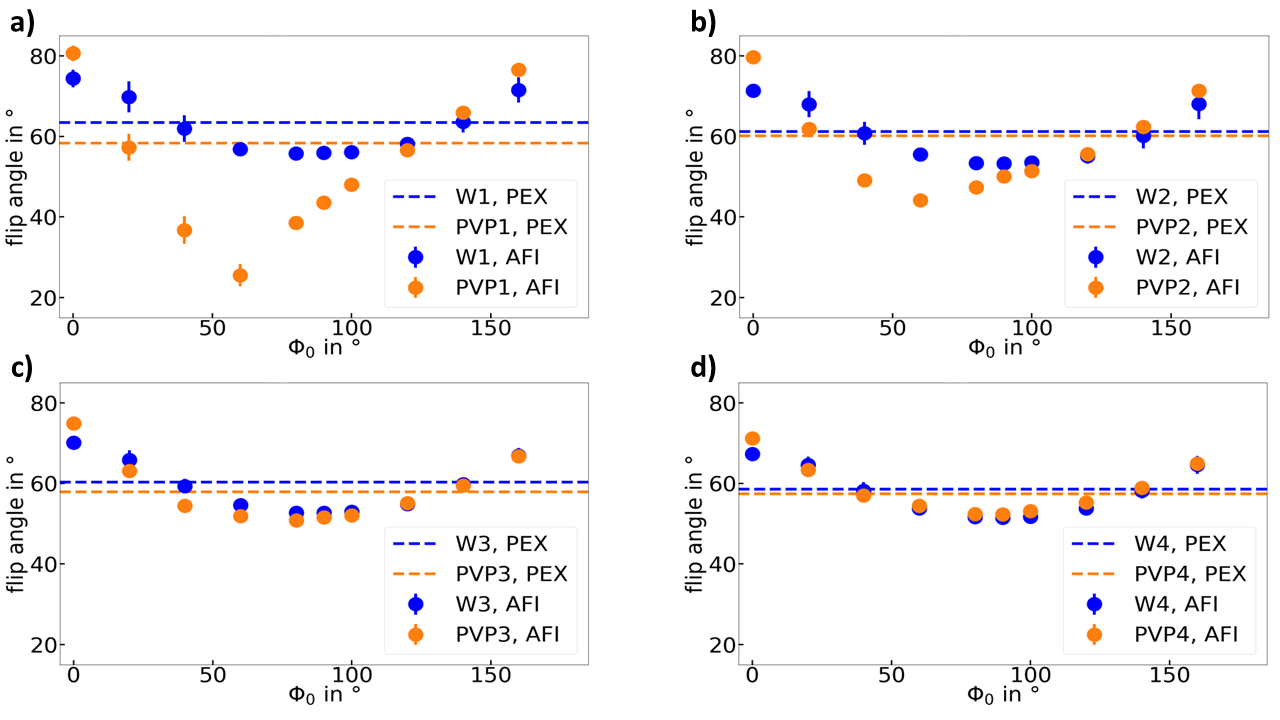
Fig.1 shows an AFI FA map with Φ0=40°. Deviations from the nominal FA (60°) are small (0.5-9.0%) for all tubes except PVP1(39%) and PVP2(18%).Fig.2 displays the effect of different spoil increments on AFI (FA(Φ0)) for the four tube pairs. Qualitatively, curves for water (W1-4) and PVP4 appear symmetric around Φ0=90°. All other PVP curves are asymmetric with a minimum at Φ0=60° and decreasing minimum values for decreasing PVP content.
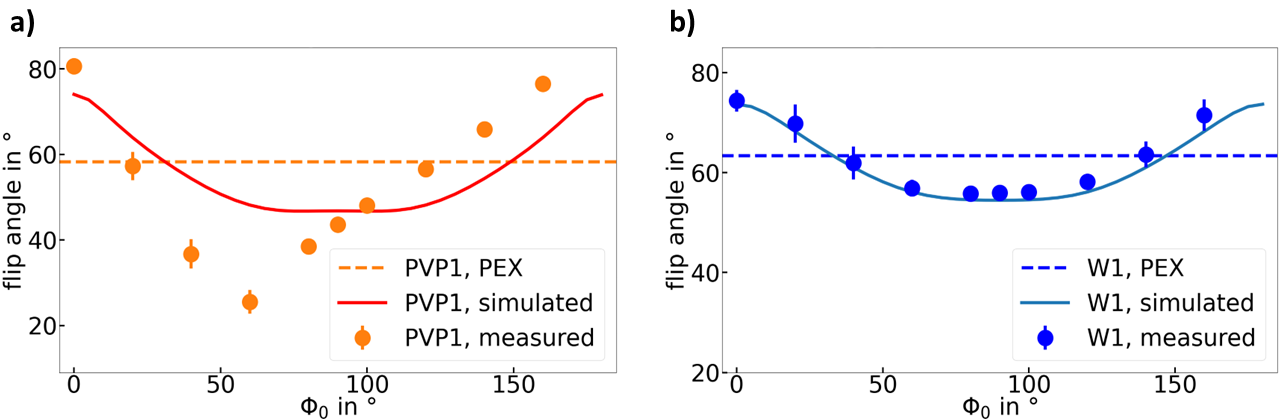
Fig.3 provides simulated and measured spoiling curves of PVP1/W1 together with the preparation-based reference scan. The single precession frequency approach was used as in ref8,11. Simulated and measured curves match qualitatively for W1 and agree with published results for water8,11. However, EPG simulations for one precession frequency do not reflect the asymmetry of PVP1-3. Therefore, their deviations from the nominal FA in AFI maps cannot be explained by spoiling-related errors alone.
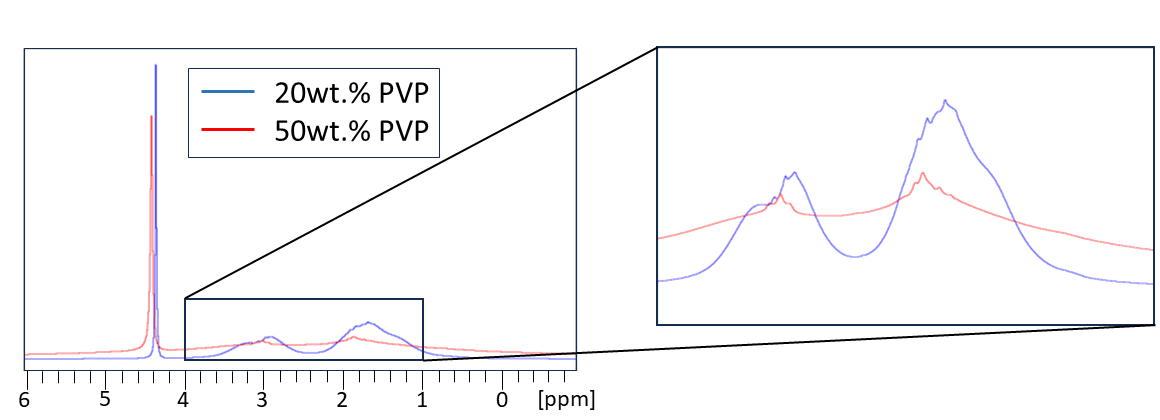
1H-NMR spectra of the PVP/D2O solution show two PVP resonances besides the residual water peak at 4.4ppm. PVP peaks of the 50wt.% PVP/D2O sample are broadened (FWHM/T2*=2.5ppm/1.6ms) compared to the 20wt.% sample (FWHM/T2*=0.7ppm/5.7ms). Measured T1-values are T120%=100ms and T150%=170ms. Thus, the short T1 in combination with high FAs in AFI are expected to impact the resulting signals.
Fig.5 displays the measured PVP1 curve and the EPG simulation considering two precession frequencies (one for water and one combined PVP frequency) and relative weights. By adjusting w and fitting φ≠0, the simulated curve shows good agreement with the measured one. Therefore, combining the AFI signals of multiple EPG simulations with different precession frequencies, enables the reproduction of the measured PVP spoiling curves. Due to the small T2*-times of the PVP resonances, this interference effect will vanish with increasing TE. Furthermore, higher gradient spoiling moments reduce this effect.
Conclusion
Under certain RF spoiling conditions, signals resulting from the PVP peaks must be considered for AFI-based FA validation measurements in PVP solutions. Taking this into account by increasing TE should allow for reliable AFI mapping in arbitrary PVP solutions even when using usual recommendations8 for choosing Φ0.Acknowledgements
The authors thank Małgorzata Marjańska for helpful discussion.References
1. Ladd ME, Bachert P, Meyerspeer M, Moser E, Nagel AM, Norris DG, Schmitter S, Speck O, Straub S, Zaiss M. Pros and cons of ultra-high-field MRI/MRS for human application. 2018;109:1-50.
2. Yarnykh VL. Actual flip-angle imaging in the pulsed steady state: A method for rapid three-dimensional mapping of the transmitted radiofrequency field. Magn Reson Med. 2007;57(1):192- 200.
3. Woo MK, DelaBarre L, Waks M, Radder J, Choi U-S, Lagore R, Ugurbil K, Adriany G. A 16-Channel Dipole Antenna Array for Human Head Magnetic Resonance Imaging at 10.5 Tesla. Sensors. 2021; 21(21):7250.
4. Schmidt S, Ertürk MA, He X, Haluptzok T, Eryaman Y, Metzger GJ. Improved 1 H body imaging at 10.5 T: Validation and VOP-enabled imaging in vivo with a 16-channel transceiver dipole array. Magn Reson Med. 2023 Sep 13. doi: 10.1002/mrm.29866. Epub ahead of print.
5. Ianniello C, de Zwart JA, Duan Q, Deniz CM, Alon L, Lee JS, Lattanzi R, Brown R. Synthesized tissue-equivalent dielectric phantoms using salt and polyvinylpyrrolidone solutions. Magn Reson Med. 2018;80(1):413-419.
6. Voelker MN, Kraff O, Pracht E, Wollrab A, Bitz AK, Stöcker T, Quick HH, Speck O, Ladd ME. Quality Assurance Phantoms and Procedures for UHF MRI ‒ The German Ultrahigh Field Imaging (GUFI) Approach. Proceedings of the 25th Annual Meeting of ISMRM, Abstract 3912.
7. Samsonov A, Velikina J, Yarnikh V. Accurate B1 Mapping with Actual Flip Angle Imaging (AFI) in the Presence of Fat. Proceedings of the 31st Annual Meeting of ISMRM, Abstract 0668.
8. Yarnykh VL. Optimal radiofrequency and gradient spoiling for improved accuracy of T1 and B1 measurements using fast steady-state techniques. Magn Reson Med. 2010;63(6):1610–1626.
9. Weigel M. Extended phase graphs: dephasing, RF pulses, and echoes - pure and simple. J Magn Reson Imaging. 2015 Feb;41(2):266-95.
10. Seifert F, Wübbeler G, Junge S, Ittermann B, Rinneberg H. Patient safety concept for multichannel transmit coils. J Magn Reson Imaging. 2007 Nov;26(5):1315-21.
11. Nehrke K. On the steady-state properties of actual flip angle imaging (AFI). Magn Reson Med. 2009 Jan;61(1):84-92.
Figures