4415
Comparative Analysis of Interpretable Machine Learning Approaches for Major Depressive Disorder Discrimination using rsfMRI1Department of Diagnostic Radiology, the University of Hong Kong, Hong Kong, Hong Kong, 2Department of Neurosurgery, Clinical Neuroscience Center, Ruijin Hospital, Shanghai Jiao Tong University School of Medicine, Shanghai, China, Ruijin-miHoYo lab, Clinical Neuroscience Center, Ruijin Hospital, Shanghai Jiao Tong University School of Medicine, Shanghai, China, ShangHai, China
Synopsis
Keywords: fMRI Analysis, fMRI (resting state)
Motivation: Resting-state functional magnetic resonance imaging (rsfMRI) holds significant promise as a predictive tool for assessing treatment response in individuals with major depressive disorder (MDD).
Goal(s): We aim to assess the credibility of model predictions using various explainers and identify the most salient regions contributing to MDD discrimination.
Approach: 3 representatives of explainable machine learning methods (CAM, LIME, SHAP) are employed in this study to explain model prediction in various views.
Results: This study demonstrates the superiority of LIME and SHAP for model explanation in the task of MDD discrimination using rsfMRI.
Impact: Our findings will provide effective guidance for the clinical diagnosis and treatment of MDD.
INTRODUCTION
Major depressive disorder (MDD) represents a significant global burden, often leading to disability. Brain imaging techniques have been helpful in understanding the root cause of MDD and exploring potential factors associated with it. Resting-state functional magnetic resonance imaging (rsfMRI) has emerged as a particularly valuable tool in this regard, exhibiting notable predictive capabilities in discriminating individuals with MDD and assessing their response to treatment interventions[1][2].In recent years, the availability of large-scale rsfMRI dataset, Rest-meta-MDD, has facilitated the advancement of sophisticated deep learning networks for the identification of MDD during the clinical diagnosis stage[3][4][5][6][7]. Nonetheless, these research predominantly concentrates on the initial phases of MDD diagnosis and identification, lacking a comprehensive elucidation of the specific brain regions and neural pathways that exhibit the strongest association with MDD. Consequently, these studies fall short in providing the essential guidance required for clinical therapeutic interventions targeting MDD.To address this limitation, explainable machine learning methods, including Class Activation Mapping (CAM)[8], Local Interpretable Model Agnostic Explanations (LIME)[9], and Shapley Additive exPlanations (SHAP)[10], offer valuable means to comprehend the decisions and rationales underlying model predictions, which is of utmost importance in establishing trust and understanding the factors driving MDD discrimination. In this study, our objective is to employ these interpretable methods to explicate the predictions made by commonly used machine learning methods in the task of discriminating MDD. By doing so, we aim to assess the credibility of model predictions and identify the most pertinent factors for MDD, such as relevant brain regions. Ultimately, our findings will provide effective guidance for the clinical diagnosis and treatment of MDD.
METHODS
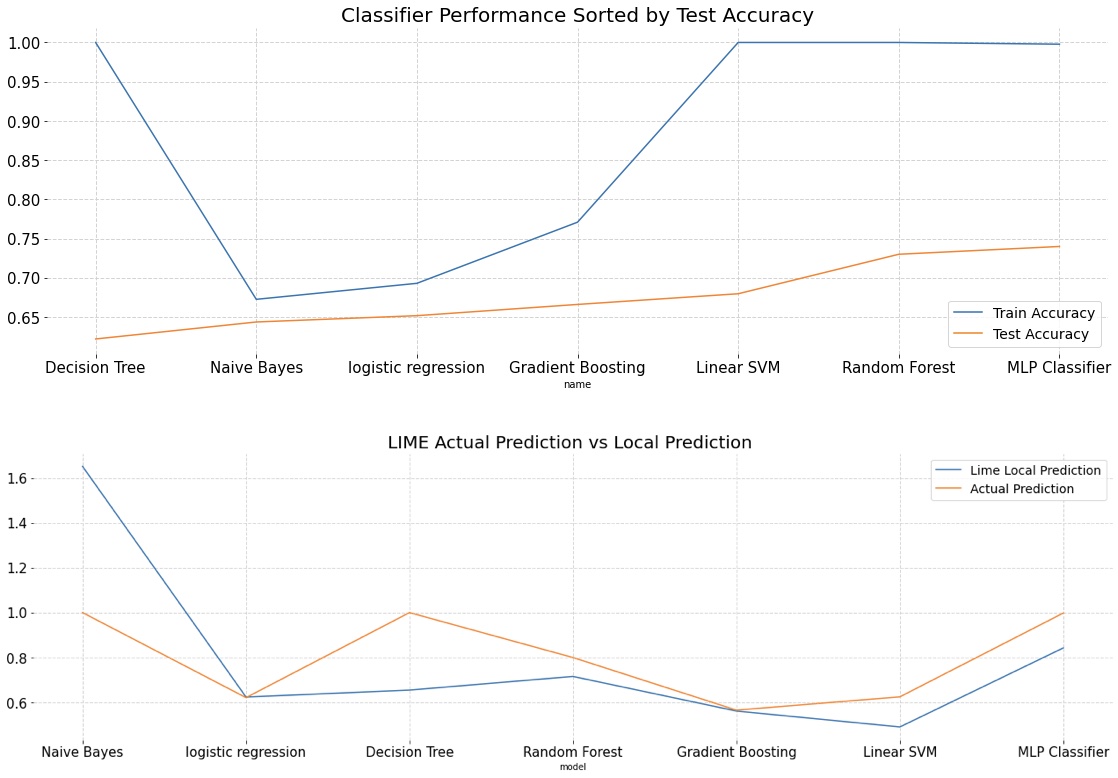
In this study, the dataset was sourced from the Rest-meta-MDD[11], comprising 2428 volunteers from 25 sites. Among the participants, 1300 were depression patients, while 1128 served as normal controls. Each subject had 13 types of result images available. To analyze the data, the entire brain was divided into 116 regions of interest (ROIs) using the Automated Anatomical Labeling (AAL) atlas[12]. For each brain region, 12 features were derived by multiplying the corresponding result image with the AAL atlas. Furthermore, a functional connectivity matrix with dimensions of 116 x 116 was generated using processing methods consistent with previous studies [4]. The nodal efficiency, extracted from this connectivity matrix, was included as an additional feature. Moreover, subject-specific characteristics such as age, gender, and years of education were integrated into the dataset. As a result, a total of 16 features were obtained for each brain region.In this study, seven machine learning methods are employed for the discrimination of major depressive disorder (MDD), and their performance is illustrated in Figure 1. To gain insights into the decision-making process and rationale behind the model predictions, three representative explainable machine learning methods (CAM, LIME, SHAP) are employed. These methods aim to elucidate the model predictions from different perspectives and identify the top 10 salient brain regions that contribute to the classification task.
CAM, a model-specific approach, is capable of providing explanations for linear classifiers on all cases. LIME, on the other hand, can reliably explain predictions made by any classifier by approximating the model locally with an interpretable model. SHAP employs Shapley Values to explain the model's predictions for a given input by quantifying the contribution of each feature. Both LIME and SHAP are model-agnostic, meaning they can be applied to a wide range of models.
By leveraging these explainable machine learning methods, this study aims to shed light on the interpretability of the models used in MDD discrimination and identify the key brain regions that are most relevant to the classification task.
RESULTS
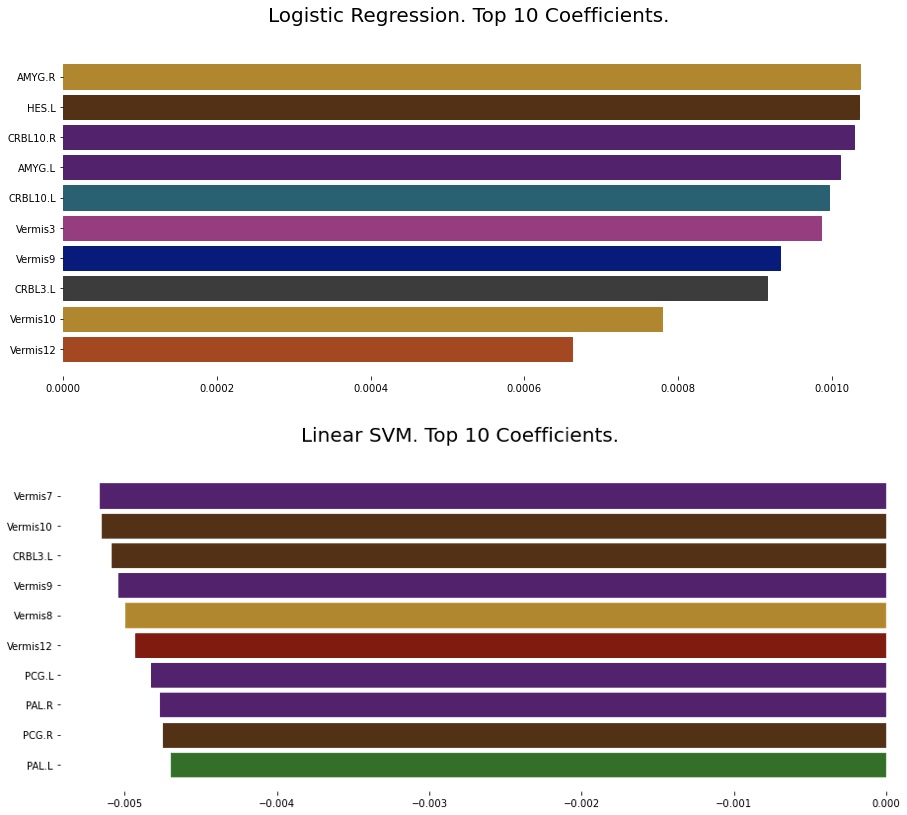
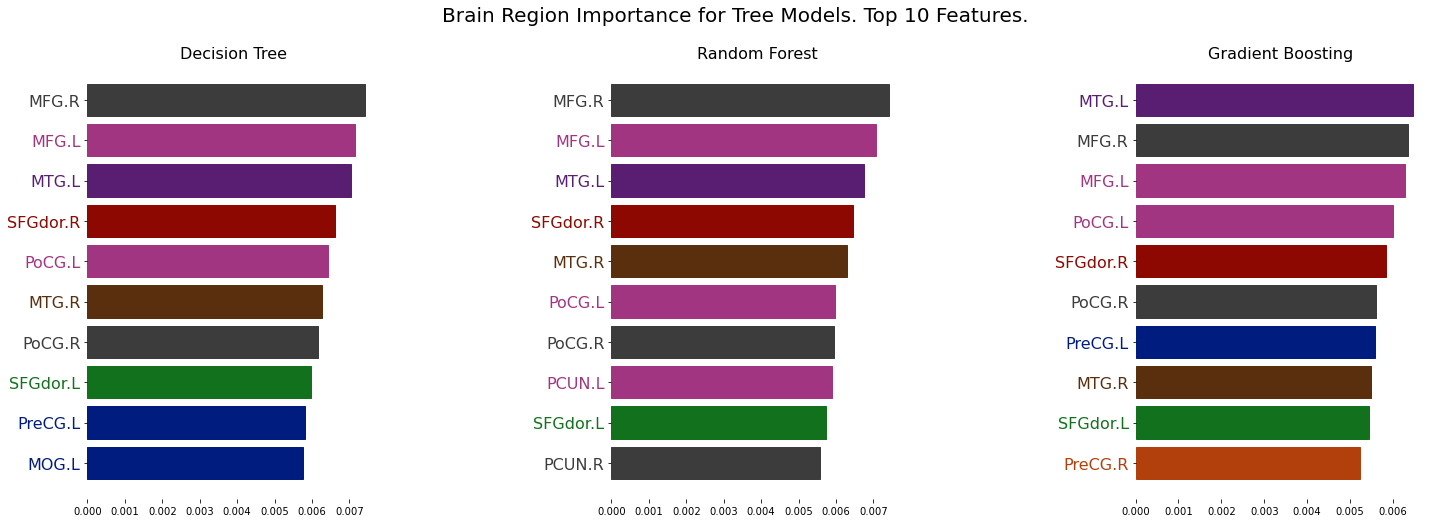
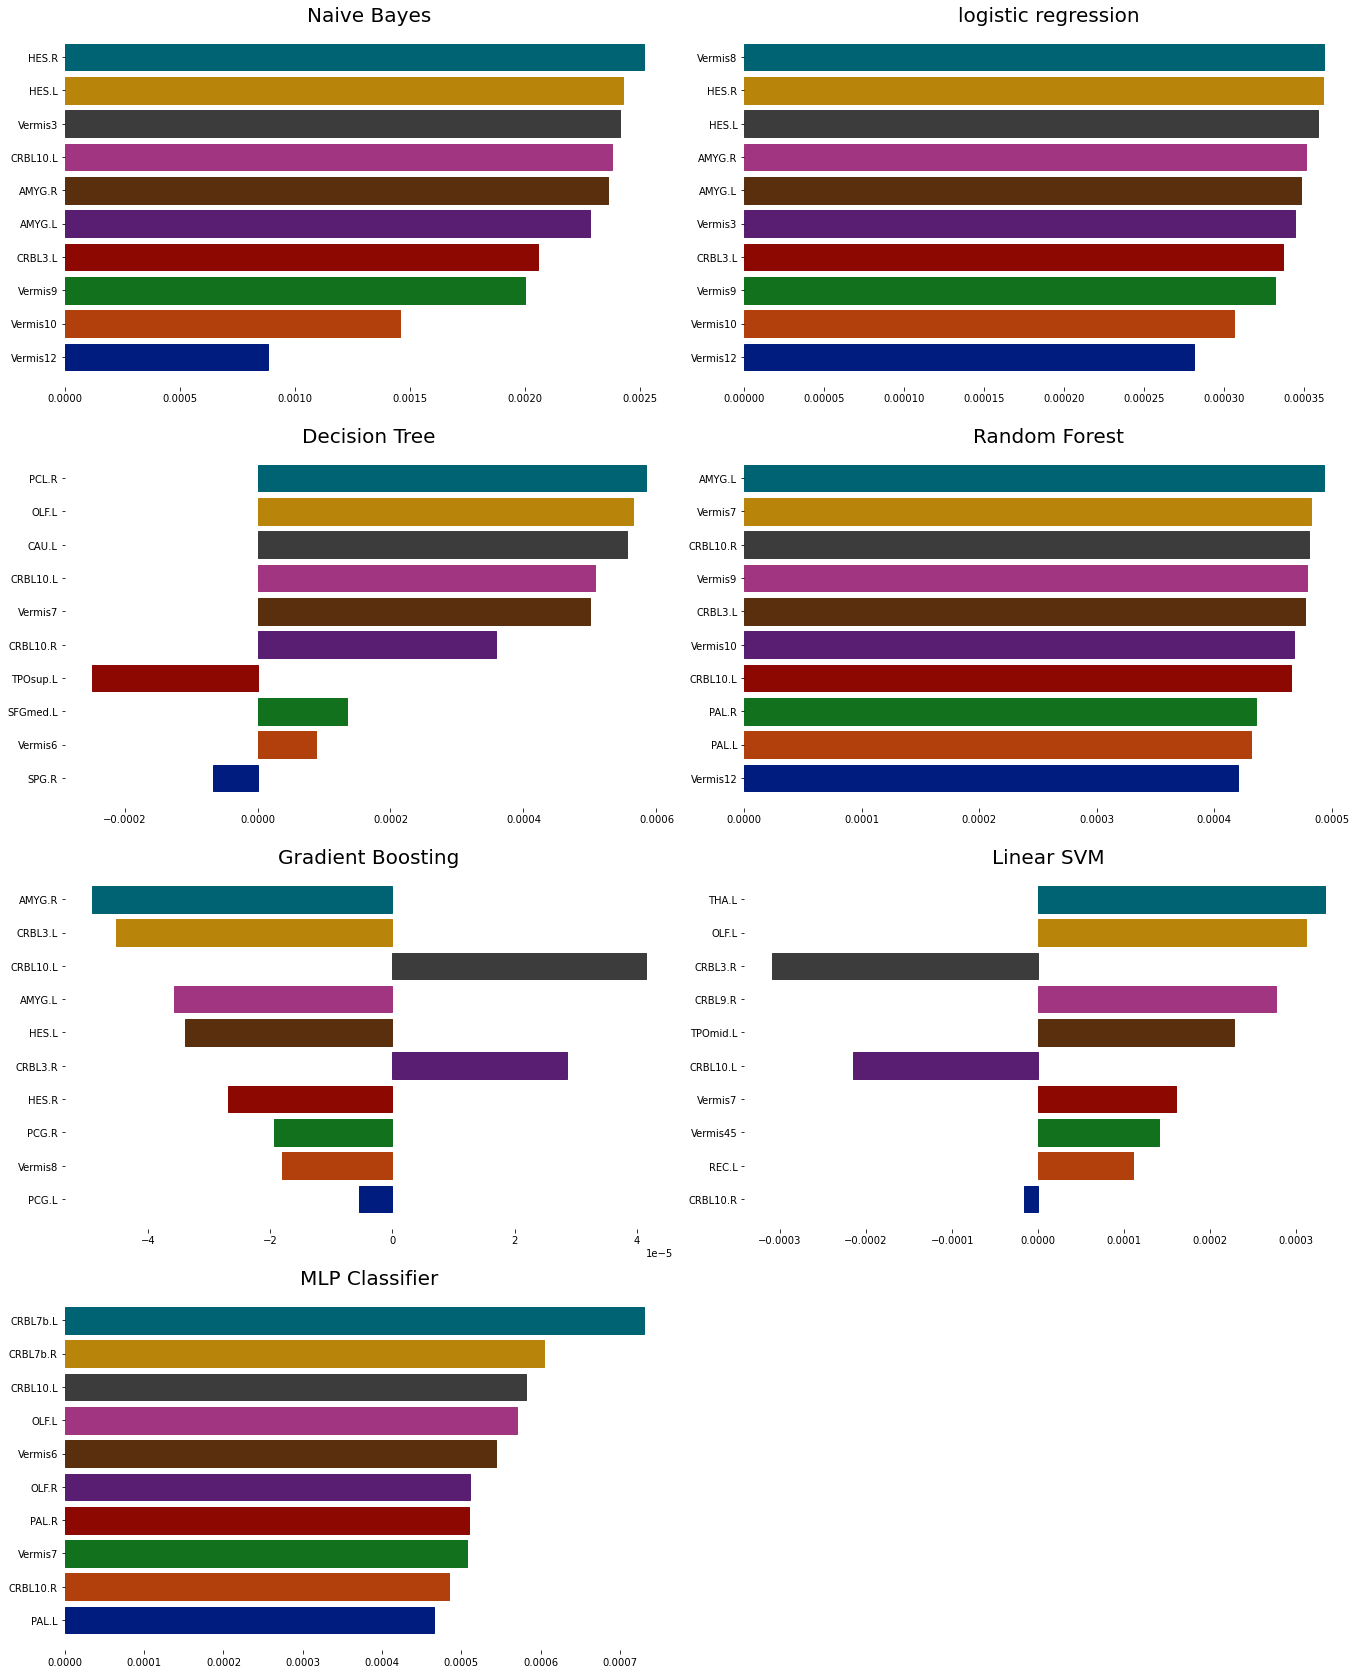
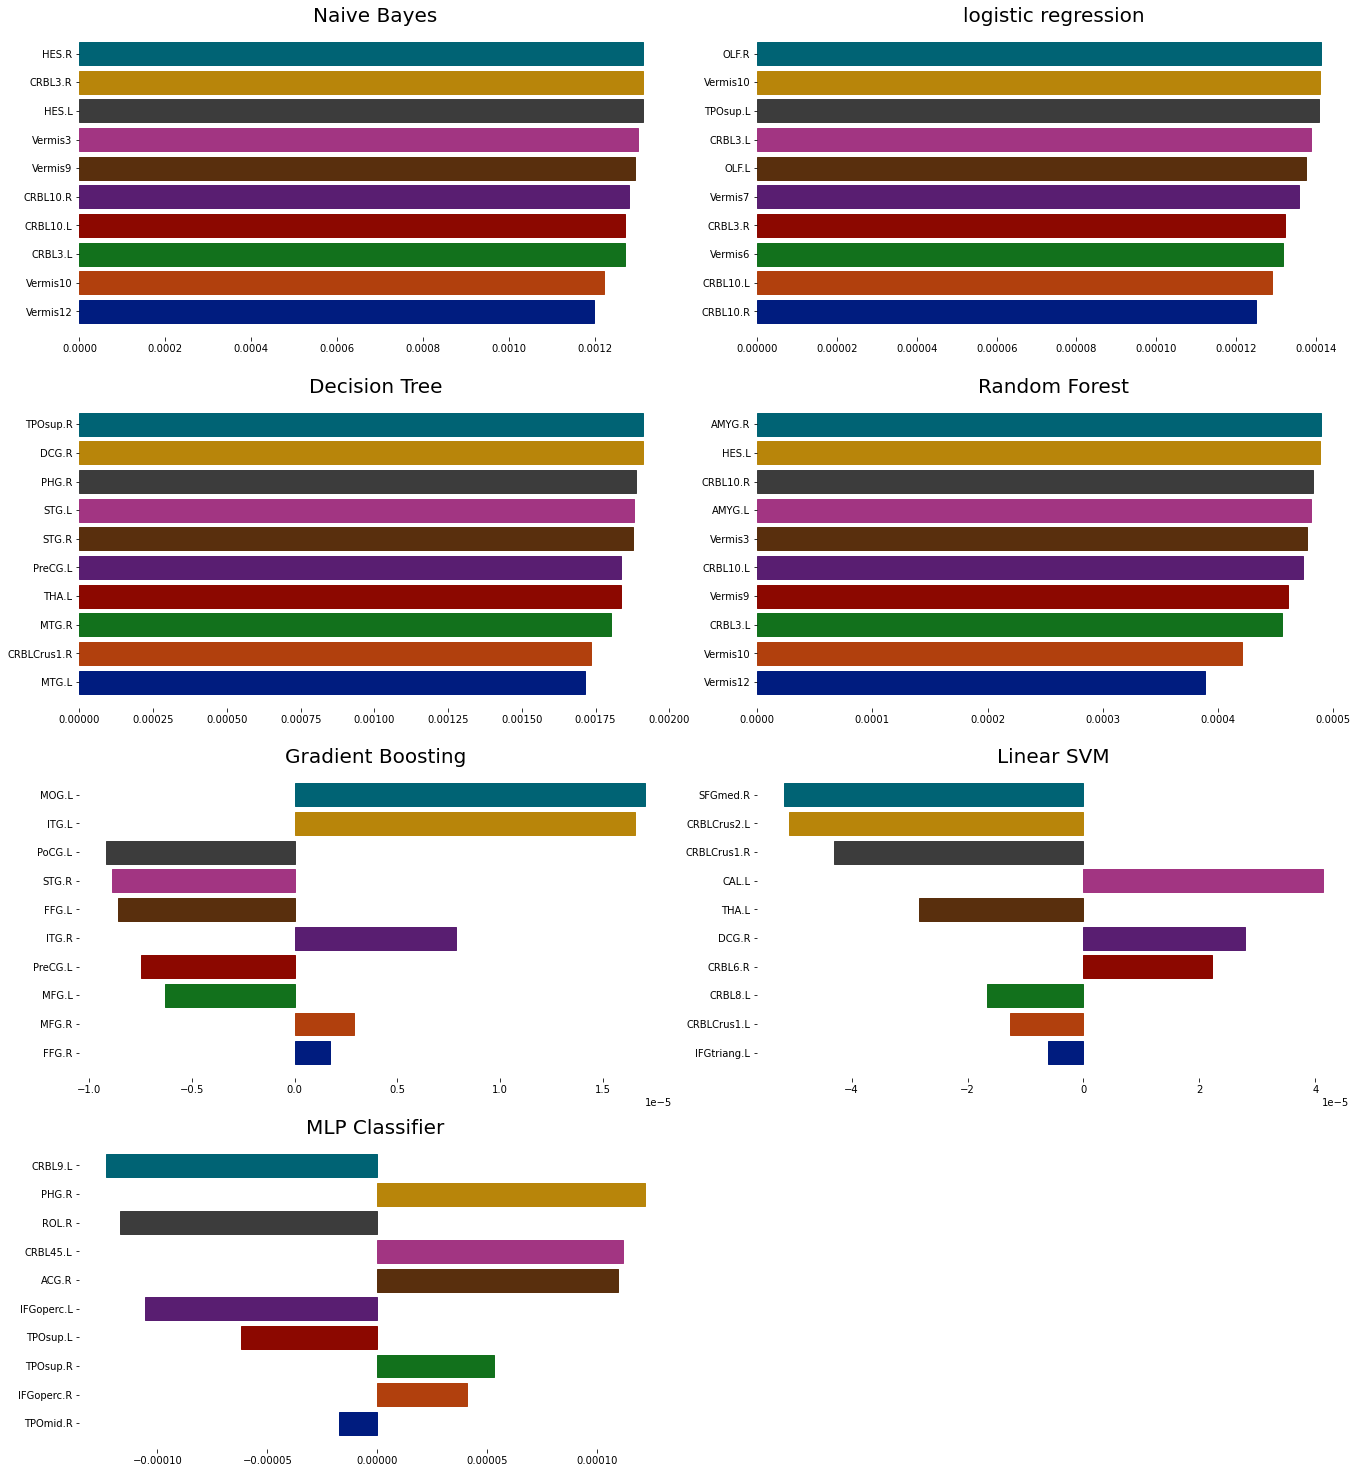
Figures 2 and 3 depict the explainable performance of the CAM method on LR (logistic regression), linear SVM, and tree models. However, the observed difference in weights among the top 10 salient regions is not substantial. This finding suggests that determining the most influential regions contributing to the classification task is not easily discernible.Figures 4 and 5 showcase the interpretability of LIME and SHAP across all classifiers, demonstrating excellent performance, particularly with linear SVM and gradient boosting models.
At the bottom of Figure 1, notable improvements are demonstrated by incorporating the LIME explainer. The close alignment between the local and global predictions of most classifiers indicates high credibility in the model's predictions and a more reliable selection of relevant regions. This underscores the efficacy of the LIME explainer in enhancing the interpretability of the classifiers.
CONCLUSION
This study highlights the superior performance of LIME and SHAP as model explanation methods in the context of discriminating MDD using rsfMRI data.Acknowledgements
No acknowledgement found.References
[1] “Psychoradiology: The Frontier of Neuroimaging in Psychiatry | Radiology.” Accessed: Nov. 08, 2023. [Online]. Available: https://pubs.rsna.org/doi/abs/10.1148/radiol.2016152149
[2] G. S. Dichter, D. Gibbs, and M. J. Smoski, “A systematic review of relations between resting-state functional-MRI and treatment response in major depressive disorder,” J. Affect. Disord., vol. 172, pp. 8–17, Feb. 2015, doi: 10.1016/j.jad.2014.09.028.
[3] A. Shoeibi et al., “Diagnosis of brain diseases in fusion of neuroimaging modalities using deep learning: A review,” Inf. Fusion, vol. 93, pp. 85–117, May 2023, doi: 10.1016/j.inffus.2022.12.010.
[4] K. Qin et al., “Using graph convolutional network to characterize individuals with major depressive disorder across multiple imaging sites,” eBioMedicine, vol. 78, Apr. 2022, doi: 10.1016/j.ebiom.2022.103977.
[5] “Frontiers | The classification of brain network for major depressive disorder patients based on deep graph convolutional neural network.” Accessed: Nov. 08, 2023. [Online]. Available: https://www.frontiersin.org/articles/10.3389/fnhum.2023.1094592/full
[6] S. Venkatapathy et al., “Ensemble graph neural network model for classification of major depressive disorder using whole-brain functional connectivity,” Front. Psychiatry, vol. 14, 2023, Accessed: Nov. 08, 2023. [Online]. Available: https://www.frontiersin.org/articles/10.3389/fpsyt.2023.1125339
[7] H.-G. Wang, Q.-H. Meng, L.-C. Jin, and H.-R. Hou, “AMGCN-L: an adaptive multi-time-window graph convolutional network with long-short-term memory for depression detection,” J. Neural Eng., vol. 20, no. 5, p. 056038, Oct. 2023, doi: 10.1088/1741-2552/ad038b.
[8] B. Zhou, A. Khosla, A. Lapedriza, A. Oliva, and A. Torralba, “Learning Deep Features for Discriminative Localization,” in 2016 IEEE Conference on Computer Vision and Pattern Recognition (CVPR), Jun. 2016, pp. 2921–2929. doi: 10.1109/CVPR.2016.319.
[9] M. T. Ribeiro, S. Singh, and C. Guestrin, “‘Why Should I Trust You?’: Explaining the Predictions of Any Classifier,” in Proceedings of the 22nd ACM SIGKDD International Conference on Knowledge Discovery and Data Mining, in KDD ’16. New York, NY, USA: Association for Computing Machinery, Aug. 2016, pp. 1135–1144. doi: 10.1145/2939672.2939778.
[10] S. M. Lundberg and S.-I. Lee, “A Unified Approach to Interpreting Model Predictions,” in Advances in Neural Information Processing Systems, Curran Associates, Inc., 2017. Accessed: Nov. 08, 2023. [Online]. Available: https://proceedings.neurips.cc/paper/2017/hash/8a20a8621978632d76c43dfd28b67767-Abstract.html
[11] X. Chen et al., “The DIRECT consortium and the REST-meta-MDD project: towards neuroimaging biomarkers of major depressive disorder,” Psychoradiology, vol. 2, no. 1, pp. 32–42, Mar. 2022, doi: 10.1093/psyrad/kkac005.
[12] E. T. Rolls, C.-C. Huang, C.-P. Lin, J. Feng, and M. Joliot, “Automated anatomical labelling atlas 3,” NeuroImage, vol. 206, p. 116189, Feb. 2020, doi: 10.1016/j.neuroimage.2019.116189.
Figures