4412
Spatio-temporal Consistency Analysis of Cerebral Small Vessel Disease: A fMRI study1Department of Radiology, First People's Hospital of Zigong City, Zigong, China, 2Sichuan Vocational College of Health and Rehabilitation, Zigong, China, 3MR Research Collaboration, Siemens Healthineers, Chengdu, China, 4MRI clinical application, Customer Service Department, Siemens Digital Medical Technology Co., LTD, Shanghai, China
Synopsis
Keywords: fMRI Analysis, fMRI (resting state), Cerebral small vessel disease; FOCA; SVD score
Motivation: Cerebral small vessel disease (SVD) affects older adults, but traditional approaches have limited understanding of the neural mechanisms of SVD.
Goal(s): To explore the effects of SVD on brain regions and its relationship to cognitive decline by FOCA method.
Approach: MRI data from 42 SVD patients and 38 controls were analyzed using FOCA values, and the correlation between FOCA values of SVD patients and SVD score was explored.
Results: Different FOCA value changes in SVD patients were associated with regions of cognitive function.
Impact: This study has the potential to improve our understanding of the neural mechanisms of SVD, suggesting that FOCA values provide a new method to analyzing changes in cognitive function.
Introduction
Cerebral small vessel disease (SVD) is a common chronic progressive vascular disease in the elderly, and has been recognized as a "whole brain disease"1. In previous studies, many authors have used amplitude of low frequency fluctuations (ALFF) or regional homogeneity (ReHo) methods to characterize different regions of the SVD brain2. However, the four-dimensional consistency of local neural activity (FOCA) method, by evaluating the spatio-temporal consistency of spontaneous brain activity signals between neighbors, offers a more comprehensive and nuanced analysis than the ALFF or ReHo methods, avoiding the limitations of solely focusing on the temporal correlation of local neighboring voxels and thereby advancing our understanding of SVD. Given that the total SVD score serves as a comprehensive assessment index of overall brain damage and cognitive performance3, this study employed FOCA to explore the characteristics of different brain regions in SVD patients, and the correlation between the these differences and total MRI burden of SVD.Methods
Forty-two patients with SVD and thirty-eight healthy controls were recruited in this study (Table 1). MRI data were acquired using 3T MR scanner (MAGNETOM VIDA, Siemens Healthineers, Erlangen, Germany), with a 64-channel head coil. Resting-state functional images were acquired using echo-planar imaging sequence with the following parameters: TR/TE = 1500/30 ms, flip angle = 70°, FOV = 192×192mm2, matrix = 94×94, thickness = 3 mm, gap = 0.75 mm, slices =36. Structural images were acquired using MP2RAGE sequence with parameters as detailed in the reference4.Resting-state fMRI data were preprocessed using SPM12. For each voxel, FOCA value was calculated as mean temporal and spatial correlation of a local region from normalized functional images. The SVD score was determined using a previously described four-point scale with neuroimaging characteristics of SVD, including white matter hyperintensities (WMH) of presumed vascular origin, deep cerebral microbleeds (CMB), lacunar infarctions (LI), and enlarged perivascular spaces (PVS)3. The entire brain was divided into 116 brain regions using the Anatomical Automatic Labeling (AAL) as masks.
Statistical analyses were performed by using the SPM12. Differences between groups were analyzed using two-sample t-tests with age, sex, and mean frame-direction displacement (mFD) as covariates. The criterion for statistical significance was p < 0.05, and false discovery rate (FDR) used to correct for multiple comparisons (cluster size > 23). Pearson correlation analysis was used to analyze the association of brain regions with inter-group differences with total SVD score.
Result
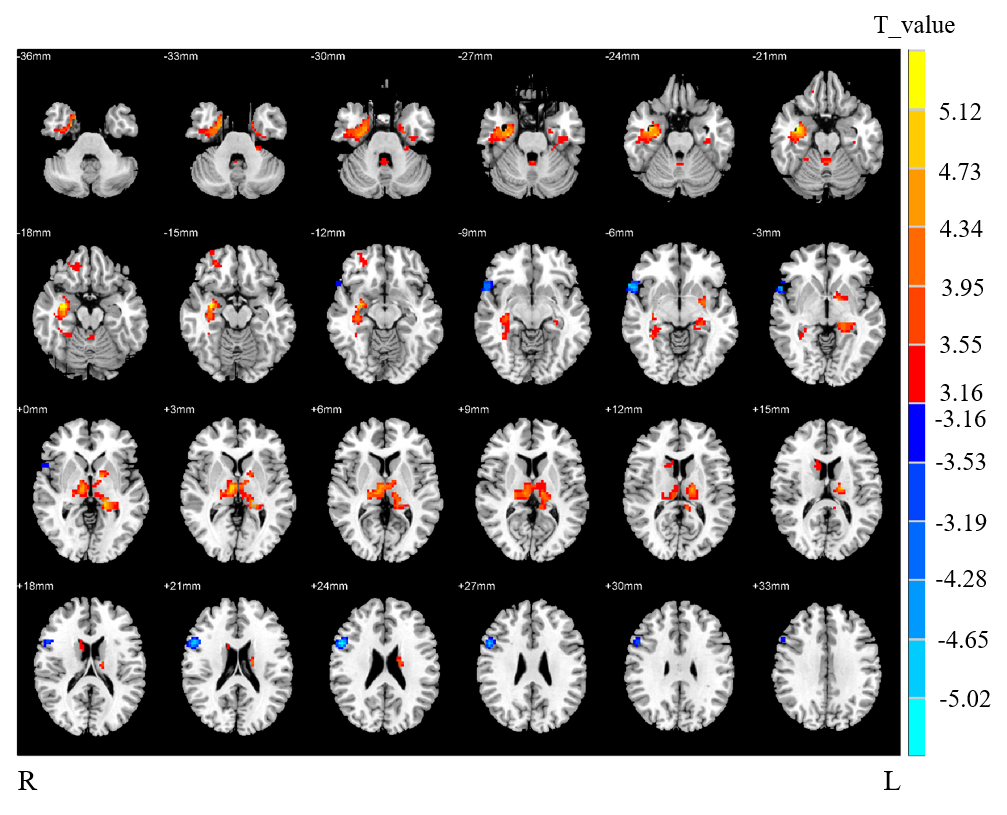
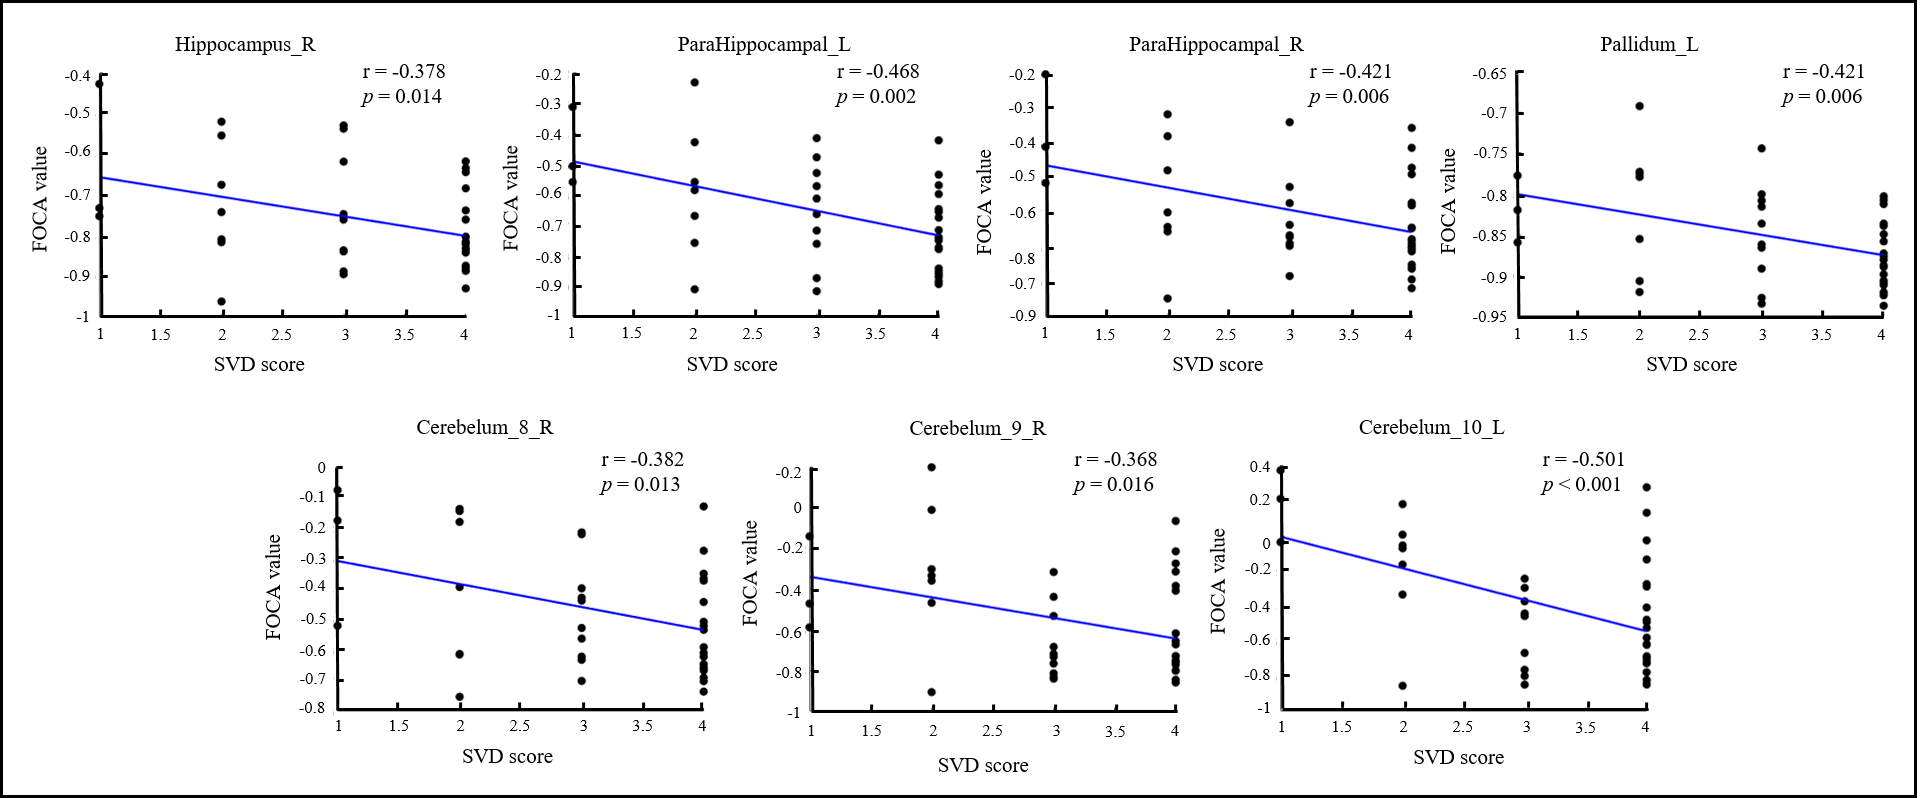
In a comparative analysis with HC, we observed a statistically increase in FOCA values for SVD across several regions, notably the bilateral hippocampus, parahippocampal, thalamus, right fusiform, precuneus, caudate, pallidum, temporal_inf, cerebelum_8, cerebelum_9, and left cerebelum_10. In contrast, a significantly decrease in FOCA values of CSVD were found in right frontal_inf_oper and temporal_pole_sup regions, as delineated in Figure 1.According to the correlation analysis, we identified a significant association between FOCA values in distinct brain regions and the SVD score((p < 0.05). The FOCA values in the brain regions of significant differences were correlated with the SVD score (p < 0.05, FDR corrected). As shown in Figure 2, the SVD score was negative correlation with the FOCA values of right hippocampus (r = -0.378, p = 0.0137), bilateral parahippocampal (right: r = -4.21, p = 0.0055; left: r = -0.468, p = 0.0018), left pallidum (r = -0.421, p = 0.0056), right cerebelum_8 (r = -0.382, p = 0.0127), right cerebelum_9 (r = -0.368, p =0.0163), left cerebelum_10 (r = -0.501, p = 0.0007).
Discussion
In this study, we found decreased FOCA value in the right frontal_inf_oper and temporal_pole_sup, suggesting the presence of underlying neurological impairments specific to SVD. Elevated FOCA values in regions such as the hippocampus, cerebellum, and basal ganglia may reflect adaptive neural mechanisms, possibly a compensatory response to the challenges posed by SVD5. SVD score was negatively correlated with the FOCA, especially in important regions related to cognition, which may be due to cognitive function changes6.Conclusion
Our study suggests that the altered FOCA values in some brain regions may be associated with reduced cognitive function in patients with SVD, and the FOCA method may has the potential to provide important imaging references for understanding the underlying neural mechanisms of SVD.Acknowledgements
We thank all the subjects for their participation in our study. This work was supported by grants from the Bureau of Zigong City Science and Technology (2021ZC09).References
1. Ter Telgte, A, Van Leijsen EM, Wiegertjes K, et al. Cerebral small vessel disease: from a focal to a global perspective. Nat Rev Neurol. 2018; 14(7):387-398.
2. Mo, Y, Mao C, Yang D, et al. Altered neuroimaging patterns of cerebellum and cognition underlying the gait and balance dysfunction in cerebral small vessel disease. Front Aging Neurosci. 2023; 15:1117973.
3. Staals, J, Makin SD, Doubal FN, et al. Stroke subtype, vascular risk factors, and total MRI brain small-vessel disease burden. Neurology. 2014; 83(14):1228-1234.
4. Knussmann, GN, Anderson JS, Prigge MB, et al. Test-retest reliability of FreeSurfer-derived volume, area and cortical thickness from MPRAGE and MP2RAGE brain MRI images. Neuroimage: Reports. 2022; 2(2):100086.
5. Chojdak-Łukasiewicz, J, Dziadkowiak E, Zimny A, et al. Cerebral small vessel disease: A review. Adv Clin Exp Med. 2021; 30(3):349-356.
6. Del Brutto, VJ, Ortiz JG, Del Brutto OH, et al. Total cerebral small vessel disease score and cognitive performance in community‐dwelling older adults. Results from the Atahualpa Project. Int J Geriatr Psych. 2018; 33(2):325-331.
Figures