4411
Functional Network-Based Statistics Reveal Abnormal Resting-State Functional Connectivity in Parkinson’s Disease with Apathy1The Department of Radiology, China-Japan Union Hospital of Jilin University, Changchun, China, 2MR Research Collaboration, Siemens Healthineers, Beijing, China
Synopsis
Keywords: Functional Connectivity, fMRI (resting state), Parkinson’s disease, apathy, network-based statistics
Motivation: Apathy is a common and disabling symptom of Parkinson’s disease (PD), yet brain networks involved in Patients with PD with apathy (PD-A) remain underexplored.
Goal(s): The aim of our study was to identify brain networks of PD-A using network-based statistics (NBS).
Approach: Resting-state fMRI data was obtained from twenty-eight patients with PD-A, 19 PD patients without apathy (PD-NA), and 32 healthy controls (HCs). A network-based statistic analysis was used to isolate networks of interconnected nodes that differ among the three groups.
Results: PD-A showed decreased connectivities in control network, default network, attention network, somatomotor network, temporoparietal network, and visual network.
Impact: We performed NBS analysis to identify brain networks related to PD-A at the whole-brain functional connectome level for the first time. NBS is a validated nonparametrical statistical approach for understanding the neural mechanisms of PD-A.
Apathy is one of the most prevalent and disabling nonmotor symptoms of Parkinson’s disease (PD)[1], which affects approximately 40% of PD patients[2].However, the pathophysiology of apathy in PD is still unclear. We aimed to investigate Patients with PD with apathy (PD-A) brain functional network changes through network-based statistical analysis (NBS)[3].
Methods
Participants
Twenty-eight patients with PD-A, 19 PD patients without apathy (PD-NA), and 32 gender- and age-matched healthy controls (HCs) were enrolled. All subjects completed the collection of demographic data, the apathy scale (AS), the Mini Mental State Examination (MMSE), the Hamilton Anxiety Scale (HAMA), the Hamilton Depression Scale (HAMD), and the Unified Parkinson's Disease Rating Scale and H&Y stage. They were administered at least 12 h after PD patients stopped taking medication.
MRI Data Acquisition
All MRI data were obtained using a 3T system (MAGNETOM Skyra, Siemens Healthineers, Erlangen, Germany). Functional images were acquired by a simultaneous multi-slice (SMS) echo-planar imaging (EPI) sequence with the parameters as follows: repetition time (TR) = 1500 ms, echo time (TE) = 30 ms, flip angle (FA) = 70°, matrix size = 112 × 112, slice thickness/gap = 2 mm/0.4 mm, slice acceleration factor = 4, parallel acceleration factor = 2, voxel size = 2 × 2 × 2 mm, field of view (FOV) = 224 mm × 224 mm, and slice numbers = 68.
Functional MRI Data Preprocessing
The functional images data were processed and analyzed using SPM12 software and RESTplus 1.25[4] in the MATLAB 2017b platform by 1) excluding the first 10 volumes; 2) slice timing correction; 3) head motion correction; 4) spatial normalization and resampling to 3 × 3 × 3 mm voxels; 5) spatial smoothing with an isotropic Gaussian kernel with a full width at half maximum (FWHM) of 6 mm; 6) removing the linear trend of the time course; and 7) nuisance covariate regression, which includes Friston-24 head motion parameters, white matter signal, and cerebrospinal fluid signal.
Network-Based Statistics
In order to obtain a whole-brain FC matrix for each subject, we defined a set of 114 nodes across the brain based on the Yeo network template[5]. For a given node region, the mean time course was calculated as the average of the fMRI time series from all voxels within that region. Then, the correlation matrices could be obtained by computing the Pearson correlation coefficient between the mean time course of each pair of nodes.
Results
The AS scores were significantly different among three groups. The Unified Parkinson’s Disease Rating Scale, H&Y stage, and equivalent daily dose of levodopa were significantly different between the PD-A and PD-NA groups. Additionally, the MMSE, HAMA, and HAMD were significantly different between the PD-A and HCs groups (p < 0.05). There were no significant differences in age, gender, or years of education among the three groups; moreover, there were no significant differences in MMSE, HAMA, or HAMD between PD-A and PD-NA, as well as in MMSE between the PD-NA and HCs groups (p > 0.05). (Table 1)
According to the NBS results, compared to PD-NA, the functional connectivity values of the control network, the default network, the dorsal attention network, the ventral attention network, the somatomotor network, the temporoparietal network, and the visual network decreased in PD-A groups. Most of the changes to the functional connectivity values focused on the control and default networks. (Figure 1) Compared to HCs, the functional connectivity values of the ventral attention network, the control network, the dorsal attention network, the somatomotor network, the default network, the temporoparietal network, the visual network, and the limbic network decreased in PD-A groups; most of the changes to the functional connectivity values focused on the ventral attention and control networks (p < 0.01). (Figure 2) There was no significant difference between PD-NA and HCs.
Discussion
Our study showed that compared with HCs, the PD-A most of the changes to the functional connectivity values focused on the control and default networks. The abnormalities in control and default networks lead to execution disorders and attention deficits, triggering the occurrence of PD symptoms[6]. We also indicated that compared with PD-NA, the PD-A most of the changes to the functional connectivity values focused on ventral attention and control networks. The dysfunction of control networks and ventral attention networks lead to apathy[7-9].
Conclusion
In summary, our findings indicated that ventral attention and control networks dysfunction may be one of the core issues in the pathophysiology of PD-A.
Acknowledgements
We thank Fan Wang, Qing Wang, Yueluan Jiang (Siemens Healthineers Ltd.), Yayun Yan, and Jiuqin He for their help.References
[1] SKIDMORE F M, YANG M, BAXTER L, et al. Apathy, depression, and motor symptoms have distinct and separable resting activity patterns in idiopathic Parkinson disease [J]. Neuroimage, 2013, 81: 484-95.
[2] DEN BROK M G, VAN DALEN J W, VAN GOOL W A, et al. Apathy in Parkinson's disease: A systematic review and meta-analysis [J]. Mov Disord, 2015, 30(6): 759-69.
[3] ZALESKY A, FORNITO A, BULLMORE E T. Network-based statistic: identifying differences in brain networks [J]. Neuroimage, 2010, 53(4): 1197-207.
[4] JIA X-Z, WANG J, SUN H-Y, et al. RESTplus: an improved toolkit for resting-state functional magnetic resonance imaging data processing [J]. Science Bulletin, 2019, 64(14): 953-4.
[5] YEO B T, KRIENEN F M, SEPULCRE J, et al. The organization of the human cerebral cortex estimated by intrinsic functional connectivity [J]. J Neurophysiol, 2011, 106(3): 1125-65.
[6] MAIDAN I, JACOB Y, GILADI N, et al. Altered organization of the dorsal attention network is associated with freezing of gait in Parkinson's disease [J]. Parkinsonism Relat Disord, 2019, 63: 77-82. [7] JONES D T, GRAFF-RADFORD J. Executive Dysfunction and the Prefrontal Cortex [J]. Continuum (Minneap Minn), 2021, 27(6): 1586-601.
[8] BROYD S J, DEMANUELE C, DEBENER S, et al. Default-mode brain dysfunction in mental disorders: a systematic review [J]. Neurosci Biobehav Rev, 2009, 33(3): 279-96.
[9] RAICHLE M E. The brain's default mode network [J]. Annu Rev Neurosci, 2015, 38: 433-47.
Figures
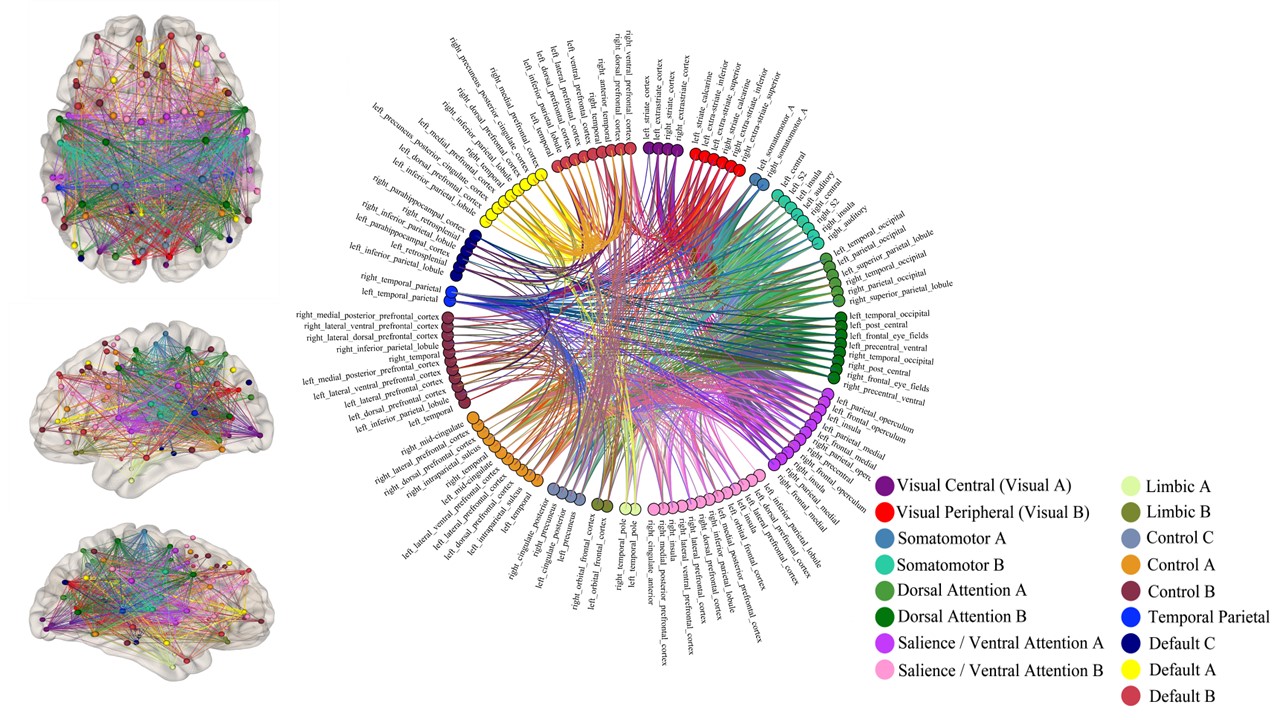
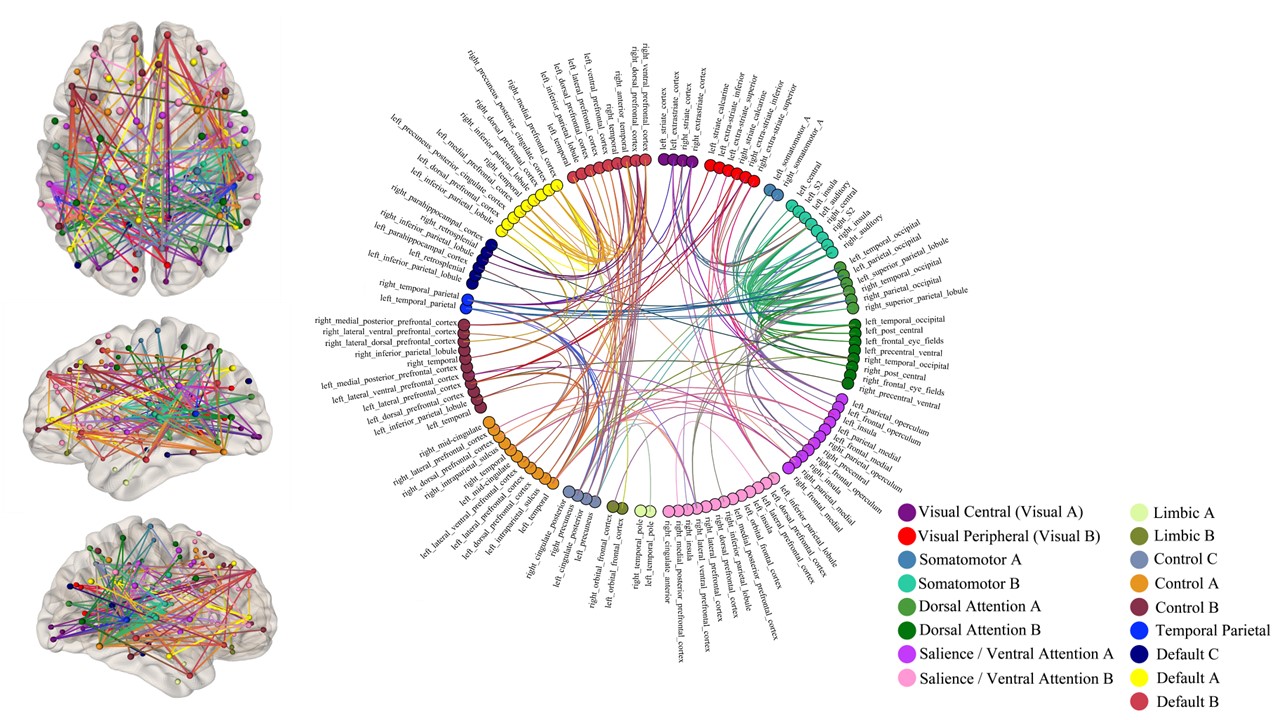
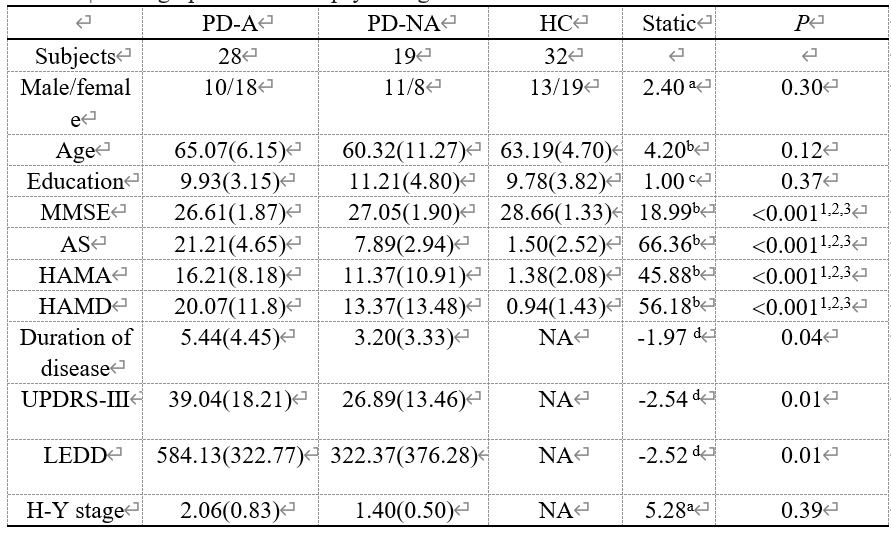
Table 1 | Demographic and neuropsychological information.
a: Pearson’s chi-square (X2); b: Kruskal–Wallis H test; c: One-way analysis of variance; d: Mann–Whitney U test; 1: Post hoc paired comparisons between PD-A and PD-NA groups;2: Post hoc paired comparisons between PD-A and HCgroups;3: Post hoc paired comparisons between PD-NA and HC groups;