4410
Functional alterations in white-gray matters bipartite network in preclinical Alzheimer’s disease1Vanderbilt University Institute of Imaging Science, Nashville, TN, United States, 2Department of Electrical and Computer Engineering, Vanderbilt University, Nashville, TN, United States, 3Department of Radiology and Radiological Sciences, Vanderbilt University Medical Center, Nashville, TN, United States, 4Department of Psychiatry and Behavioral Sciences, Vanderbilt University Medical Center, Nashville, TN, United States, 5Department of Computer Science, Vanderbilt University, Nashville, TN, United States, 6Department of Biomedical Engineering, Vanderbilt University, Nashville, TN, United States
Synopsis
Keywords: Functional Connectivity, Alzheimer's Disease, Preclinical AD
Motivation: The significance of changes in functional connectivity (FC) measures involving white matter (WM) at preclinical stages of Alzheimer’s disease (AD) remains unclear.
Goal(s): Our goal was to reveal alterations in correlations in BOLD signals between WM and gray matter (GM) in the AD continuum, focusing on preclinical AD.
Approach: We used a novel bipartite graph model to evaluate network properties at multi-scales and compared preclinical AD, AD subjects with controls.
Results: We found declines in local specific WM-GM FC and WM FC density, without a manifest decline in global efficiency of WM-involved functional networks in the preclinical AD group.
Impact: Our observation of a decline in local WM-GM FC and WM FC density but an intact global efficiency of functional networks in preclinical AD may help explain why cognition remains normal despite the presence of pathology during the preclinical stage.
Introduction
Alzheimer’s Disease (AD) is an progressive brain disorder that is the leading cause of dementia 1. There is a lack of correspondence between neuropathology and clinical symptoms in the AD continuum 2, especially at the preclinical AD stage which is characterized by positive β-amyloid (Aβ) deposits but lack of cognitive symptoms as defined by the 2018 NIA-AA framework 2. Studies have revealed that during the preclinical AD stage, Aβ accumulates for several years prior to the onset of observable clinical symptoms 3. Changes or preservation of brain functional networks may explain the conflict between positive pathology and negative cognitive symptoms during this preclinical stage.Functional MRI (fMRI) is a non-invasive modality for detecting brain activity and has been used to unveil related changes of functional networks in AD 4. However, most previous fMRI studies focused on gray matter (GM), ignoring white matter (WM) which has recently been shown to decline in stages with clinical cognitive impairments 5,6. We sought to investigate the WM-involved BOLD correlations within networks in the AD continuum, with a focus on preclinical AD. Specifically, we employed a bipartite graph model to capture the distinctive topology of a WM-GM resting-state functional connectivity (rsFC) network and evaluate the network properties at multiple scales 7. Finally, we explored alterations of WM-involved functional networks in individuals in a preclinical AD stage and with clinical AD, respectively, relative to controls.
Methods
Data and participantsDatasets were sourced from the ADNI-2&3. The participants were grouped as cognitive normal (CN), preclinical AD and AD (Table 1). Preclinical AD subjects were selected from CN and subjective memory concerns (SMC) groups based on at least one of the requirements: 1. CSF Aβ < 459 pg/mL 8; 2. SUVR AV-45 > 1.22 9; 3. PIB SUVR > 1.42 10; 4. FBB SUVR > 1.478 11. The remaining CN participants were reclassified into the new CN group.
Preprocessing and evaluation of WM-GM rsFC
FMRI data were preprocessed using an automatic high-performance pipeline 12. A WM-GM rsFC matrix was generated for each subject by calculating Pearson’s correlation coefficients between regional time courses of fMRI signals from predefined 46 WM bundles 13 and 200 GM parcels 14. Each matrix can be viewed as the biadjacency matrix of a bipartite network.
Assessments of FC density (FCD) and network global efficiency
FCD of WM bundles for each subject was evaluated by calculating node strength of each WM bundle. To address the challenge that the graph lacks closed triangular pathways, which are necessary for assessment of global efficiency, we projected each bipartite network into a unipartite network with only GM nodes and transformed WM-GM FC as links, namely a ‘WM-mediated GM-GM rsFC network’ (Figure 1A). We evaluated the global efficiency for the whole-brain network and 17 Yeo’s networks, respectively.
Statistical Analysis
We analyzed between-group differences in rsFC for each WM-GM pair and FCD for each WM bundle with two-sample t-tests. Subsequently, we characterized group-mean global efficiency of each network with the influence of age, sex, years of education and acquisition-site controlled via multiple linear regression.
Results
We found that rsFC of several WM-GM pairs declines in preclinical AD relative to CN (uncorrected p<0.01, Figure 2 top) and by contrast a greater number of pairs decline in AD relative to CN (uncorrected p<0.01, Figure 2 bottom). Figure 3 represents the between-group differences in FCD for 46 deep brain WM bundles. In preclinical AD, we observed no significant declines compared to CN, but five bundles approached significance (p<0.1, denoted by diamond symbols). One of these is the cingulum, well-known for its association with memory and cognition. In contrast, AD patients showed 20 bundles with decreased FCD compared to CN (p<0.05), affecting bundles related to memory (e.g., CGG, CGH, FXC), cognition (e.g., ACR, GCC), language (e.g., UF), and sensorimotor functions (e.g., CST). Figure 4 demonstrates the alterations in global efficiency of WM-GM rsFC networks for both the whole-brain network and 17 Yeo’s networks. At the preclinical AD stage, we found only insignificant alterations. When arriving at the AD stage, significant declines became evident in the whole-brain network and nine functional networks including attention, somatomotor, auditory and visual networks, as indicated by solid lines.Discussion
We observed declines in local specific WM-GM FC during the preclinical AD stage when no cognitive symptoms are evident but significant amyloid deposition is apparent. Interestingly, despite this localized decline, the overall efficiency of information transfer within the entire brain and across the 17 functional networks remains intact, which may help elucidate why cognitive function remains normal during this stage.Acknowledgements
This work was supported by NIH grant RF1MH123201 (Gore and Landman), R01NS113832 (Gore), Vanderbilt Discovery Grant FF600670 (Gao), R01NS129855 (Ding), K01EB032898 (Schilling), T32EB001628 (Gore) and grant of Vanderbilt Institute for Clinical and Translational Research UL1TR0002243.
References
1 Scheltens, P. et al. Alzheimer's disease. The Lancet 397, 1577-1590 (2021).
2 Jack Jr, C. R. et al. NIA-AA research framework: toward a biological definition of Alzheimer's disease. Alzheimer's & Dementia 14, 535-562 (2018).
3 Sheline, Y. I. & Raichle, M. E. Resting state functional connectivity in preclinical Alzheimer’s disease. Biological psychiatry 74, 340-347 (2013).
4 Yu, M., Sporns, O. & Saykin, A. J. The human connectome in Alzheimer disease—relationship to biomarkers and genetics. Nature Reviews Neurology 17, 545-563 (2021).
5 Gao, Y. et al. Functional connectivity of white matter as a biomarker of cognitive decline in Alzheimer’s disease. Plos one 15, e0240513 (2020).
6 Gore, J. C. et al. Functional MRI and resting state connectivity in white matter-a mini-review. Magnetic resonance imaging 63, 1-11 (2019).
7 Gao, Y. et al. Functional alterations in bipartite network of white and grey matters during aging. NeuroImage 278, 120277 (2023).
8 Vos, S. J. et al. Preclinical Alzheimer's disease and its outcome: a longitudinal cohort study. The Lancet Neurology 12, 957-965 (2013).
9 Mishra, S. et al. AV-1451 PET imaging of tau pathology in preclinical Alzheimer disease: defining a summary measure. Neuroimage 161, 171-178 (2017).
10 Vlassenko, A. G. et al. Imaging and cerebrospinal fluid biomarkers in early preclinical Alzheimer disease. Annals of neurology 80, 379-387 (2016).
11 Sabri, O. et al. Florbetaben PET imaging to detect amyloid beta plaques in Alzheimer's disease: phase 3 study. Alzheimer's & dementia 11, 964-974 (2015).
12 Gao, Y. et al. in Medical Imaging 2023: Image Processing. 155-161 (SPIE).
13 Mori, S. et al. Stereotaxic white matter atlas based on diffusion tensor imaging in an ICBM template. Neuroimage 40, 570-582 (2008).
14 Schaefer, A. et al. Local-global parcellation of the human cerebral cortex from intrinsic functional connectivity MRI. Cerebral cortex 28, 3095-3114 (2018).
Figures
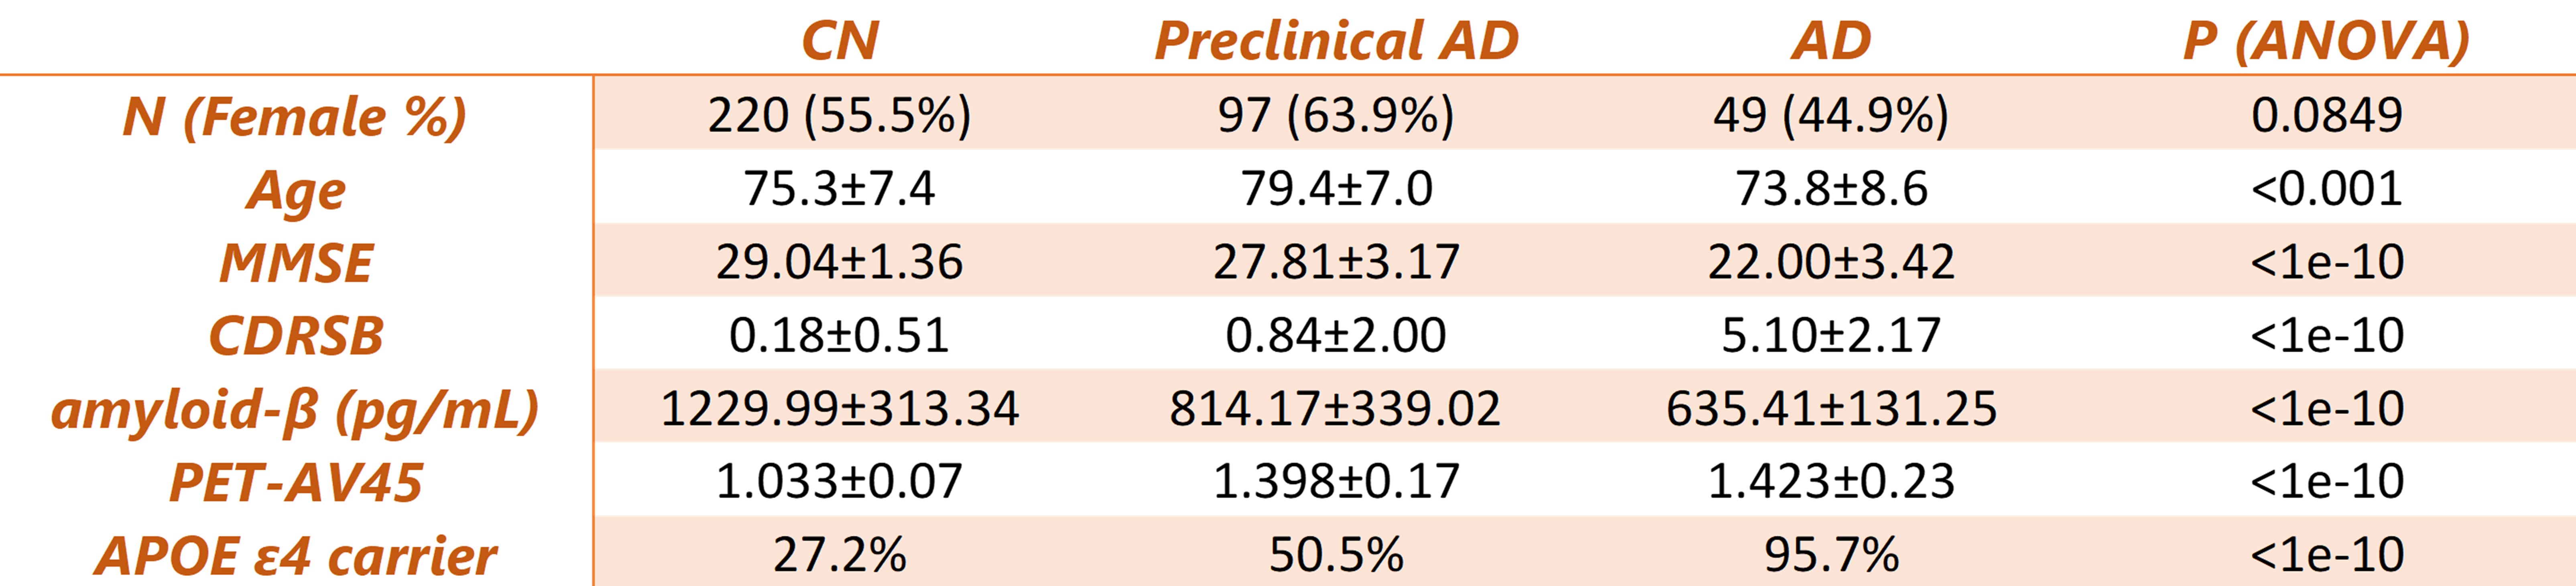
Table 1. Characteristics of the Study Cohort.
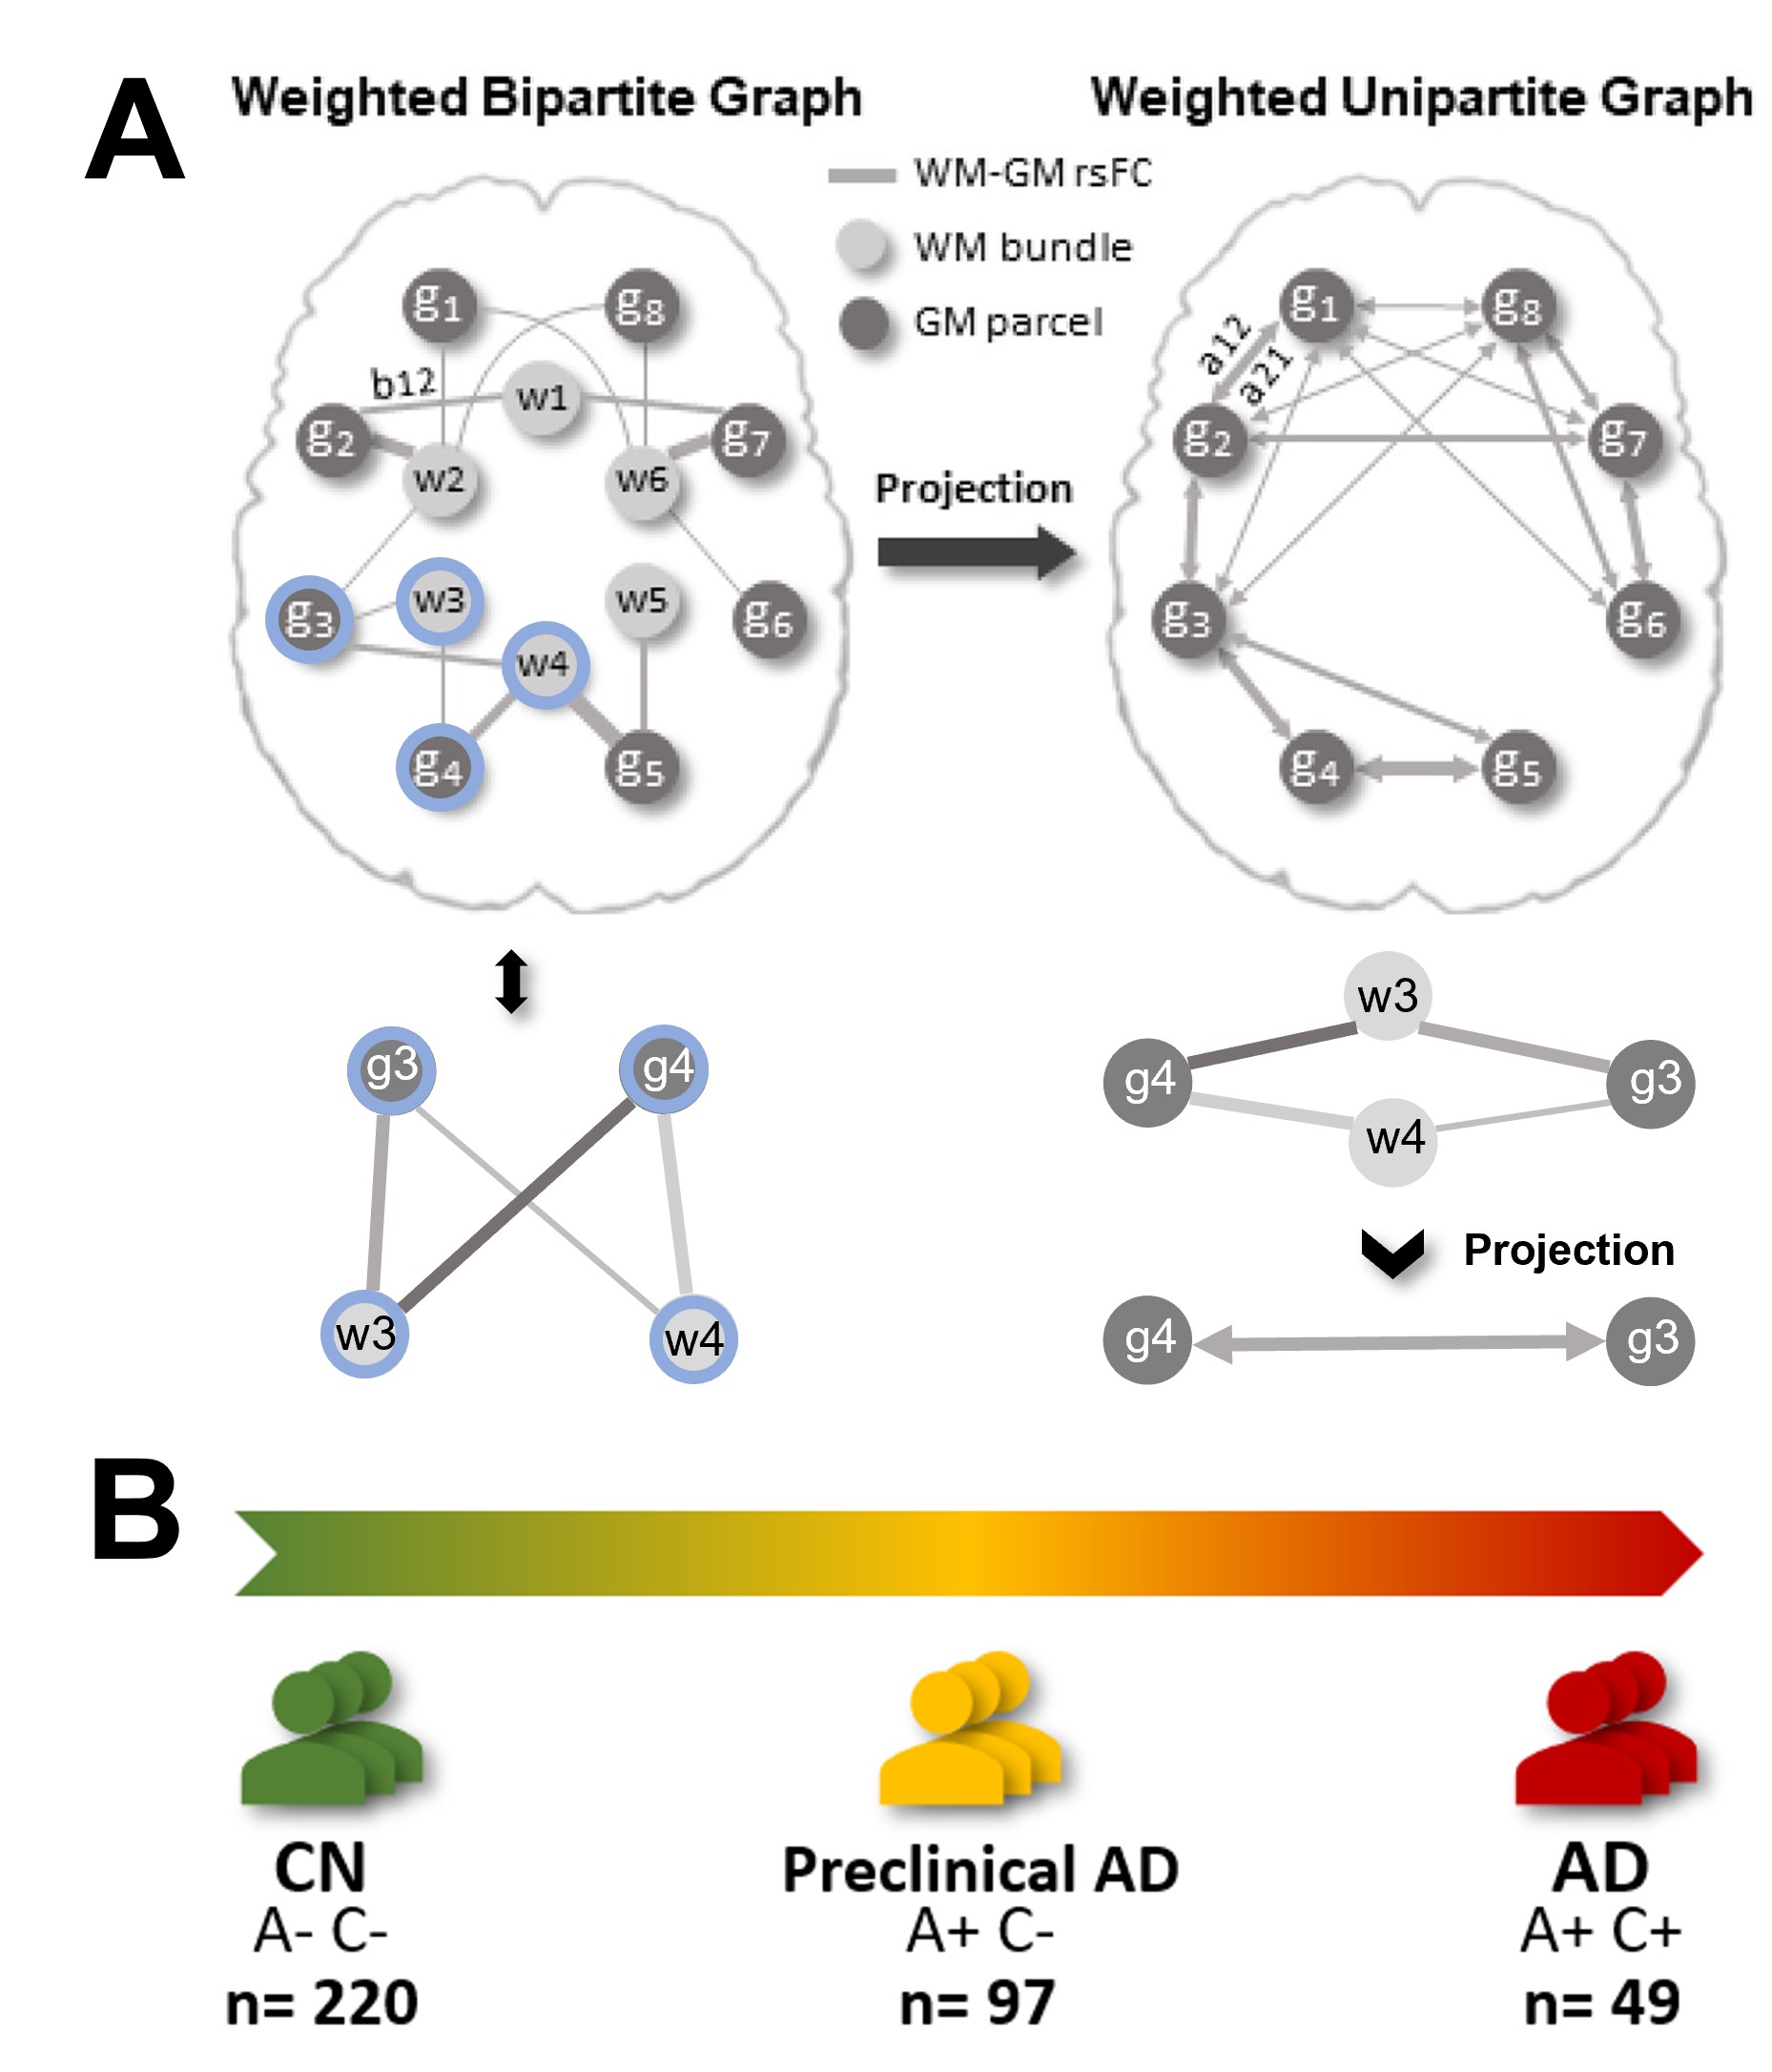
Figure 1. Schematic diagram of the project design. (A) Projection from a WM-GM rsFC weighted bipartite graph to a WM-mediated GM-GM weighted graph. (B) Subjects recruited in the study, including CN (negative Aβ-related biomarker (A-) and negative cognitive decline (C-)), preclinical AD (positive A (A+) and C-) and AD (A+ and C+).
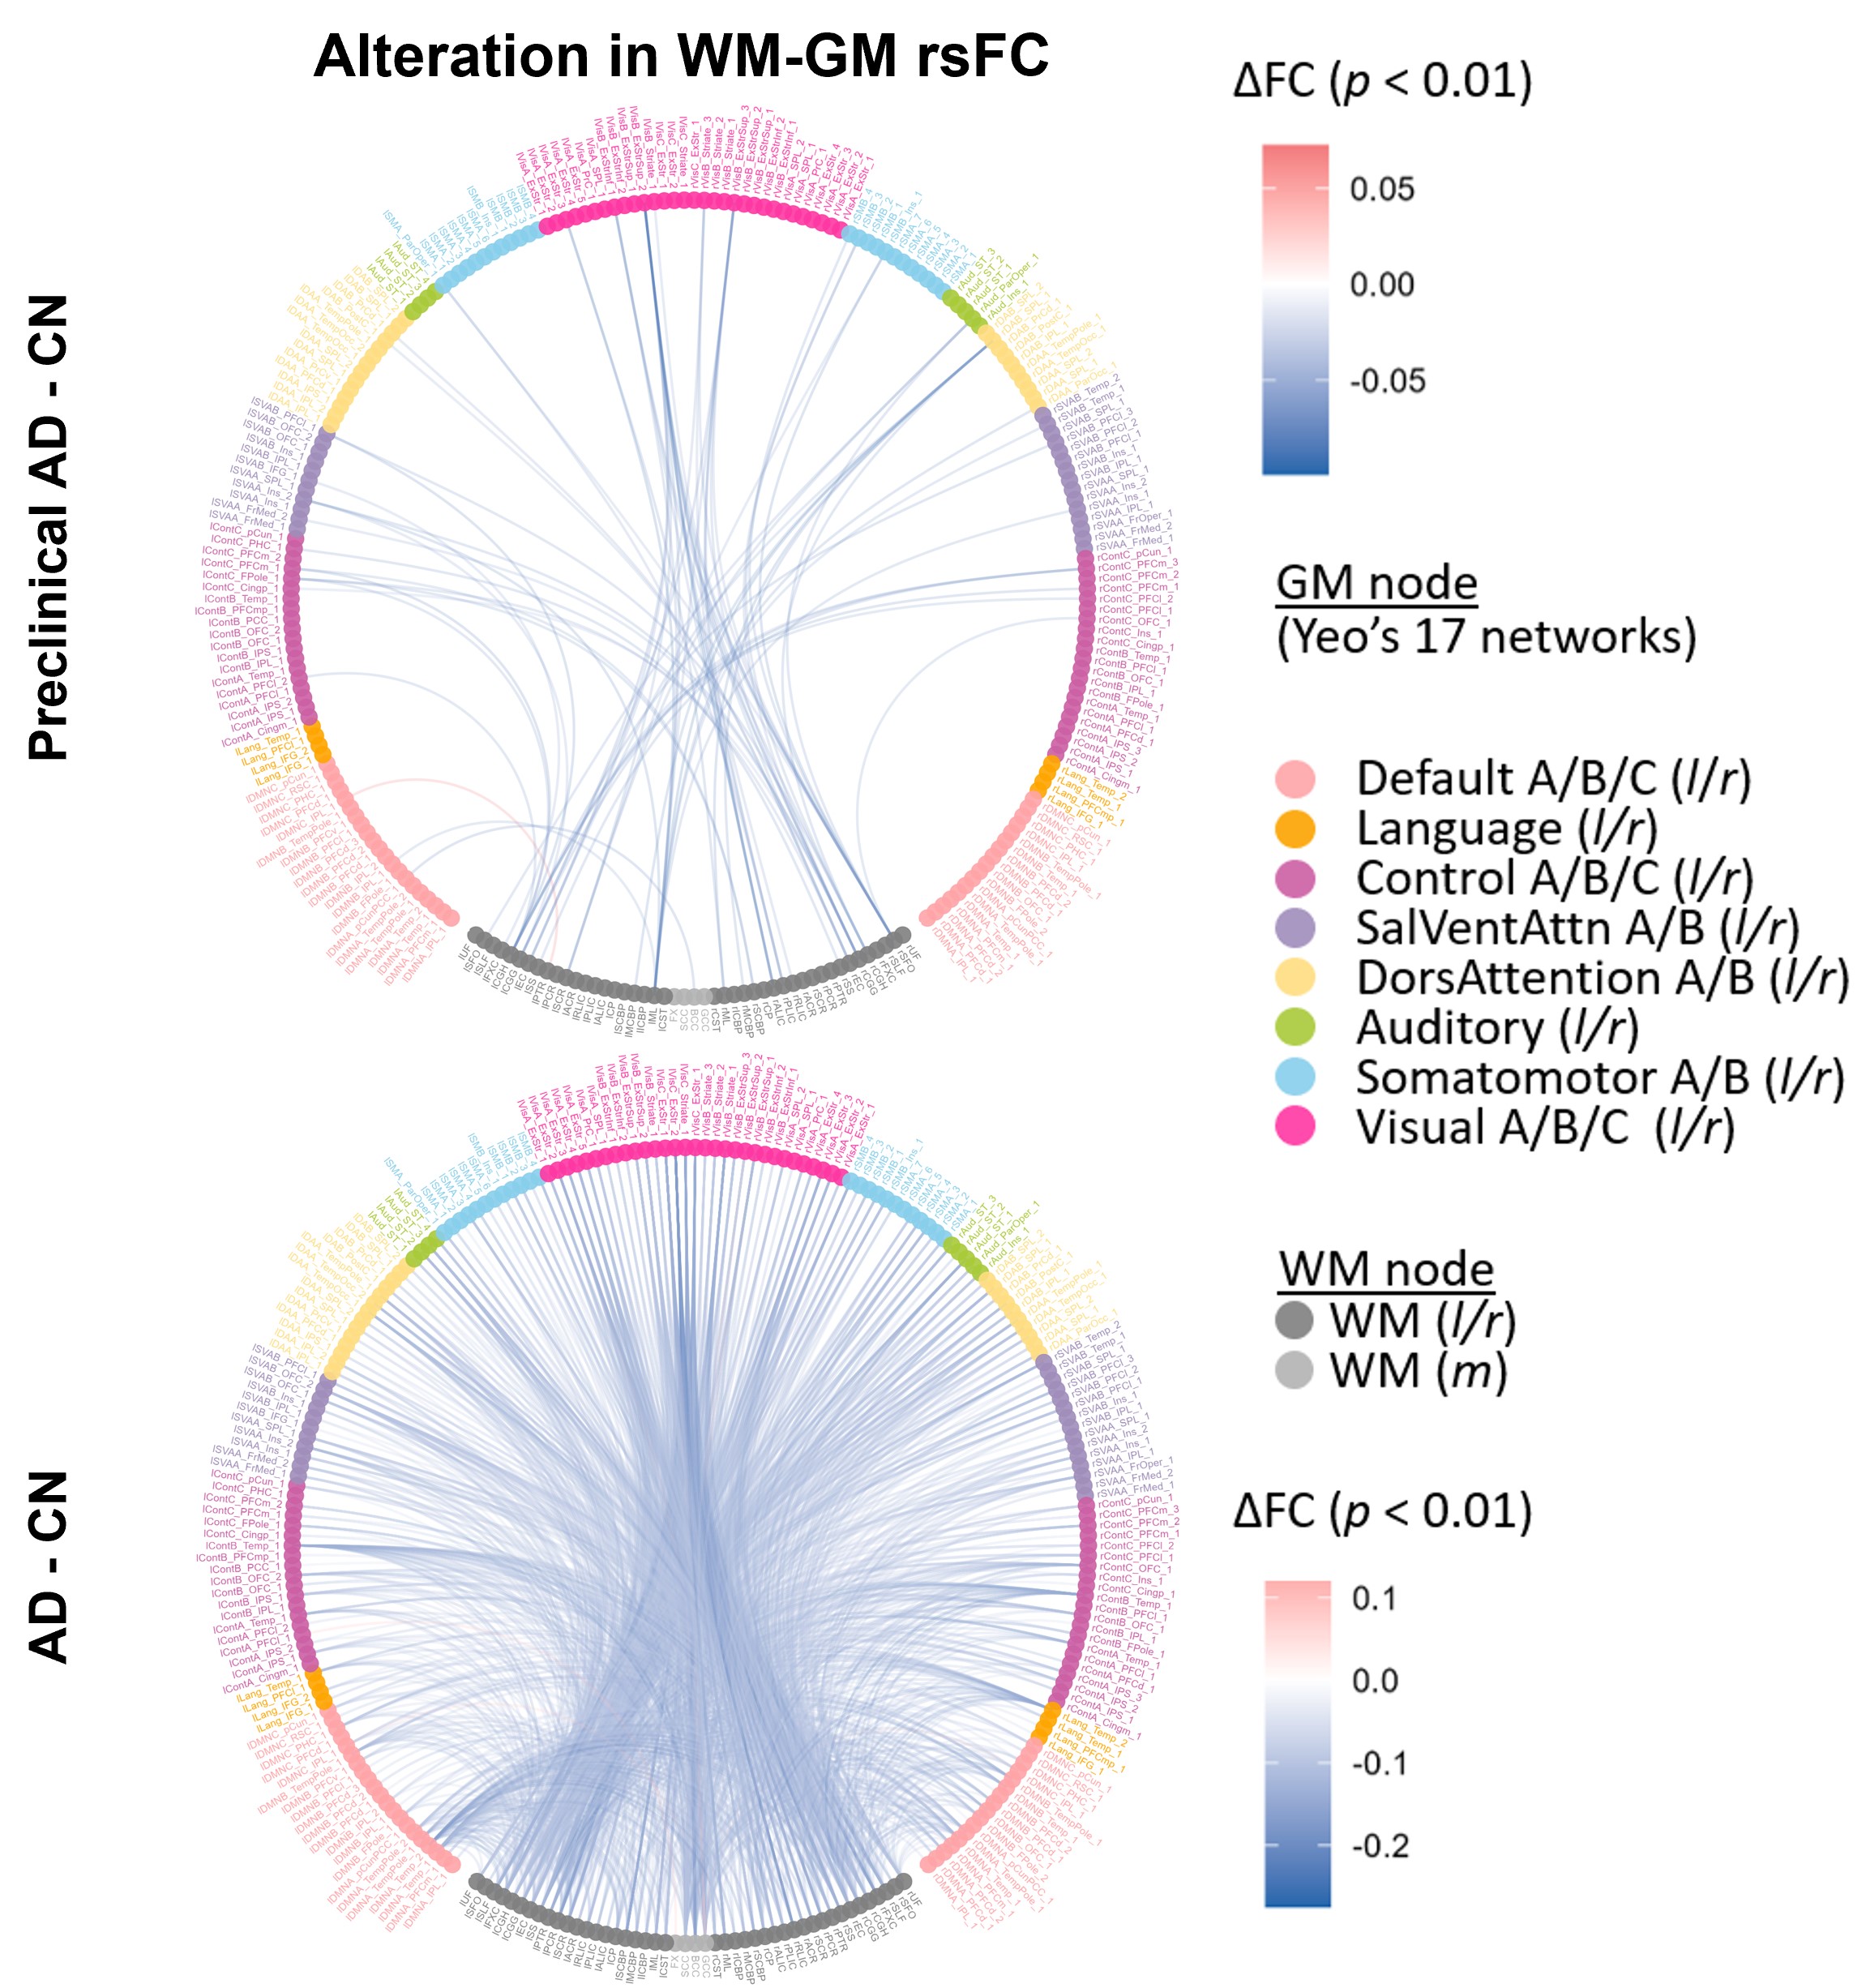
Figure 2. Significant differences in rsFC between subjects with preclinical AD and CN subjects and between patients with AD and CN subjects (p<0.01, uncorrected). Each colored node represents a GM parcel assigned to a specific functional network and each gray node represents a WM bundle. Curves connecting between pairs of parcels indicate mean FC difference between groups where blue color indicates lower FC in preclinical AD or AD compared to the control group and red is the reverse.
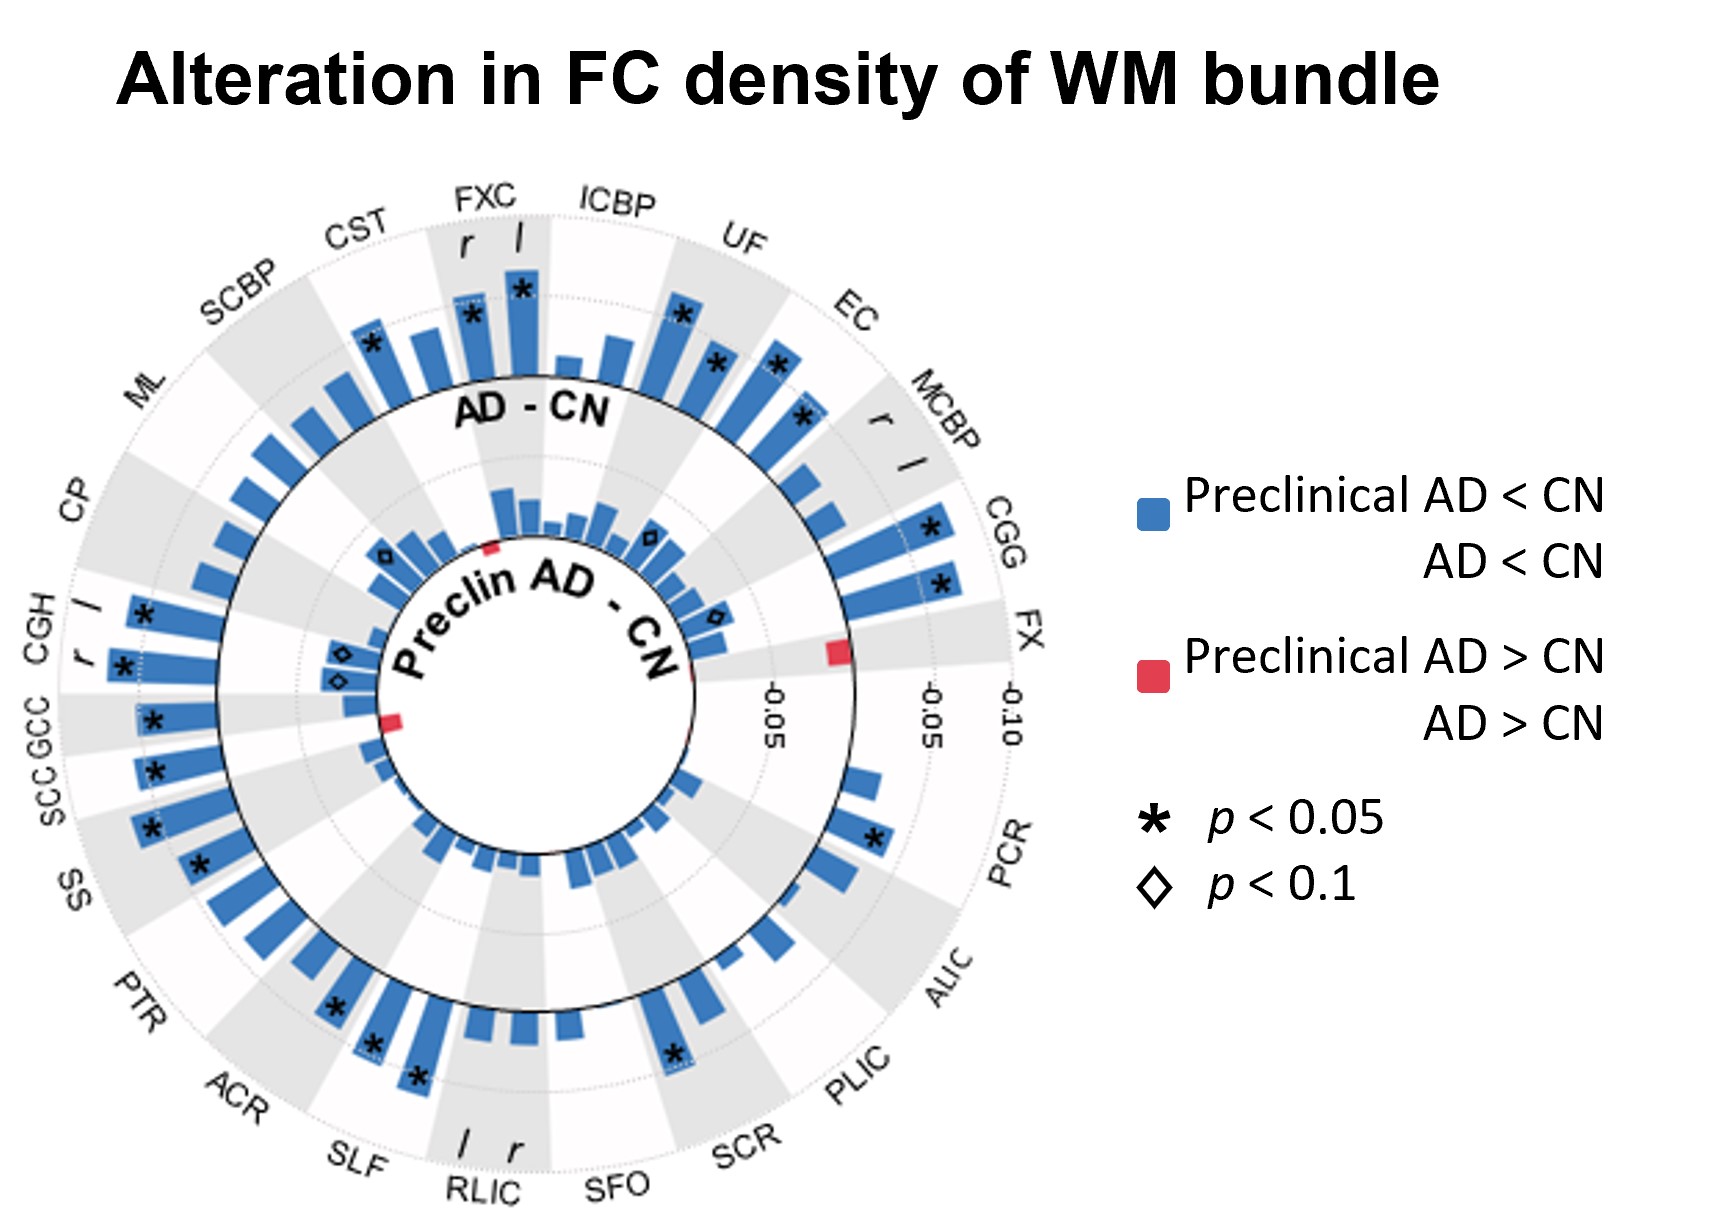
Figure 3. Differences in mean FCD between subjects with preclinical AD and CN subjects (inner circle) and between patients with AD and CN subjects (outer circle). Blue and red bars indicate negative and positive FCD differences, respectively. An asterisk on the bar indicates p < 0.05, and a diamond on the bar represents p < 0.1 (both uncorrected).
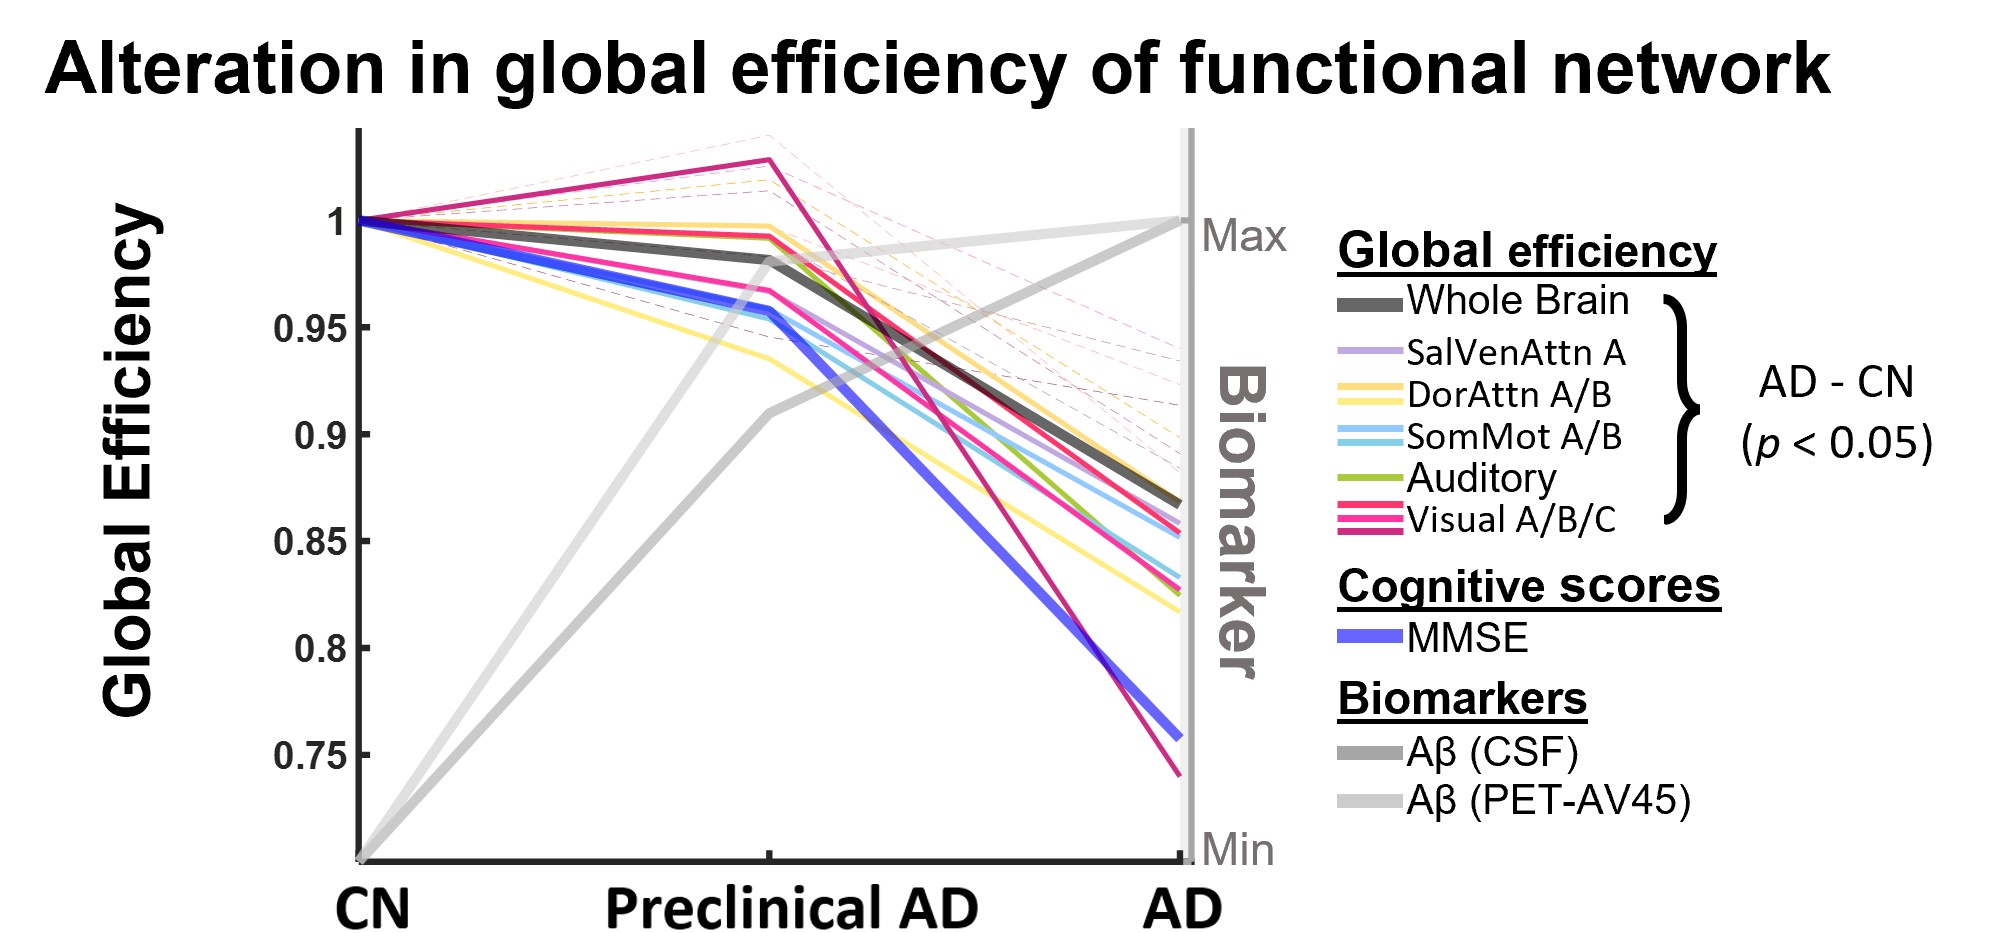
Figure 4. Alterations in global efficiency of functional network. Variations of global efficiencies of projected networks of bipartite WM-GM FC connection were shown for the whole brain network and 17 sub-networks (plots corresponding to significant differences (p<0.05) between patients with AD and CN subjects were marked in bold). Cognitive score, the MMSE (labeled as blue), and biomarkers, the CSF Aβ and the AV45 SUVR values (marked as gray) were also plotted in the figure.