4409
Frequency-dependent alterations in functional connectivity associated with the progression from aMCI to AD1The Fourth Clinical College, Zhejiang Chinese Medical University, HangZhou, China, 2Hangzhou First People's Hospital, HangZhou, China, 3MR Research, GE Healthcare, Beijing, China, 4School of Medical Imaging, Hangzhou Medical College, HangZhou, China, 5Department of Psychiatry, Zhejiang Provincial People’s Hospital of Hangzhou Medical College, HangZhou, China
Synopsis
Keywords: Functional Connectivity, fMRI (resting state)
Motivation: In Alzheimer’s Disease (AD) spectrum disorders, rs-fMRI signals in the cerebral cortex may possess distinct characteristics across different frequency ranges.
Goal(s): To investigate potential alterations in functional connectivity among patients with amnestic mild cognitive impairment (aMCI) and AD and to determine whether these changes vary across different frequency bands.
Approach: The changes in functional connectivity were analyzed using the VMHC and DC metrics in patients with aMCI and AD across three frequency bands:classic, slow-5, and slow-4.
Results: Notable changes in functional connectivity were observed across multiple brain regions in patients with aMCI and AD, with the most pronounced in slow-5 frequency band.
Impact: This study further advances our comprehension of the pathological and physiological mechanisms associated with AD. Furthermore, it highlights the significance of researchers taking into account various frequency bands in their investigations of brain function.
Introduction
Amnestic Mild Cognitive Impairment (aMCI) is considered a precursor stage of Alzheimer's disease (AD)1. Resting-state functional magnetic resonance imaging (rs-fMRI) methods, such as amplitude of low-frequency fluctuations(ALFF), voxel-mirrored homotopic connectivity (VMHC), and degree centrality(DC) have been widely used to investigate functional changes in patients with AD and aMCI2. However, most brain functional studies within the AD spectrum primarily focus on the classical frequency bands (0.01-0.08Hz). It has been suggested that the rs-fMRI signals in different frequency ranges of the cerebral cortex process distinct characteristics and sensitivities to specific brain activity patterns. In light of this, our team previously investigated the discriminatory ability of the ALFF index in different frequency bands for aMCI patients, and found that the slow-5 frequency band (0.01-0.027 Hz) may be helpful in exploring the pathogenesis of AD and differentiating its stages3. However, this study did not further investigate whether functional connectivity indexes across the whole-brain of AD spectrum patients similarly depend on frequency. In this study, we aim to apply VMHC and DC to assess changes in functional connectivity in aMCI patients and investigate potential associations between these changes and clinical symptoms. Moreover, our study seeks to determine if VMHC and DC exhibit frequency-dependent involvement in functional connectivity changes among AD patients.Methods
Patients: From September 2016 to February 2018, 61 AD and 52 aMCI patients were recruited at the Zhejiang People's Hospital. A total of 50 normal controls (NC) were recruited at the hospital health promotion center. All participants were righthanded and provided written informed consent prior to the experiment. AD patients were diagnosed according to the criteria of the DSM-IV-R and the revised NINCDS-ADRDA with MMSE score ≤ 24.Imaging: The MRI data were acquired on a 3.0T scanner (Discovery MR750; GE Healthcare, Waukesha, WI, USA). The rs-fMRI images were obtained with the following parameters: TR = 2,000ms, TE = 30ms, slice thickness = 3.2mm, gap =0mm, FOV = 220×220mm2, flip angle = 90◦, in-plane resolution = 64 × 64, 210 volumes and 44 slices.
Data processing: Preprocessing of brain imaging data involved the removal of head motion artifacts, motion correction, temporal normalization, and spatial smoothing. The brain imaging data was then partitioned into multiple regions, and the average time series was calculated for each region.Subsequently, we computed the correlation between each pair of brain regions using a correlation coefficient, such as Pearson correlation. Symmetrization was applied to obtain the VMHC metric. The correlation coefficients of each voxel with r > 0.32 (P < 0.05, Bonferroni correction) were summed to obtain the weighted DC for each voxel.
Results
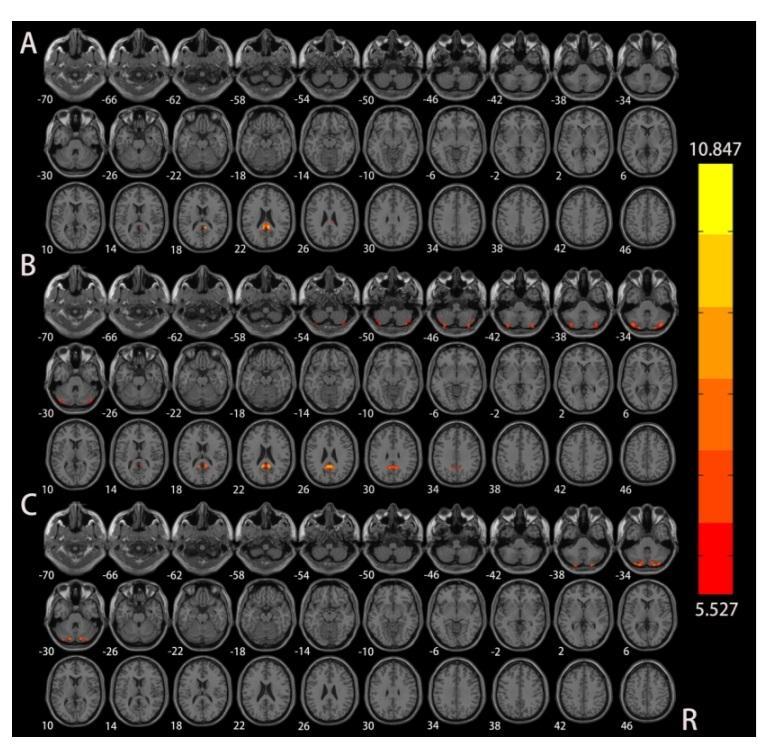
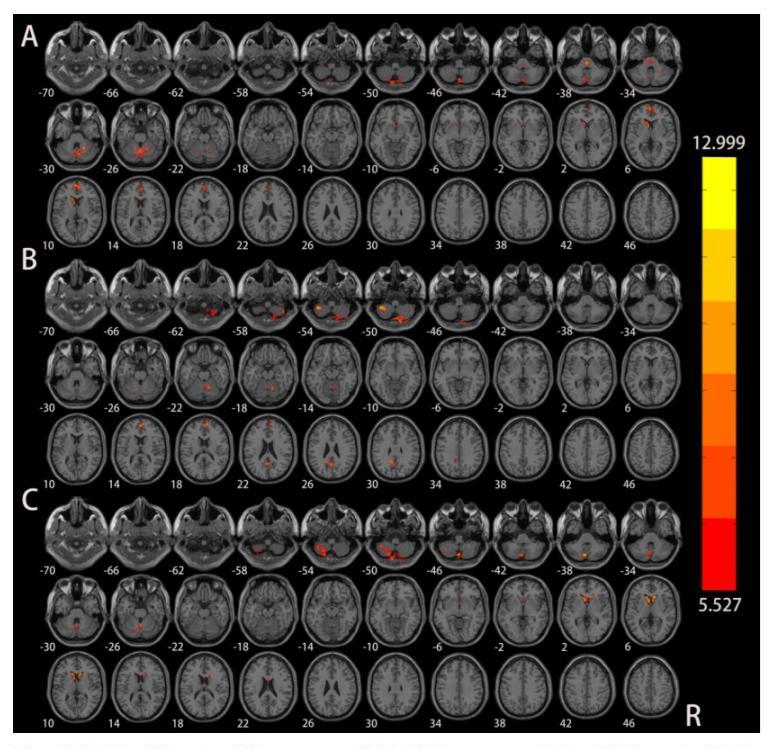
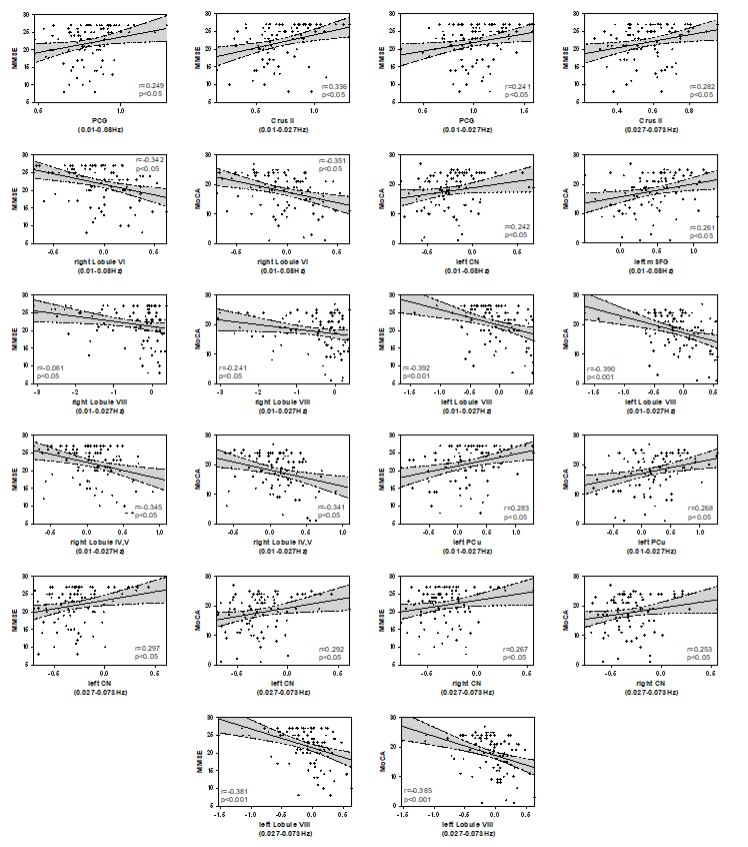
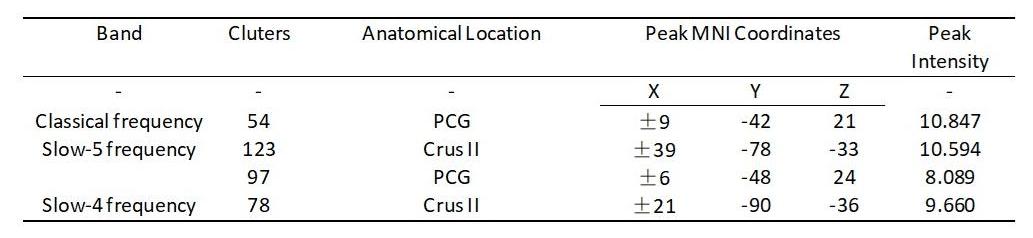
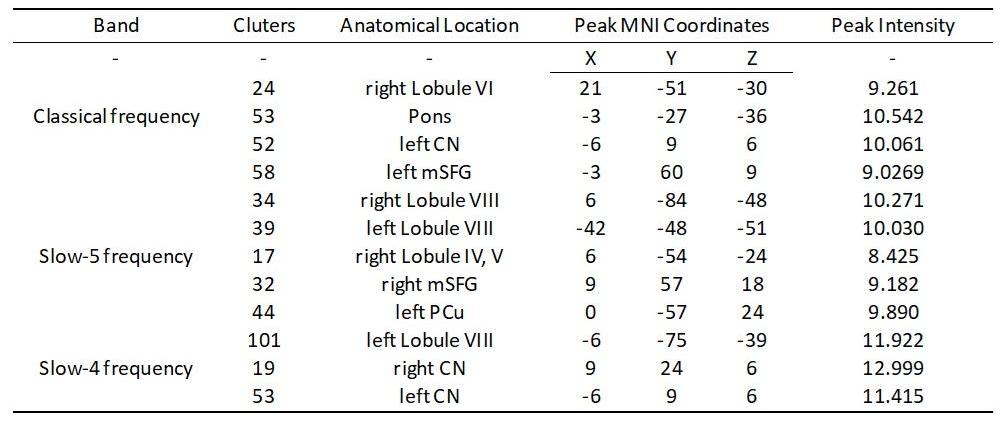
ANOVA test showed that among the three frequency brand groups, significant variability in VMHC and DC was observed in multiple brain regions, including the posterior cingulate gyrus(PCG), Crus II of the cerebellar hemisphere(Crus II), bilateral caudate nucleus (CN), bilateral medial superior frontal gyrus (mSFG), bilateral Lobule VIII of the cerebellar hemisphere(Lobule VIII), left precuneus(PCu), right Lobule VI of the cerebellar hemisphere(Lobule VI) and right Lobule IV, V of the cerebellar hemisphere(Lobule IV, V). (Figure 1, Figure 2, Table 1 and Table 2).VMHC values in clusters of PCG and Crus II exhibited a positive correlation with MMSE(p < 0.05, Bonferroni corrected) (Figure 3).
DC values in the clusters of bilateral CN and left PCu were positively correlated with MMSE, while the DC values in the bilateral Lobule VIII, right Lobule VI and right Lobule IV, V showed a negative correlation with MMSE(p < 0.05, Bonferroni corrected) (Figure 3). Similarly, DC values in the clusters of bilateral CN, left mSFG and left PCu were positively correlated with MoCA, while the DC values in the bilateral Lobule VIII, right Lobule VI and right Lobule IV, V exhibited a negative correlation with MoCA(p < 0.05, Bonferroni corrected) (Figure 3).
Notably, across the three frequency bands, the slow-5 frequency band displayed the highest number of brain regions with significant differences in various parameters (Figure 1, Figure 2, Table 1 and Table 2).
Discussion and Conclusion
This study found that the simultaneous utilization of VMHC and DC metrics allows for a more comprehensive insight into the functional abnormalities in the underlying brain networks of patients with AD and aMCI. Furthermore, we found that brain regions displaying significant variations in various parameters were most pronounced within the slow-5 frequency band. Therefore, we posit that brain function exhibits a certain degree of frequency specificity, and the slow-5 frequency band holds the potential to provide deeper insights into the pathological and physiological mechanisms of AD.Acknowledgements
No acknowledgement found.References
1.Petersen, R.C., Smith, G.E., Waring, S.C., Ivnik, R.J., Tangalos, E.G., Kokmen, E., 1999.Mild cognitive impairment: clinical characterization and outcome. Arch. Neurol. 56,303–308.
2.Xi Q, Zhao X, Wang P, Guo Q, Jiang H, Cao X, He Y, Yan C. Spontaneous brain activity in mild cognitive impairment revealed by amplitude of low-frequency fluctuation analysis: a resting-state fMRI study. Radiol Med. 2012 Aug;117(5):865-71. doi: 10.1007/s11547-011-0780-8IF: 8.9 Q1 . Epub 2012 Jan 12. PMID: 22241376IF: 8.9 Q1 .
3.Wang L, Feng Q, Wang M, Zhu T, Yu E, Niu J, Ge X, Mao D, Lv Y, Ding Z. An Effective Brain Imaging Biomarker for AD and aMCI: ALFF in Slow-5 Frequency Band. Curr Alzheimer Res. 2021 Mar 24. doi: 10.2174/1567205018666210324130502IF: 2.1 Q4 . Epub ahead of print. PMID: 33761855IF: 2.1 Q4 .
Figures