4405
Evaluation of Renal Tubular Function by Multiparametric Functional MRI in Early Diabetes1Peking University First Hospital, Beijing, China
Synopsis
Motivation: Accumulating evidence indicates that renal tubular injury, as a prime mover, plays an important role in the pathogenesis of diabetic kidney disease.
Goal(s): We aimed to explore the tubular function in an alloxan-induced type 1 diabetic mellitus (DM) rabbit model using asymmetric spin echo (ASE), BOLD and ASL MRI with the furosemide diuretic test.
Approach: We performed pairs of multiparametric MRIs (before and after furosemide injection) at baseline and 3/7 days post-DM, and scored pathological kidney injury.
Results: We found that the pathological tubular injury scores in DM groups significantly correlated with medullary ΔR2* (post-furosemide – pre-furosemide difference) and oxygen extraction fraction (ΔOEF).
Impact: The medullary ∆R2* and ∆OEF were closely related with pathological tubular injury. Our study demonstrated that the renal tubular dysfunction in early diabetes could be detected by the combination of asymmetric spin echo (ASE), BOLD and ASL MRI.
Introduction
The renal tubular injury appears in the early stage of diabetic kidney disease, prompts its progression, and correlates closely with progressive renal function decline1-2. Furosemide acts mainly by inhibiting the Na+-K+-2Cl- apical membrane cotransporter of the tubular epithelium in the medullary thick ascending limb of the Henle's loop, which decreases oxygen consumption, reflecting tubular function3-5. Our study aimed to explore the tubular function using the combination of asymmetric spin echo (ASE) and blood oxygenation level-dependent (BOLD) with arterial spin labeling (ASL) MRI in an alloxan-induced type 1 diabetic mellitus (DM) rabbit model with the furosemide diuretic test.Methods
We included 26 male New Zealand White rabbits. Each rabbit underwent intravenous furosemide administration at baseline, 3/7 days post-alloxan (Figure 1). Pairs of multiparametric MRI scans were performed before and five minutes after the furosemide injection. We conducted MR examinations at 3.0-T (Signa Excite; GE Medical System) with an 8-channel phased array knee coil. The relevant imaging parameters are presented in Table 1. The ASE images were collected by a multi-echo of 32 images with shifted 180° pulses (shifted time: -16–15 ms; spacing time: 1 ms). The renal pathological findings were analyzed by two experienced renal pathologists. The pathological tubular injury scores were recorded using the total scores of tubular vacuolation (V0/V1, < 5% or ≥ 5%), interstitial inflammation (I0/I1, < 5% or ≥ 5%), and tubular atrophy/interstitial fibrosis (T0/T1, < 25% or ≥ 25% of the cortical area) based on the Oxford classification schema6. The renal blood flow (RBF), R2*, and oxygen extraction fraction (OEF) values were compared between intra-groups and between inter-groups using independent and paired sample t-tests, respectively. The pathological tubular injury scores were correlated with medullary ΔR2* (post-furosemide – pre-furosemide difference) and ΔOEF, respectively.Results
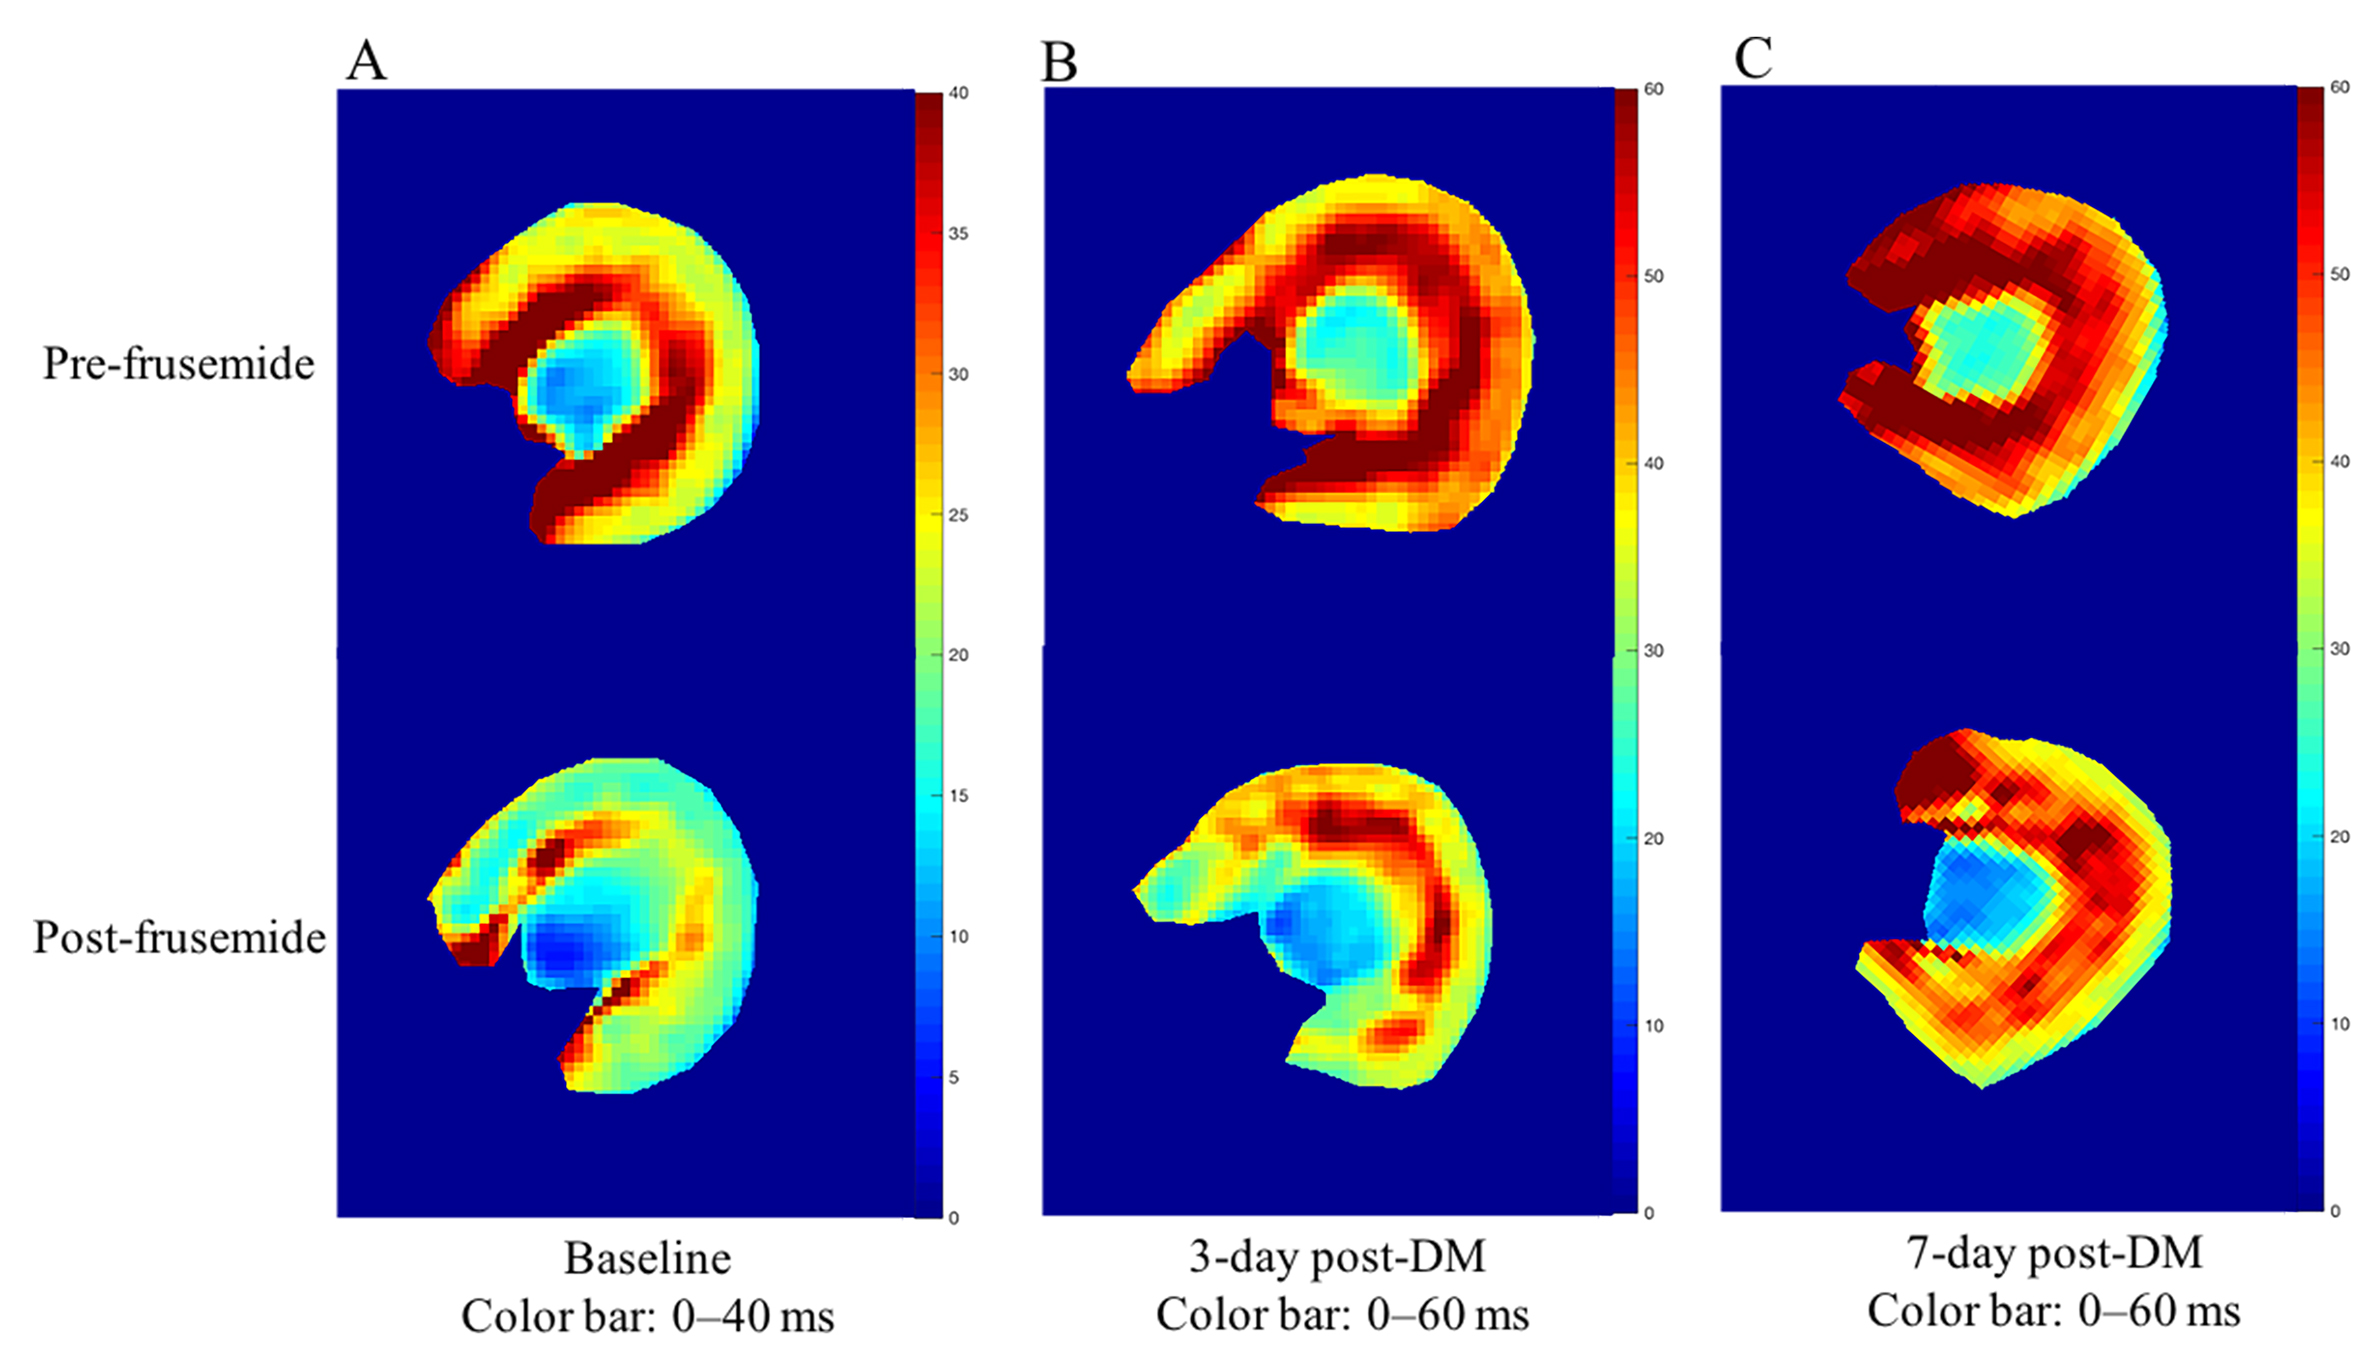
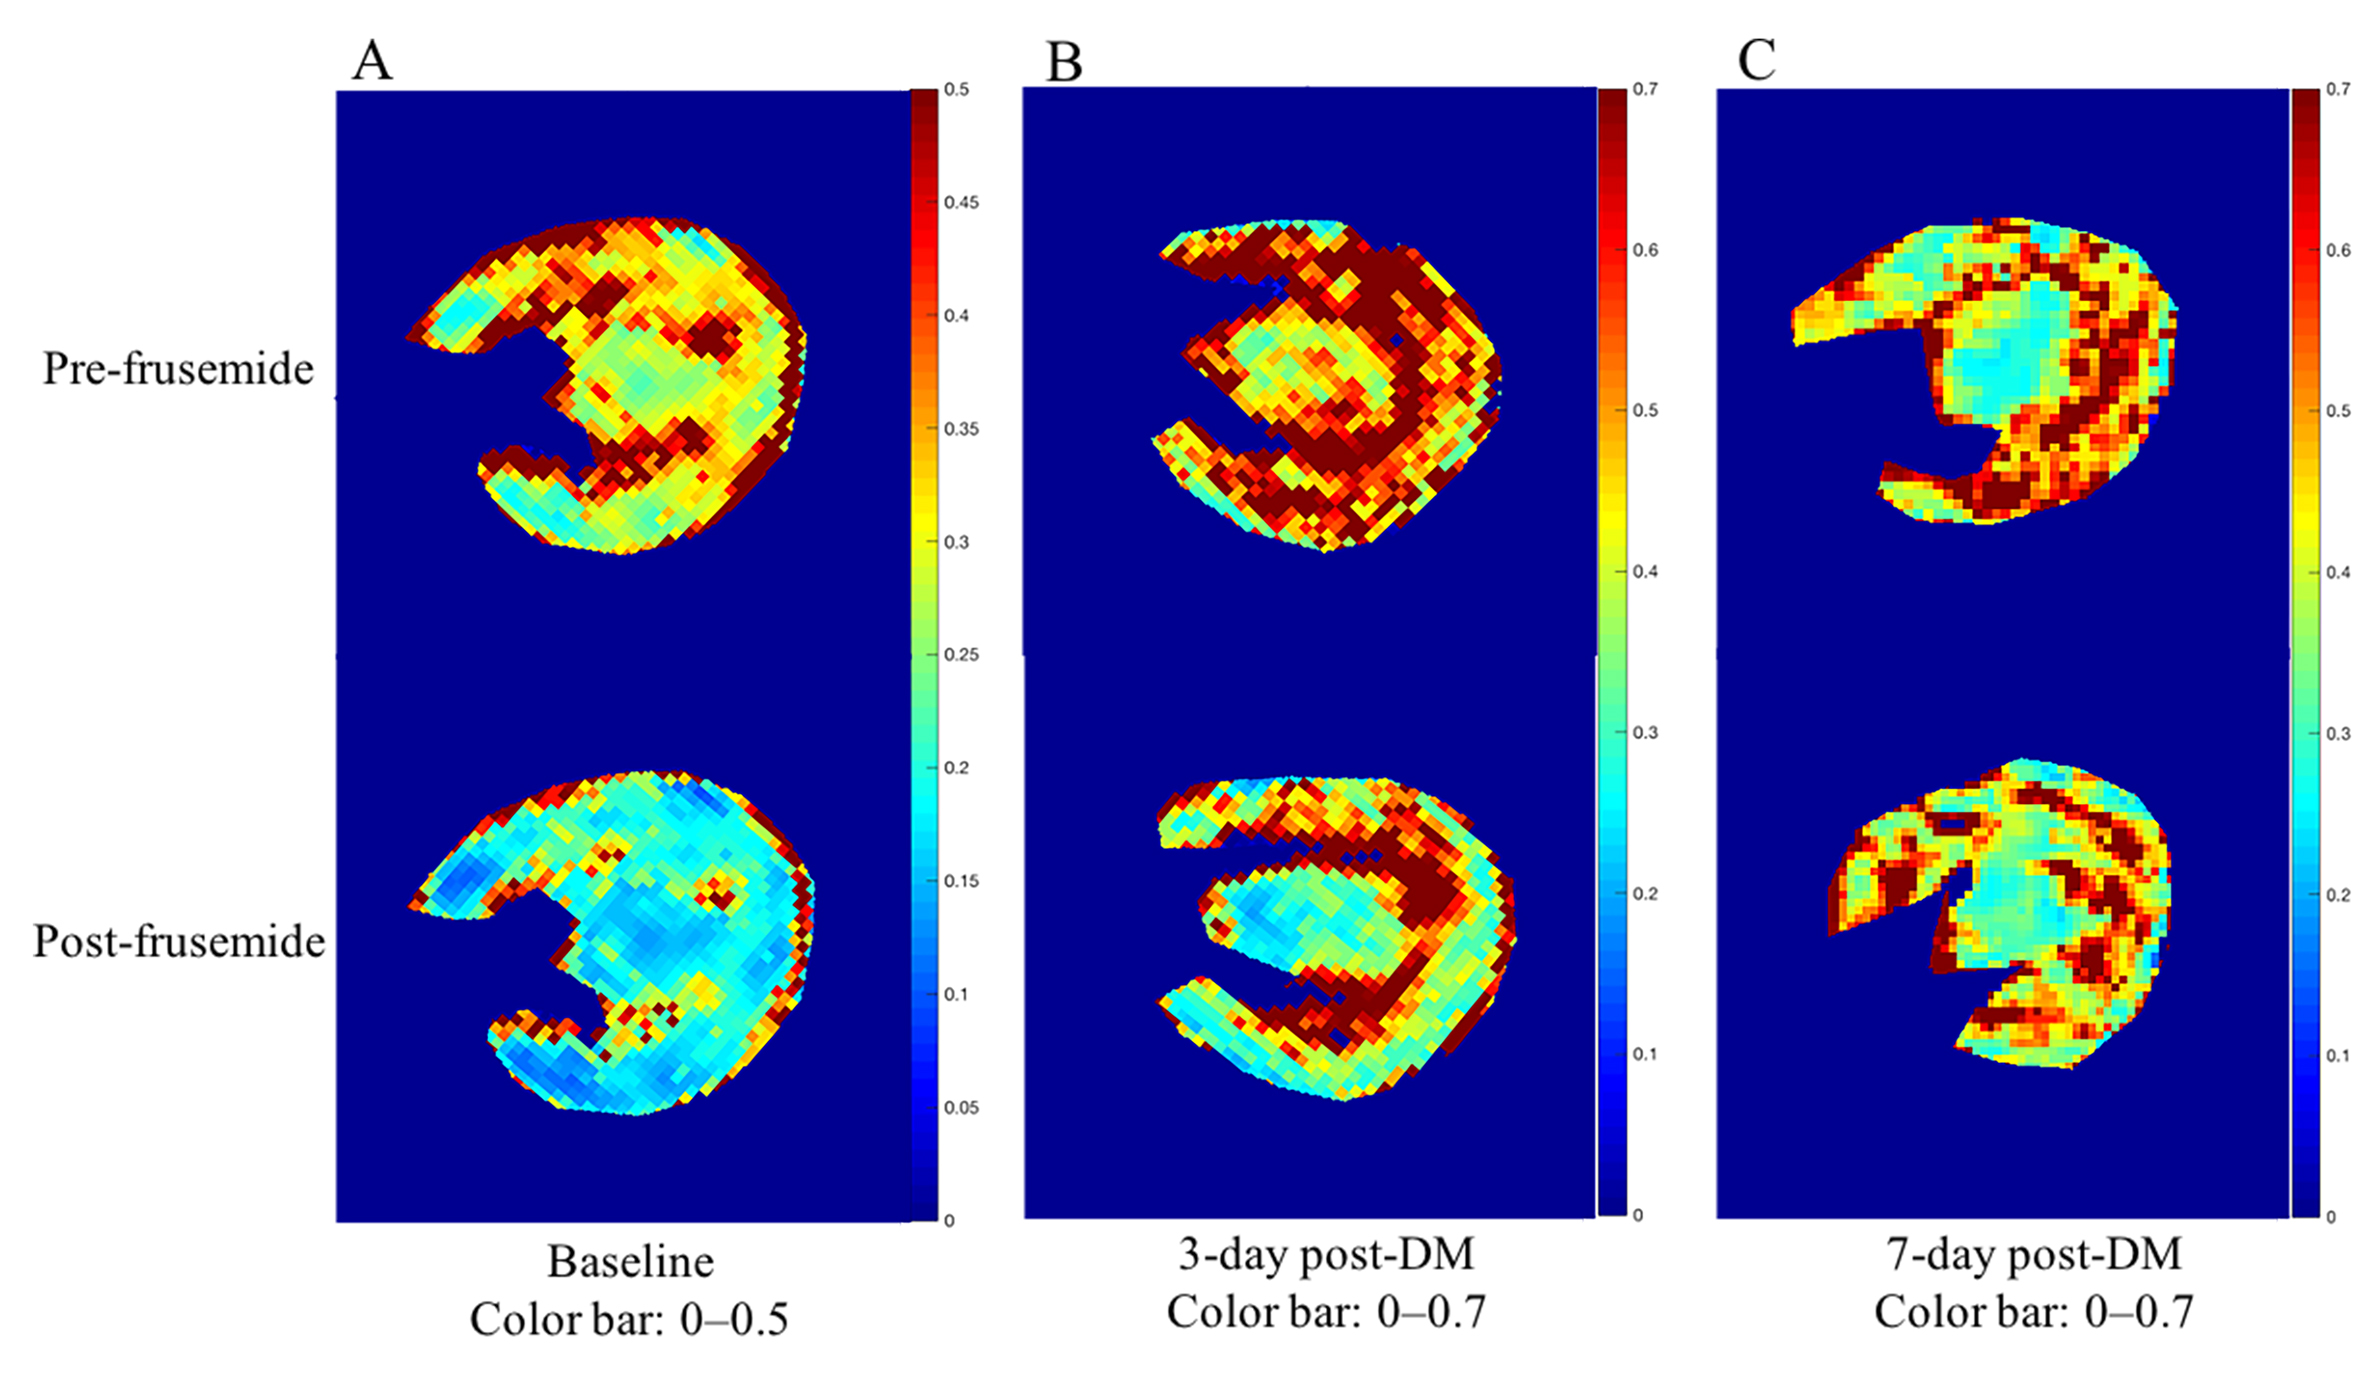
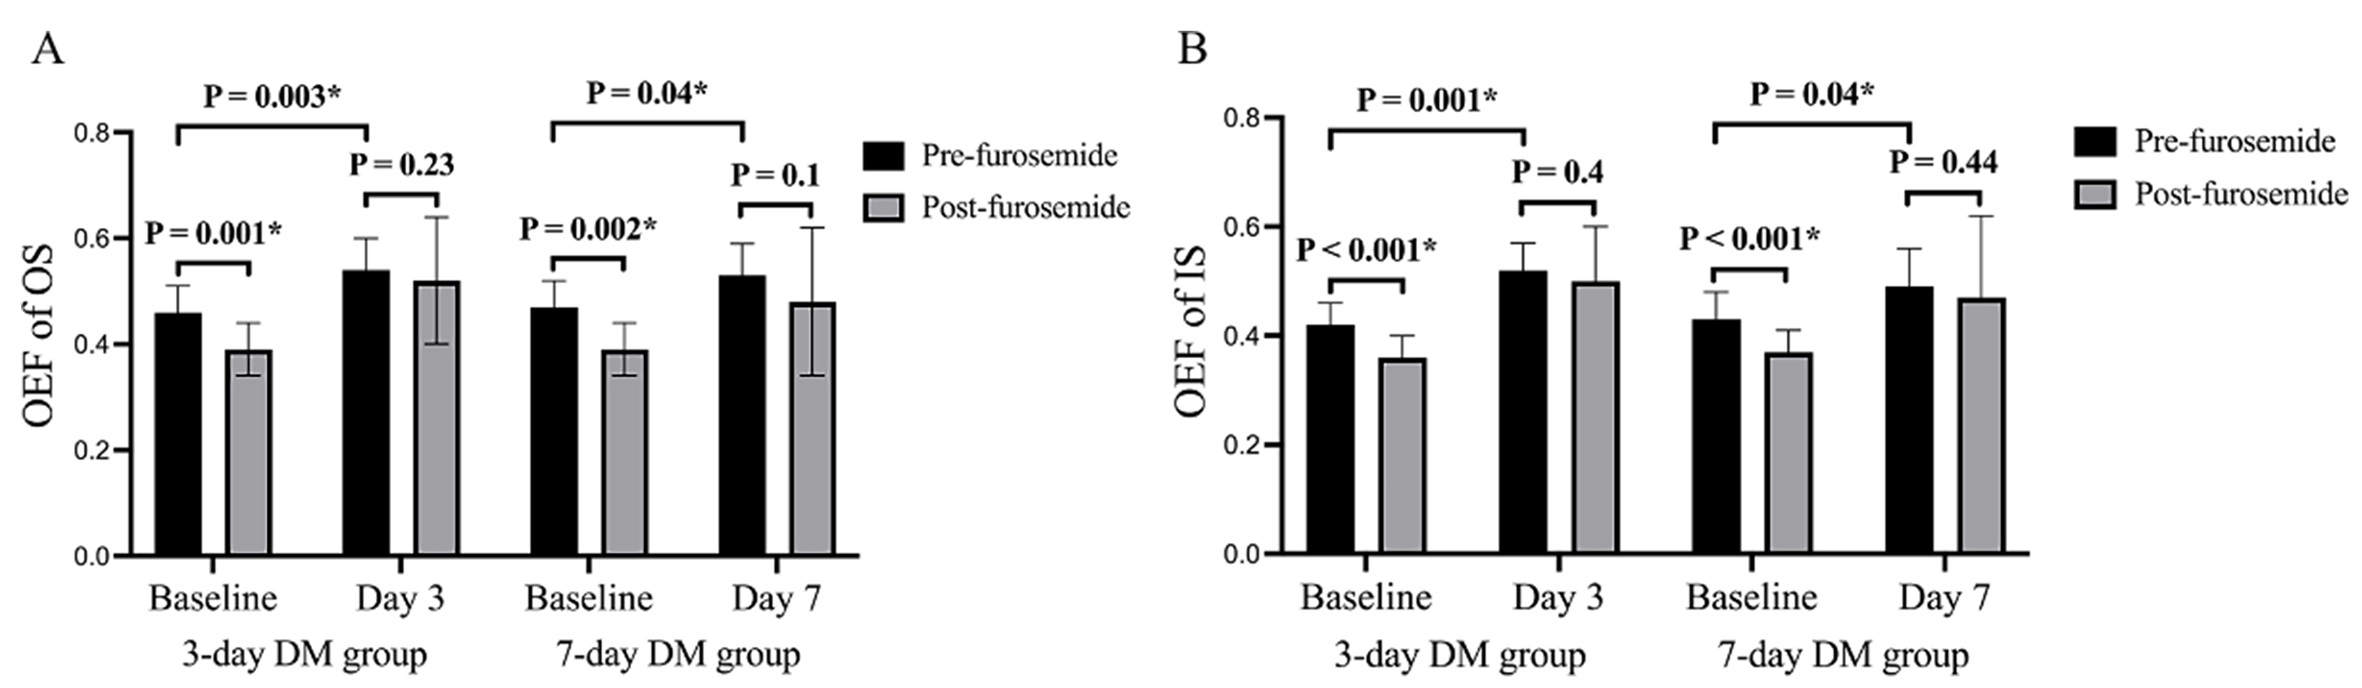
At baseline, medullary R2* significantly decreased by 22.84% and 17.41% in the outer and inner stripes of the outer medulla (OS and IS, p = 0.001 and 0.002, respectively) after furosemide administration (Figure 2). While the corresponding OEF decreased by 15.22% for OS and 14.29% for IS (p = 0.001 and < 0.001, respectively) (Figures 3 and 4), and no significant change in medullary RBF was observed (p > 0.05). In the 3-day DM group, the decrease of medullary R2* and OEF post-furosemide became unremarkable, suggesting tubular dysfunction. We noticed similar changes in the 7-day post-DM group. Typical features were scored as V (3/11), I (0/11), and T (0/11) in the 3-day DM group, and V (4/11), I (0/11), and T (0/11) in the 7-day DM group. The total pathological tubular injury scores were 3 in the 3-day DM group and 4 in the 7-day DM group. Correlation analysis showed the total pathological tubular injury score significantly correlated with medullary ΔR2* (r = 0.82 for OS and 0.82 for IS) and ΔOEF (r = 0.82 for OS and 0.82 for IS) (p < 0.001, respectively). No statistically significant correlation was observed between the medullary and the total pathological tubular injury score (p > 0.05).Discussion
After furosemide, a significant decrease in medullary R2*, indicating a decreased concentration of deoxyhemoglobin, has been reported by previous studies7-10. However, BOLD MRI can only detect the renal oxygenation level. It could not distinguish between the changes in oxygenation due to an increased renal blood flow or reduced oxygen consumption. We presumed the anticipated increase in renal medullary oxygenation induced by furosemide was attributed exclusively to the decrease in renal oxygen consumption. Further, we proved this presumption with the combination of BOLD, ASE, and ASL MRI. We observed a significant medullary R2* decrease with furosemide at baseline, which could be explained by the reduced oxygen consumption (OEF) with intact medullary RBF. Correlation analysis revealed a close relationship between the pathological tubular injury score and medullary hypoxia (R2*), oxygen consumption (OEF), oxygenation change (ΔR2*), and oxygen consumption change (ΔOEF) response to furosemide. This supports the view that these functional MRI parameters could be considered representative markers of tubular dysfunction. Our results provided evidence of renal hypoxia and oxygen consumption change following furosemide diuresis and emphasized the essential role of tubular dysfunction in DM.Conclusion
In conclusion, with a combination of BOLD, ASE, and ASL MRI, we could collectively evaluate renal oxygenation, oxygen consumption, and perfusion. With this study, we could confirm that the increase in medullary oxygenation following furosemide diuresis is mainly attributed to the decreased medullary oxygen consumption, with no change of perfusion. The combination of medullary OEF and R2* might be a sensitive biomarker for evaluating tubular dysfunction.Acknowledgements
NoneReferences
1. Gilbert RE. Proximal Tubulopathy: Prime Mover and Key Therapeutic Target in Diabetic Kidney Disease. Diabetes. 2017;66:791–800.
2. Satirapoj B. Tubulointerstitial Biomarkers for Diabetic Nephropathy. J Diabetes Res. 2018:2852398.
3. Huang X, Dorhout Mees E, Vos P, Hamza S, Braam B. Everything we always wanted to know about furosemide but were afraid to ask. Am J Physiol Renal Physiol. 2016;310:F958–971.
4. Wright FS, Schnermann J. Interference with feedback control of glomerular filtration rate by furosemide, triflocin, and cyanide. J Clin Invest. 1974;53:1695–1708.
5. Obermuller N, Kunchaparty S, Ellison DH, Bachmann S. Expression of the Na-K-2Cl cotransporter by macula densa and thick ascending limb cells of rat and rabbit nephron. J Clin Invest. 1996;98:635–640.
6. Working Group of the International IgA Nephropathy Network, the Renal Pathology S, Cattran DC, et al. The Oxford classification of IgA nephropathy: rationale, clinicopathological correlations, and classification. Kidney Int. 2009;76:534–545.
7. Haddock B, Larsson HBW, Francis S, Andersen UB. Human renal response to furosemide: Simultaneous oxygenation and perfusion measurements in cortex and medulla. Acta Physiol (Oxf). 2019;227:e13292.
8. Haddock BT, Francis ST, Larsson HBW, Andersen UB. Assessment of Perfusion and Oxygenation of the Human Renal Cortex and Medulla by Quantitative MRI during Handgrip Exercise. J Am Soc Nephrol. 2018;29:2510–2517.
9. Gloviczki ML, Glockner J, Gomez SI, et al. Comparison of 1.5 and 3 T BOLD MR to study oxygenation of kidney cortex and medulla in human renovascular disease. Invest Radiol. 2009;44:566–571.
10. Textor SC, Glockner JF, Lerman LO, et al. The use of magnetic resonance to evaluate tissue oxygenation in renal artery stenosis. J Am Soc Nephrol. 2008;19:780–788.
Figures
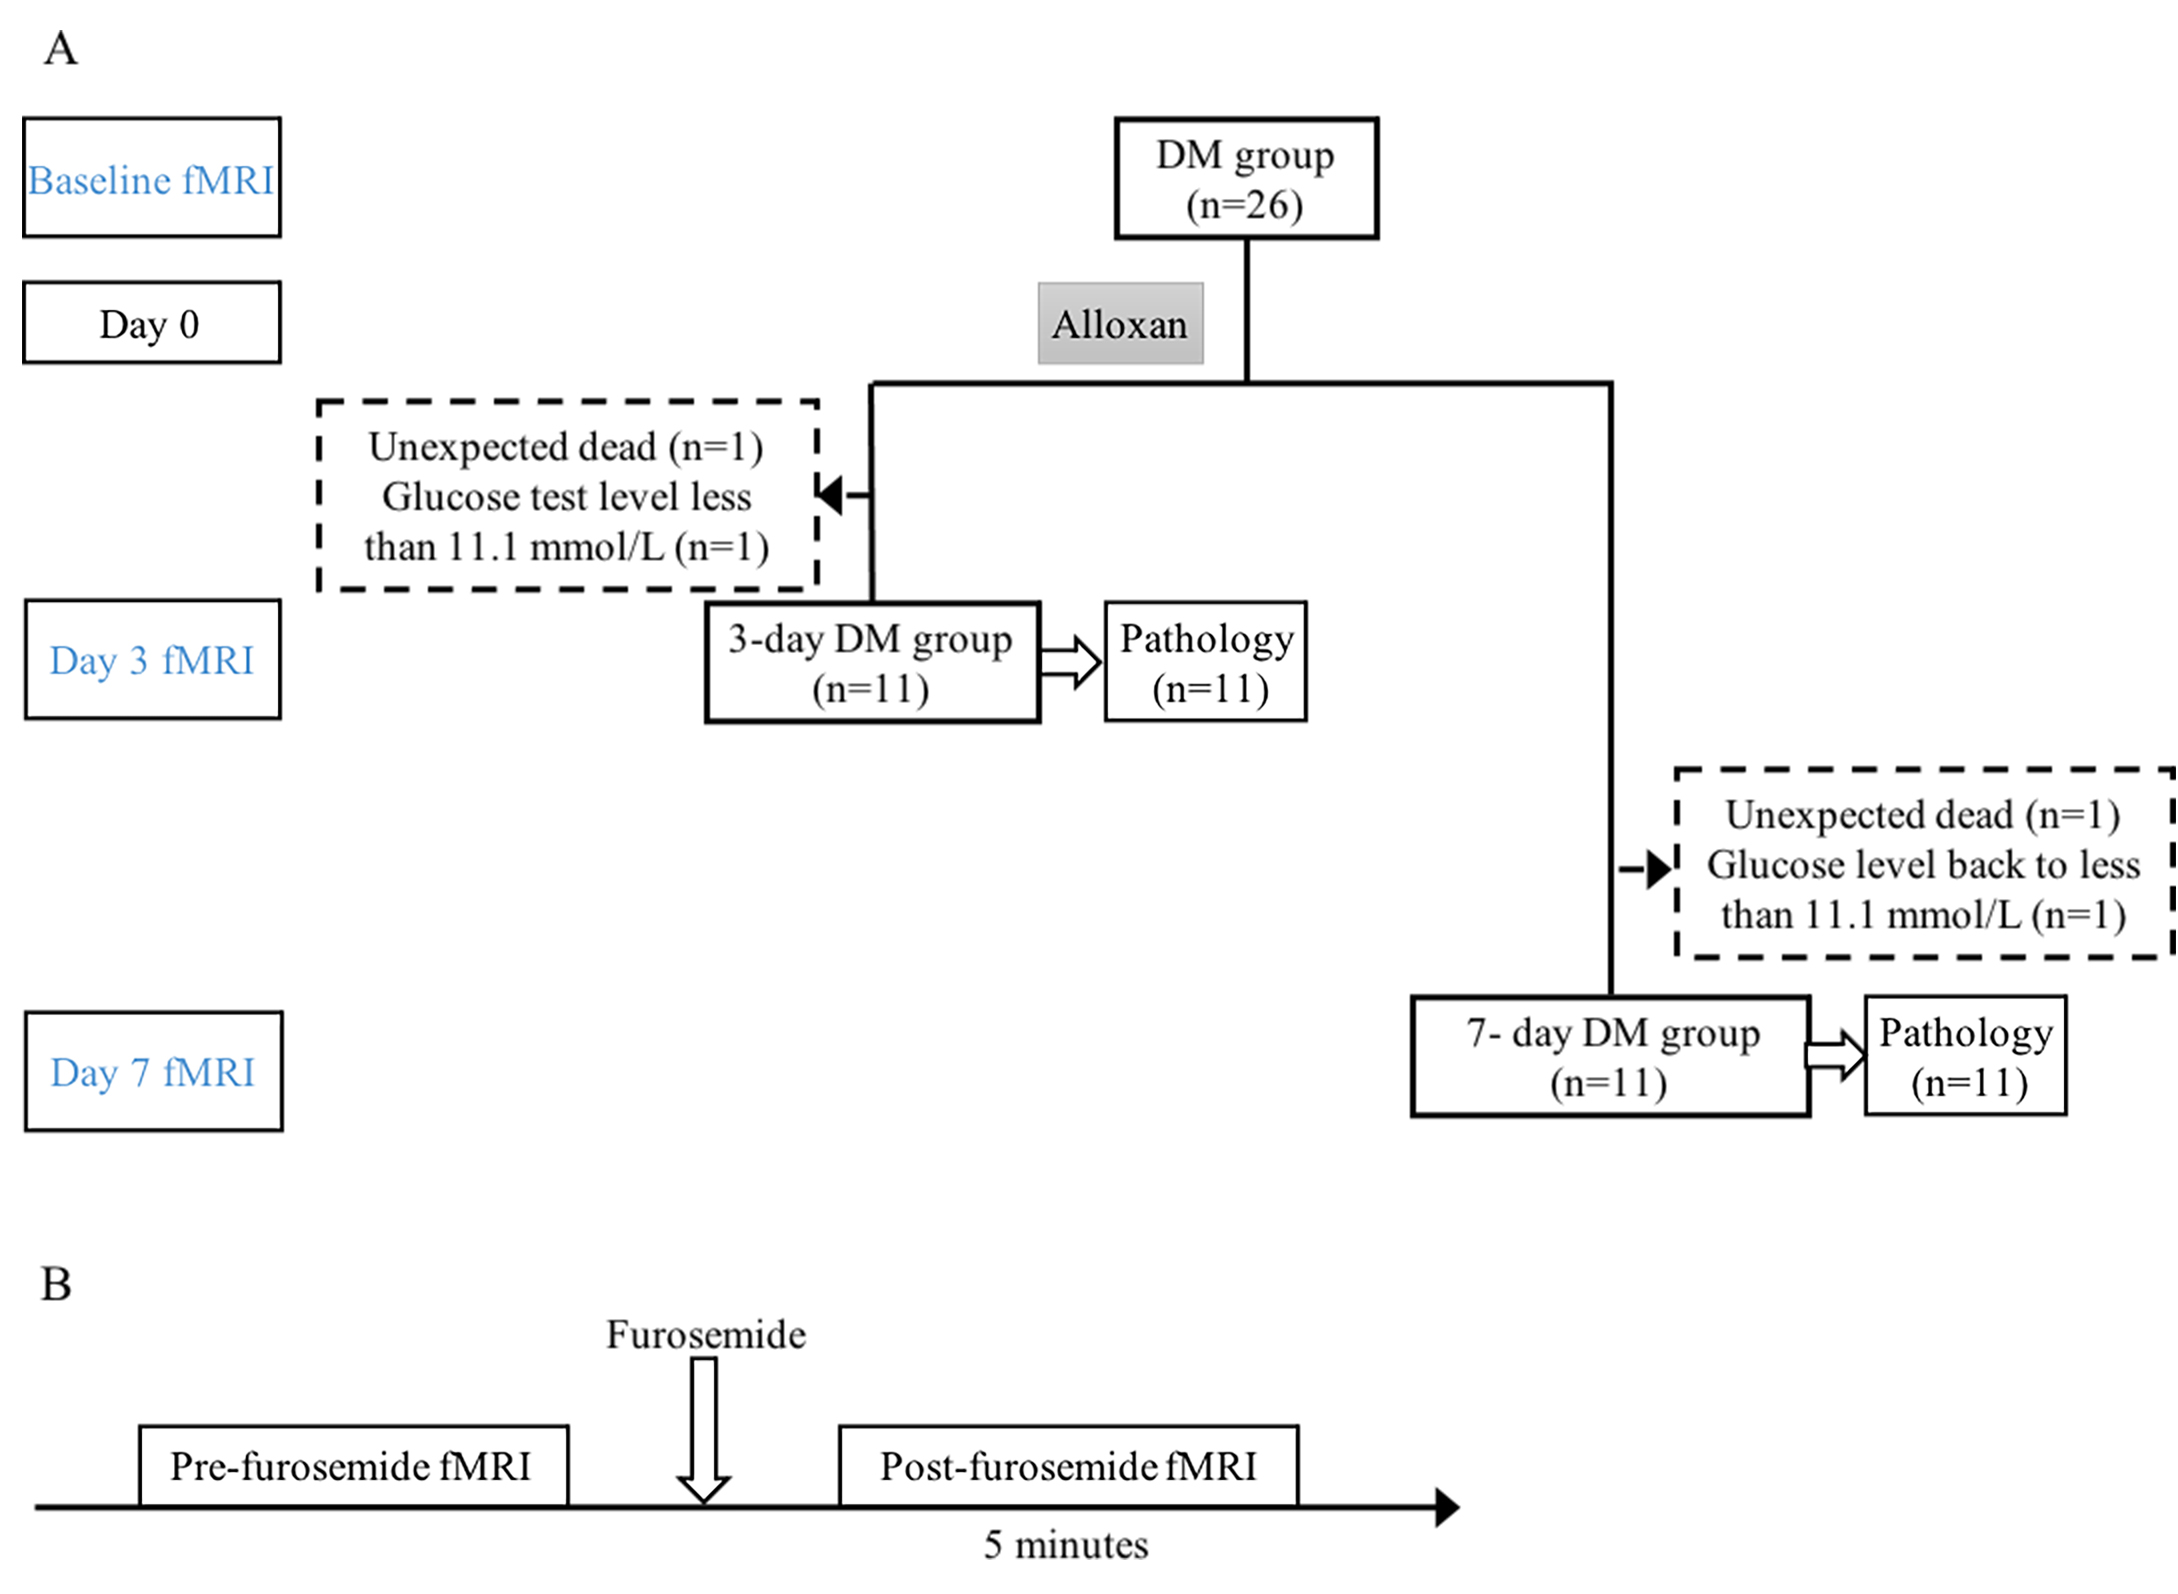
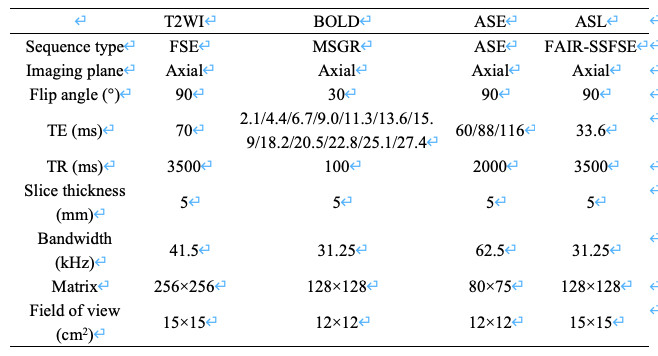
Table 1. The imaging parameters of MRI examination
Abbreviations: T2WI, T2 weighted imaging; ASE, asymmetric spin echo; ASL, arterial spin labeling; FSE, fast spin echo; MSGR, multi-echo spoiled gradient recalled echo; FAIR, flow sensitive alternating inversion-recovery; SSFSE, single-shot fast spin echo.