4398
Structural and Functional Alterations of the Hippocampal Subfields in T2DM with Mild Cognitive Impairment and Insulin Resistance1Department of Radiology, Gansu Provincial Hospital, Lanzhou, China, 2Gansu University of Traditional Chinese Medicine, Lanzhou, China, 3Ningxia Medical University, Yinchuan, China
Synopsis
Keywords: fMRI Analysis, Diabetes, Hippocampal subfields, Insulin resistance
Motivation: Insulin resistance (IR) is a common pathogenic mechanism for cognitive impairment and type 2 diabetes mellitus (T2DM), but whether it acts independently in T2DM with mild cognitive impairment (T2DM-MCI) is unclear.
Goal(s): To explore the relationship between functional and structural alterations of hippocampal subfields and IR in T2DM-MCI patients.
Approach: Based on 3D-T1WI and rs-fMRI, we calculated structural and functional alterations of hippocampal subfields in patients with T2DM.
Results: This study demonstrates that T2DM-MCI-higherIR group has more severe structural and functional impairments and IR has a main effect on the volume changes of specific hippocampal subfields.
Impact: These findings support the important role of IR in T2DM-MCI patients and the structural and functional impairment on specific hippocampal subfield might be potential neuroimaging biomarkers for early identification of brain impairment in T2DM-MCI patients.
Introduction
Type 2 diabetes mellitus (T2DM) is a metabolic disorder characterized by hyperglycemia and hyperinsulinemia. Mild cognitive impairment (MCI) is characterized by loss or decline of memory and language deterioration (1). A study found that T2DM-MCI patients were more likely to develop Alzheimer’s disease (AD) than did community elderly (2) . Insulin resistance (IR), a decrease in the sensitivity of body tissues to the action of insulin, is a core characteristic of T2DM. Evidence from literature has showed that brain IR play an important role in the pathogenic mechanism of AD (3, 4). The hippocampus is one of the brain structures more crucially involved in cognitive functions, which is critical for forming long-term, episodic memories and spatial cognition(5, 6). Although numerous studies have focused on the alteration of hippocampus in individuals with T2DM, most of these investigations have primarily examined the hippocampus as a whole, and it is well-established that the hippocampal subfields exhibit structural and functional heterogeneity (7) Furthermore, studies on rodent models and human post-mortem brain samples have shown that insulin receptor expression is higher in hippocampus, and therefore, hippocampus may be more vulnerable to IR-related brain damage (8, 9). However, the effects of IR on structural and functional impairment of specific hippocampal subfields remain to be ascertained.Methods
A total of 104 T2DM patients were recruited in this prospective study and divided into four groups (T2DM-MCI-higherIR, n = 17; T2DM-MCI-lowerIR, n = 32; T2DM-nonMCI-higherIR, n = 19; T2DM-nonMCI-lowerIR, n = 36, Figure 1). Structure and function MRI data were captured on 3.0T MR scanner (MAGNETOM Skyra, Siemens Healthcare, Erlangen, Germany) with 32-channel phased array head coil. Clinical variables and neuropsychological scores were determined for all participants.3D-T1WI images were processed-sectionally in FreeSurfer v7.2.0 recon-all pipeline for automated cortical and subcortical parcellations and tissue segmentation as preprocessing. The volume of hippocampal subfields and estimate total intracranial volume (eTIV) was extracted for subsequent statistical analysis. See Figure 2 for hippocampal subfields segmentation from MNI standard brain. The anatomical and rs-fMRI data were preprocessed using DPABISurf V1.7 software used for functional MRI data preprocessing. Hippocampal subfields that exhibited significant group differences were selected as mask to further calculate the surface-based functional connectivity map.
Hippocampal subfields volume and functional connectivity value were compared among four groups by ANCOVA while controlling for important covariates such as age, sex, years of education, eTIV and framewise displacement. Furthermore, principal factor analysis were used to determine the main effects of IR among the four groups. Partial correlation analysis was performed between imaging indicators, clinical variables, and neuropsychological scores in all patients after family error rate correction.
Results
T2DM-MCI-higherIR group had the smallest volume of bilateral hippocampal tail (P = 0.006, P = 0.032 Figure 3) , right subiculum-body (P = 0.024), right GC-ML-DG-body (P = 0.016), and right CA4-body (P = 0.014). IR in right hippocampal tail (P = 0.003), subiculum-body (P = 0.025), GC-ML -DG-body (P = 0.015) has main effect. Furthermore, an elevated FC value was found between right subiculum-body and bilateral dorsolateral prefrontal cortex and right anterior cingulate–medial prefrontal cortex (Figure 4). Finally, the FC value was positive correct between right dorsolateral prefrontal cortex (R-9-46d-ROI) and FBG (r = 0.626, PFDR = 0.03) in T2DM-nonMCI-higherIR group. The FC value was negative correct between right dorsolateral prefrontal cortex (R-a9-46v-ROI) and FINS (r = −0.553, PFDR = 0.04) and anterior cingulate–medial prefrontal cortex (R-a32pr-ROI) and FINS (r = −0.557, PFDR = 0.04) in T2DM-nonMCI-lowerIR group, and left dorsolateral prefrontal cortex (L-46-ROI) and HAMA (r = −0.465, PFDR = 0.03, Figure 5.) in T2DM-nonMCI-lowerIR group.Discussion
In this study, IR was found to be an independent risk factor affecting the volume of hippocampal subfields in T2DM-MCI patients, and we also found that T2DM-MCI patients with higher IR suffered more severe hippocampal structural and functional impairment, which may be due to the injured hippocampal subfields located in the tri-synaptic circuitry, leading to the obstruction of inflow and outflow of hippocampal information (10, 11). At the same time, the functional changes are related to the hippocampal–prefrontal circuitry (12, 13), which may be the potential physiological mechanism of cognitive and emotional changes in T2DM-MCI patients.Conclusion
In conclusion, T2DM-MCI patients with higher IR had more severe atrophy and functional impairments in specific hippocampal subfields. IR might be an independent risk factor for volume atrophy in specific hippocampal subfields based on principal factor analysis. These findings support the importance of IR in T2DM-MCI patients and underline the potential role of novel therapeutic strategies targeting brain IR.Acknowledgements
We would like to express our heartfelt gratitude to all volunteers who participated in the study and the staff of the Department of Radiology and Department of Endocrinology of Gansu Provincial Hospital for their selfless help and valuable assistance.References
1. Rizzo MR, Di Meo I, Polito R, Auriemma MC, Gambardella A, di Mauro G, et al. Cognitive impairment and type 2 diabetes mellitus: Focus of SGLT2 inhibitors treatment. Pharmacological Research. 2022;176:106062.
2. Tomic D, Shaw JE, Magliano DJ. The burden and risks of emerging complications of diabetes mellitus. Nat Rev Endocrinol. 2022;18(9):525-39.
3. Michailidis M, Moraitou D, Tata DA, Kalinderi K, Papamitsou T, Papaliagkas V. Alzheimer's Disease as Type 3 Diabetes: Common Pathophysiological Mechanisms between Alzheimer's Disease and Type 2 Diabetes. Int J Mol Sci. 2022;23(5).
4. De Felice FG, Gonçalves RA, Ferreira ST. Impaired insulin signalling and allostatic load in Alzheimer disease. Nature reviews Neuroscience. 2022;23(4):215-30.
5. O'keefe J, Nadel LJB, Sciences B. Précis of O'Keefe & Nadel's The hippocampus as a cognitive map. 1979;2(4):487-94.
6. Eichenbaum H. A cortical-hippocampal system for declarative memory. Nature reviews Neuroscience. 2000;1(1):41-50.
7. van der Meer D, Rokicki J, Kaufmann T, Córdova-Palomera A, Moberget T, Alnæs D, et al. Brain scans from 21,297 individuals reveal the genetic architecture of hippocampal subfield volumes. Molecular Psychiatry. 2020;25(11):3053-65.
8. Arnold SE, Arvanitakis Z, Macauley-Rambach SL, Koenig AM, Wang H-Y, Ahima RS, et al. Brain insulin resistance in type 2 diabetes and Alzheimer disease: concepts and conundrums. Nature reviews Neurology. 2018;14(3):168-81.
9. Kullmann S, Kleinridders A, Small DM, Fritsche A, Häring H-U, Preissl H, et al. Central nervous pathways of insulin action in the control of metabolism and food intake. Lancet Diabetes Endocrinol. 2020;8(6):524-34.
10. Haukvik UK, Westlye LT, Mørch-Johnsen L, Jørgensen KN, Lange EH, Dale AM, et al. In vivo hippocampal subfield volumes in schizophrenia and bipolar disorder. Biological psychiatry. 2015;77(6):581-8.
11. Hainmueller T, Bartos M. Dentate gyrus circuits for encoding, retrieval and discrimination of episodic memories. Nature reviews Neuroscience. 2020;21(3):153-68.
12. Park AJ, Harris AZ, Martyniuk KM, Chang C-Y, Abbas AI, Lowes DC, et al. Reset of hippocampal-prefrontal circuitry facilitates learning. Nature. 2021;591(7851):615-9.
13. Eichenbaum H. Prefrontal-hippocampal interactions in episodic memory. Nature reviews Neuroscience. 2017;18(9):547-58.
Figures
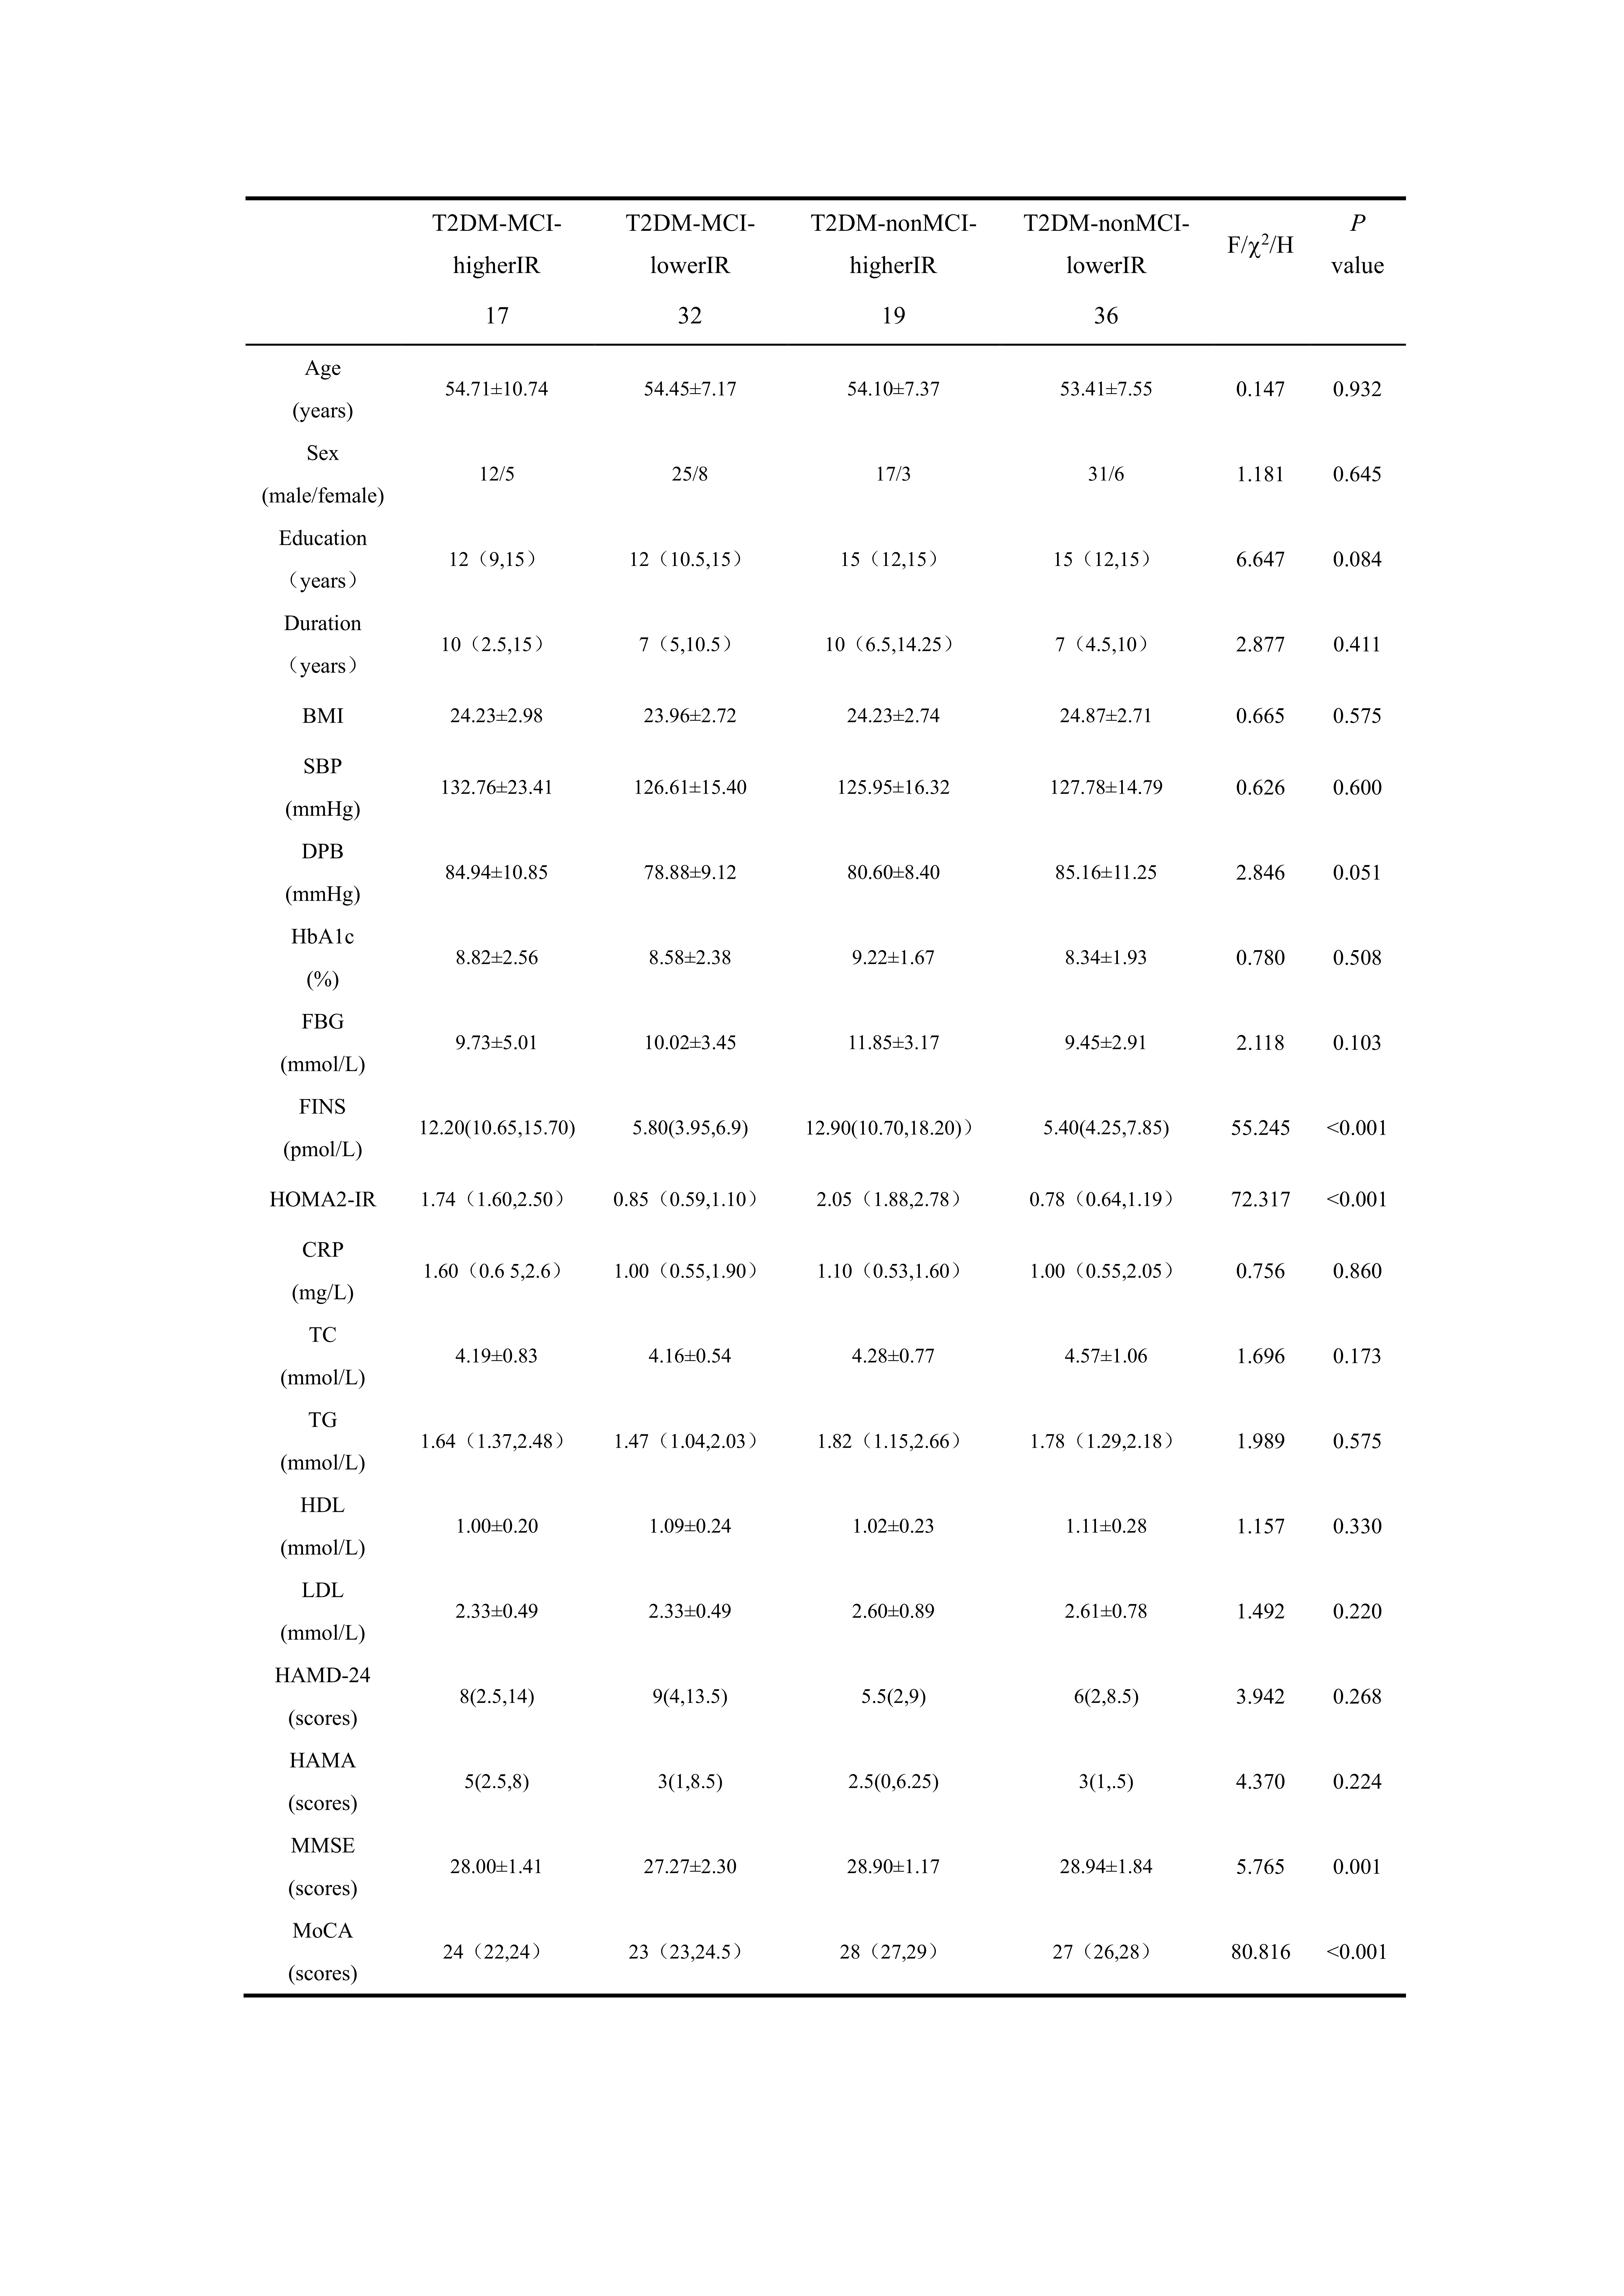
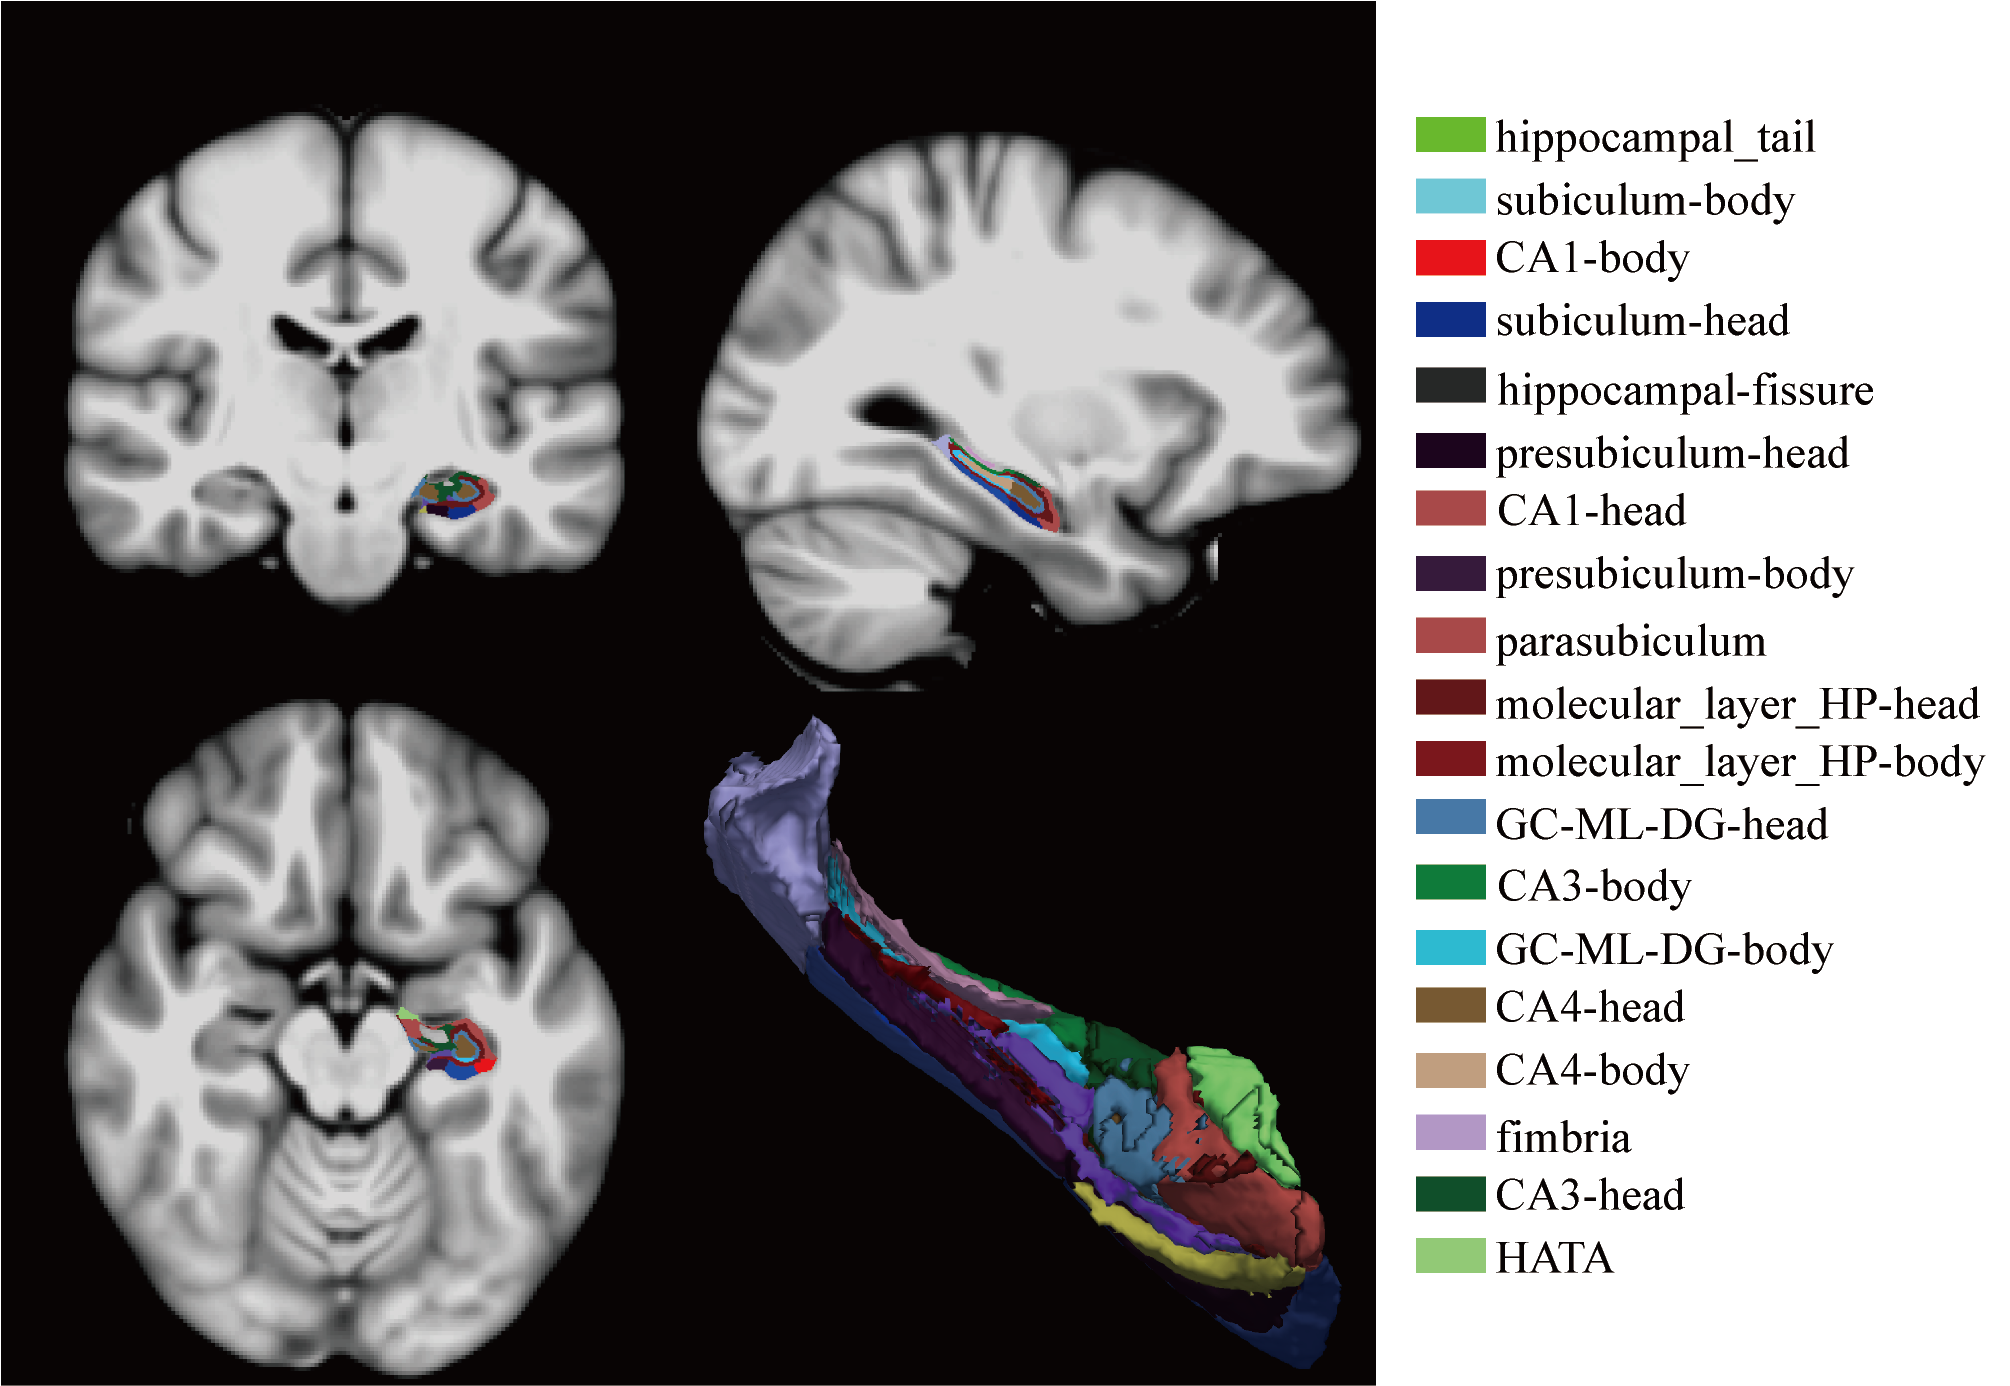
Figure 2. Anatomical location of the hippocampus and its subfields presented in the MNI standard brain;
CA, cornu ammonis; GC-ML-DG, granule cell layer of dentate gyrus; HATA, hippocampus–amygdala transitionarea.
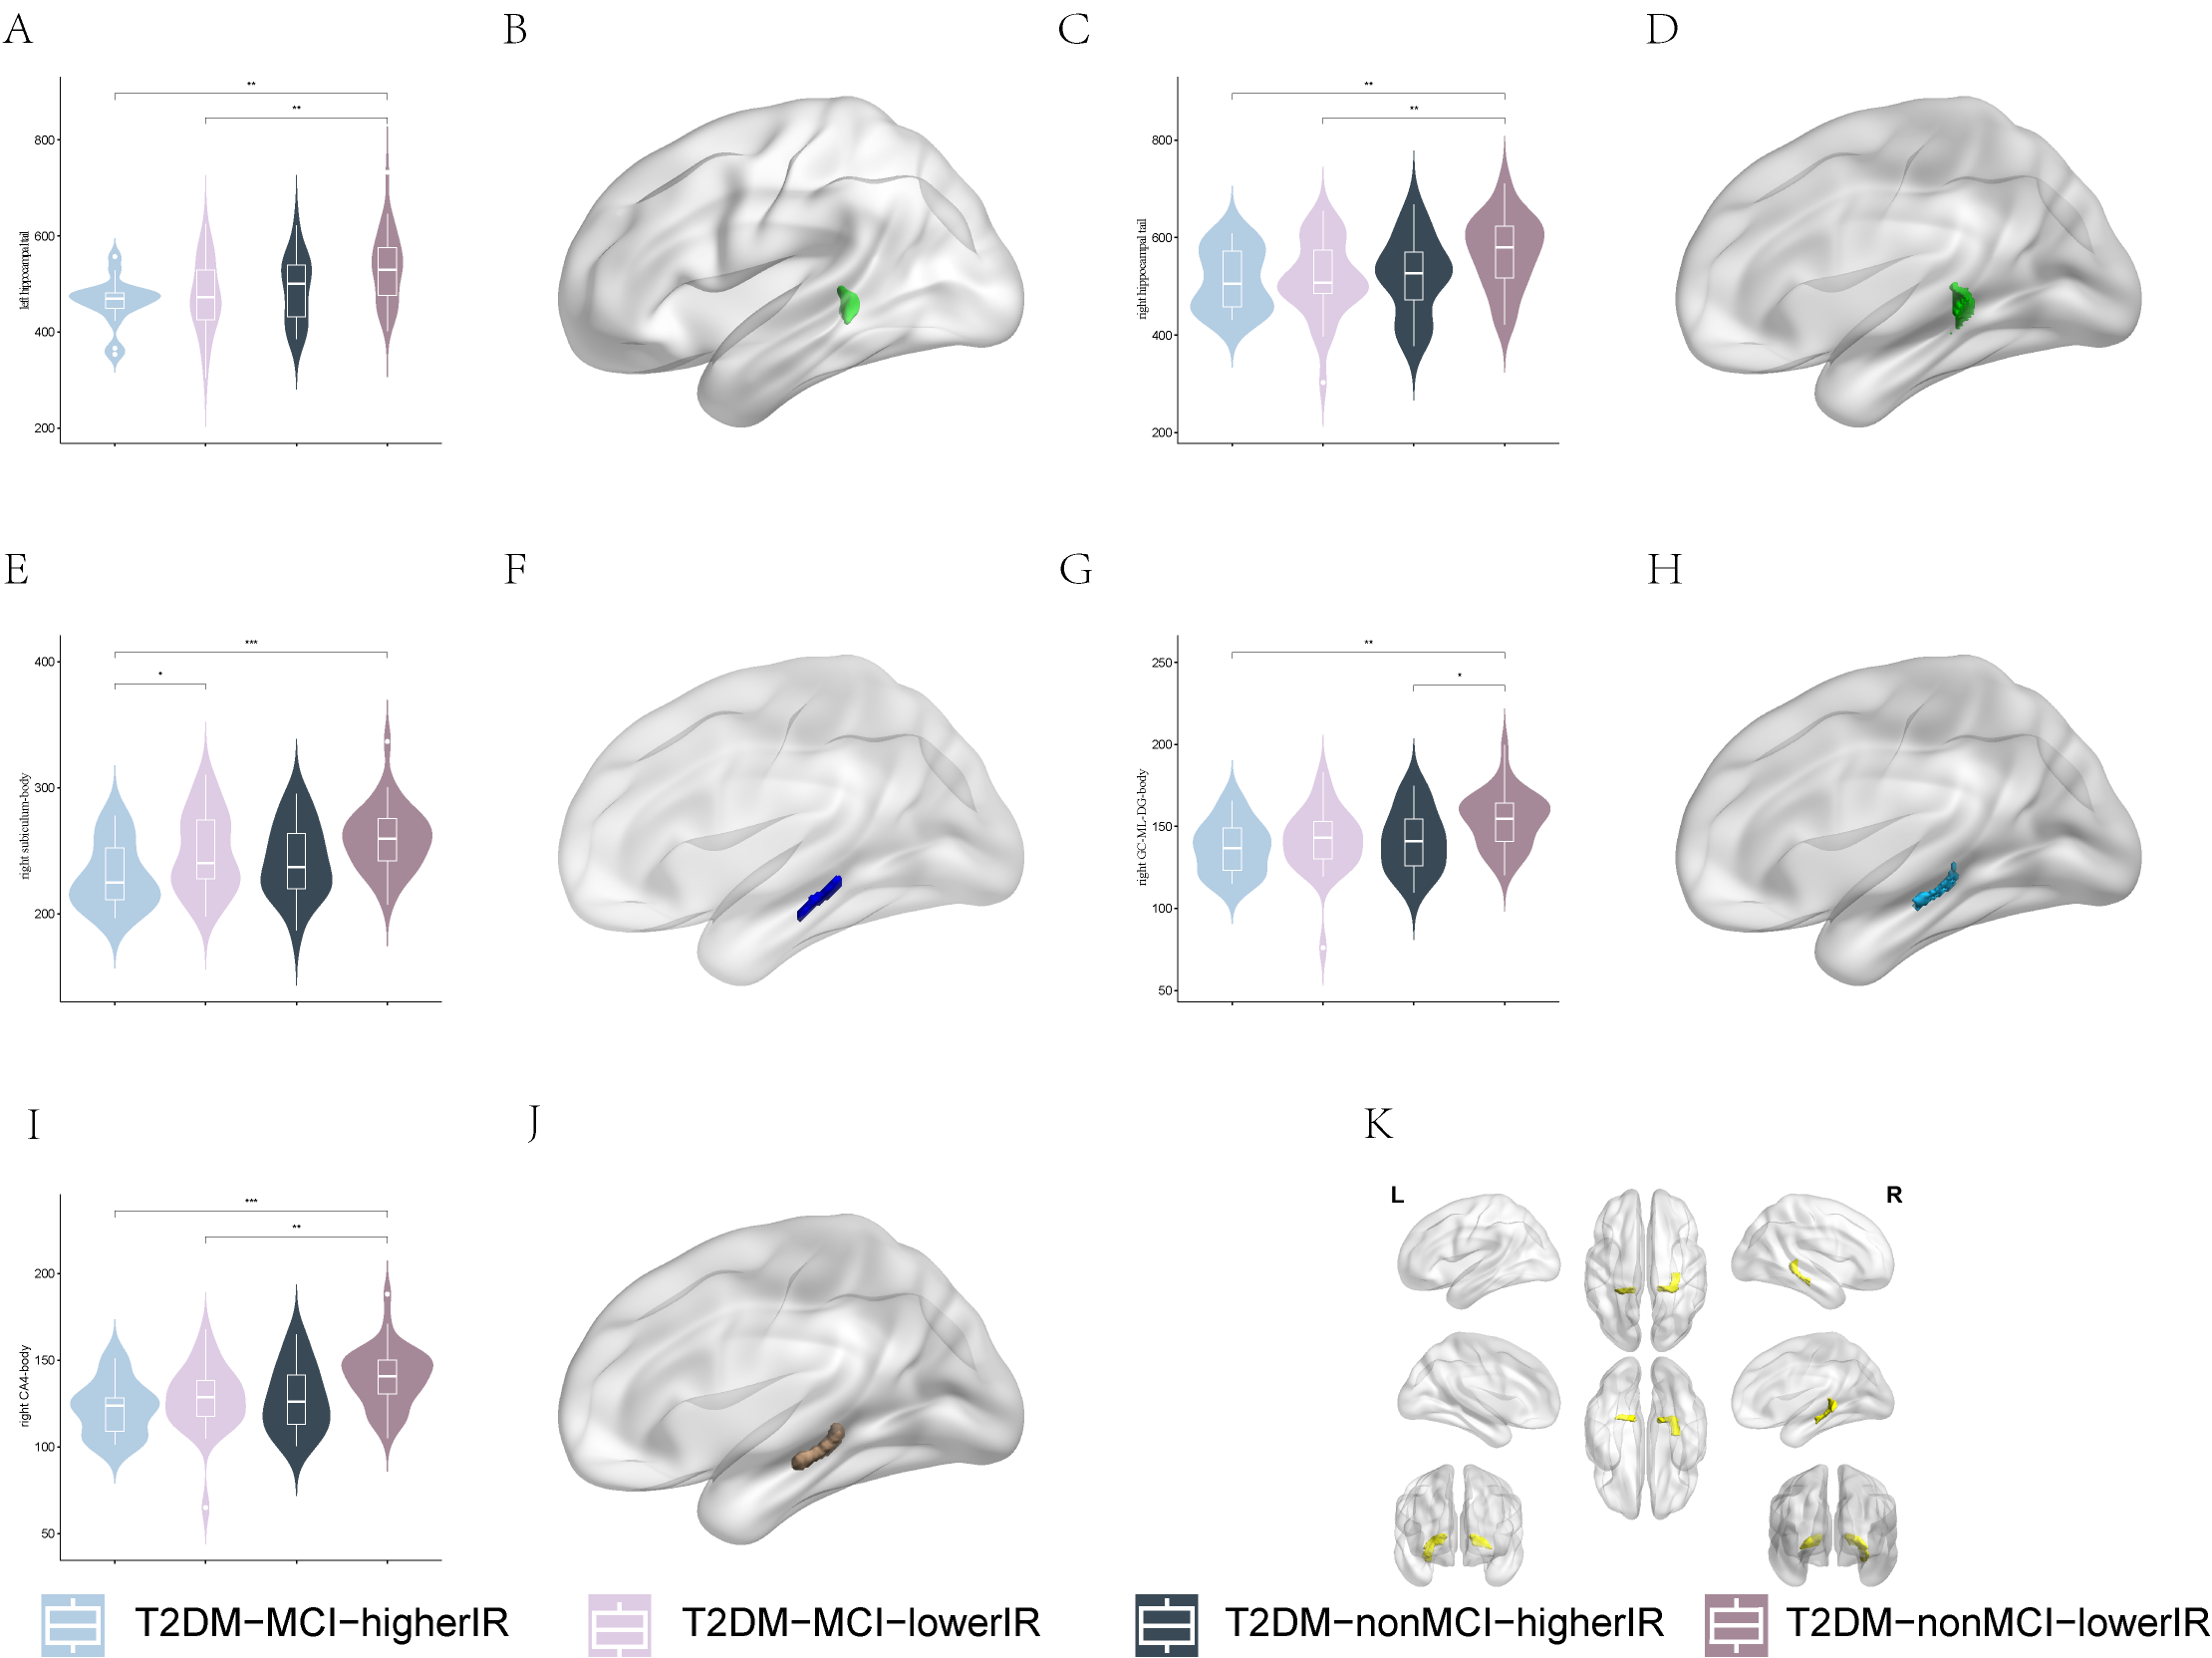
Figure 3. Comparison of hippocampal subfields volume among four groups
A~D. location and intergroup differences of bilateral hippocampal tail; E~F. location and intergroup differences of right subiculum-body; G~H. location and intergroup differences of right GC-ML-DG-body; I-J. location and intergroup differences of right CA4-body; K. location of all intergroup differences regions; T2DM, type 2 diabetes mellitus; MCI, mild cognitive impairment; IR, insulin resistance; CA, cornu ammonis; GC-ML-DG, granule cell layer of dentate gyrus.*.P<0.05; **.P<0.01; ***.P<0.001,
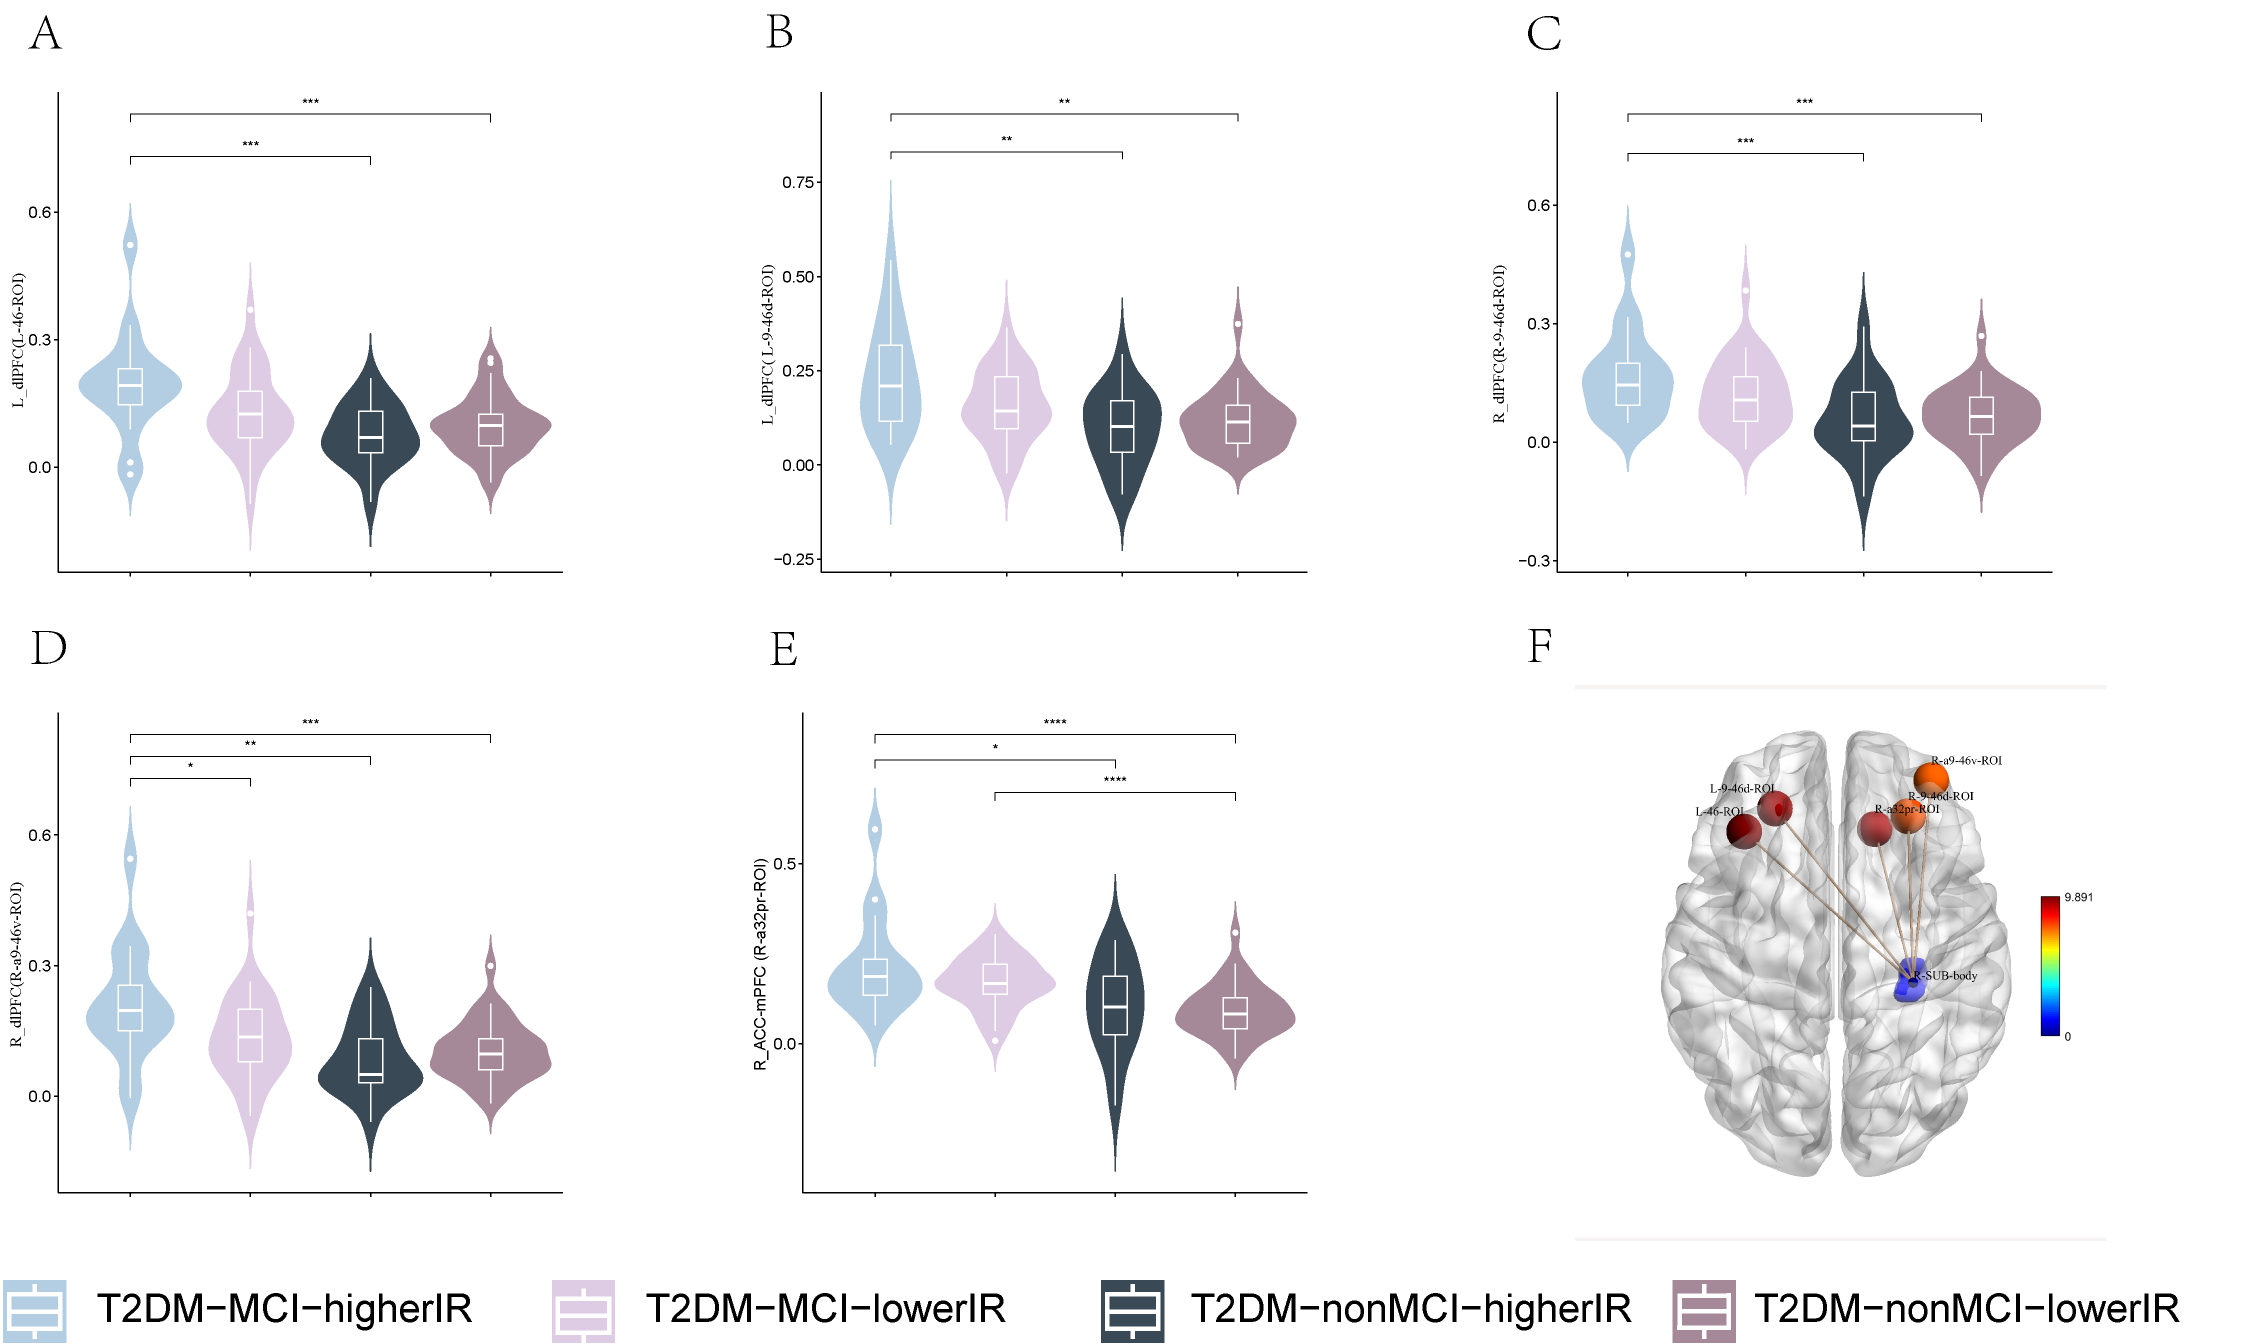
A~E. Intergroup differences in FC value between ROI and L-46-ROI, L-9-46d-ROI, R-9-46d-ROI,R-a9-46v-ROI and R-a32pr-ROI; E. location of ROI and L-46-ROI, L-9-46d-ROI, R-9-46d-ROI, R-a9-46v-ROI, R-a32pr-ROI; T2DM, type 2 diabetes mellitus; MCI, mild cognitive impairment; IR, insulin resistance; ROI, region of interest; FC, functional connectivity; *.P<0.05; **.P<0.01; ***.P<0.001; ****.P<0.0001; TFCE (5000 permutations, FWE P<0.025 ); post-hoc: Bonferroni (P < 0.025).
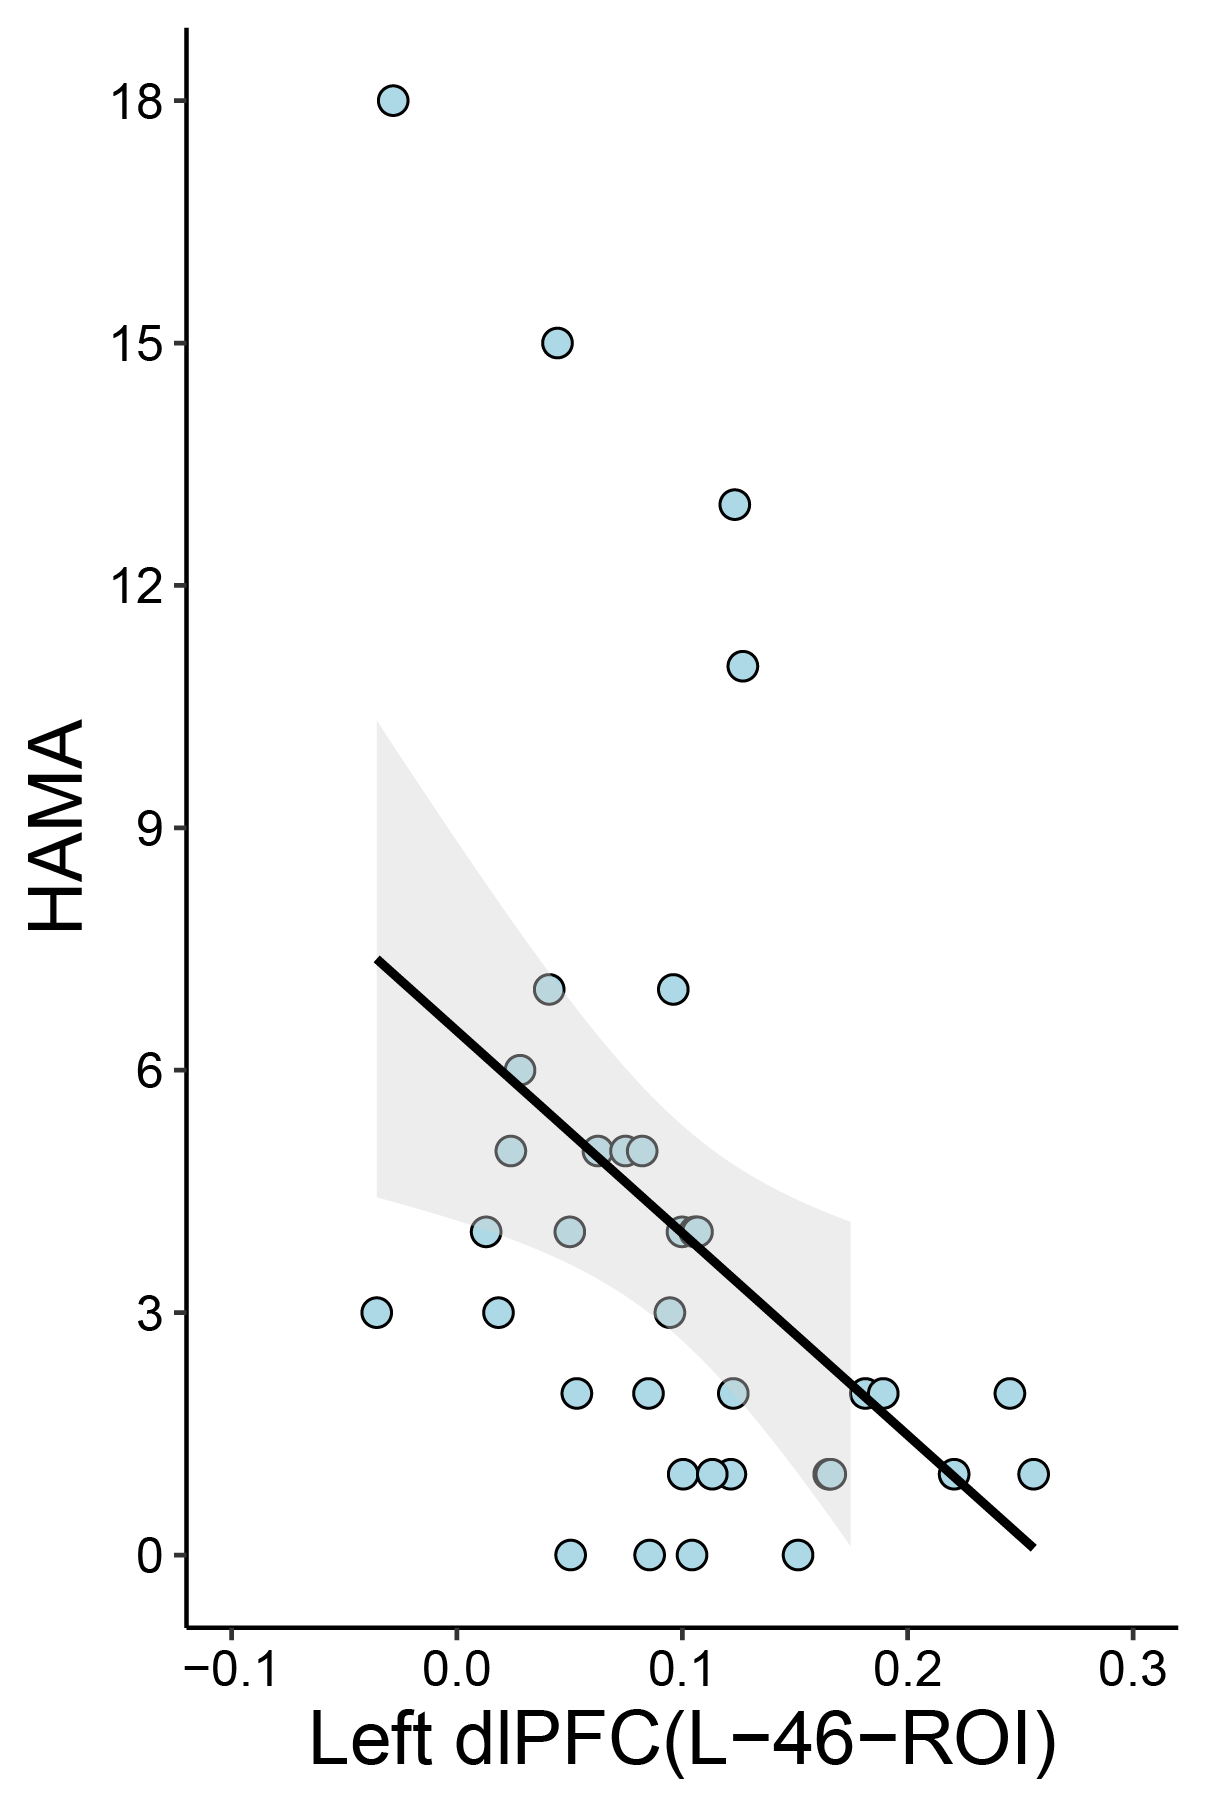
Figure 5. Correlation analysis
Correlation between FC value of right subiculum-body - left dorsolateral prefrontal cortex (L-46-ROI) and HAMA in T2DM-nonMCI-lowerIR group (r = −0.465, PFDR = 0.03), T2DM, type 2 diabetes mellitus; MCI, mild cognitive impairment; IR, insulin resistance; ROI, region of interest; FC, functional connectivity; HAMA, Hamilton Anxiety Scale.