4392
Neurovascular signal changes in response to glucose infusion measured with resting-state fMRI at 7T1Radiology and Neurosurgery, University Medical Center Utrecht, Utrecht, Netherlands, 2Radiology, University Medical Center Utrecht, Utrecht, Netherlands, 3Neurosurgery, University Medical Center Utrecht, Utrecht, Netherlands
Synopsis
Keywords: Gray Matter, Metabolism
Motivation: To examine the impact of 2-hour glucose infusion on neuronal activity, potentially advancing our understanding of diseases such as diabetes and their regulation of intake, thermogenesis, and the neuroendocrine system.
Goal(s): Determining whether prolonged glucose infusion affects neuronal activity as measured using rsfMRI at 7T.
Approach: High resolution resting-state (rsfMRI) were acquired before and directly after glucose infusion in 9 healthy adult subjects. Neuronal fluctuations were characterized using Fourier-based spectral analysis.
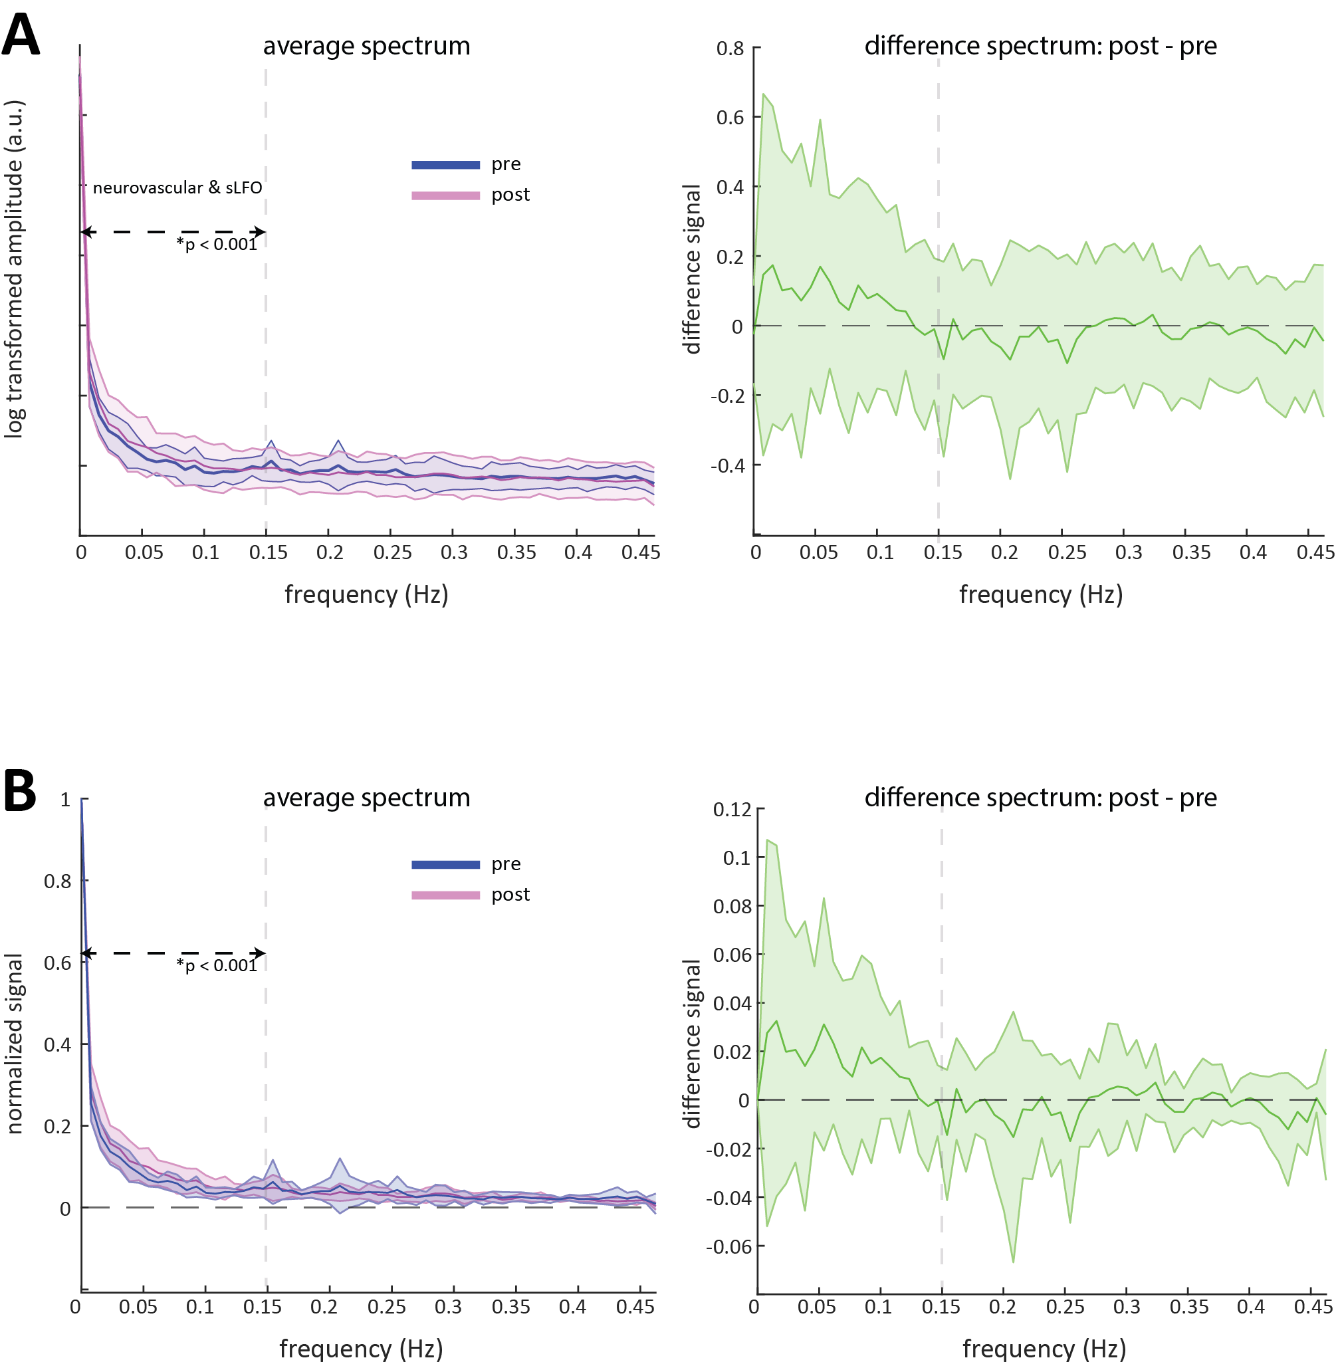
Results: In grey matter, significant differences between pre- and post-glucose infusion were observed, with higher post-infusion rsfMRI amplitudes across various frequencies, especially in the 0-0.15Hz range associated with neuronal fluctuations.
Impact: Our results confirm that changing glucose levels modulate neuronal function. Extended glucose infusion increases mean signal power and induces increased signal variation in neuronal fluctuations. Future studies are needed to further understand the mechanisms behind this variance.
Introduction
Glucose is the critical energy source supporting optimal brain function, and its metabolism is tightly regulated to ensure neuro-physiological homeostasis1. Resting-state fMRI (rsfMRI), which is sensitive to the Blood Oxygen Level Dependent (BOLD) contrast, can be applied to probe brain function. Here, variations in venous deoxyhemoglobin give rise to signal changes that are accepted as surrogate indictors of neuronal activity. However, the BOLD contrast is derived from various factors including changes in blood saturation, hemodynamics, and physiological noise from sources like heart rate, respiration, and uncharacterized systemic contributions2,3.While the importance of glucose for neuronal functioning is clear, the effects of altering brain glucose levels on neuronal function remain subject of investigation. Existing evidence indicates increased neuronal firing rates and enhanced BOLD signal in cortical control areas with elevated glucose levels 4,5. Yet, BOLD-fMRI studies have not explored changes in neuronal response following prolonged glucose infusion. In this context, we aim to assess the modulation of neuronal activity by prolonged glucose infusion after an overnight fast. Considering that spontaneous neuronal fluctuations are generally thought to occur within the 0-0.15 Hz range, our hypothesis is that that glucose-induced alterations in brain metabolism will lead to changes in signal amplitude within this range.
Methods
Our fMRI measurements were secondary outcome measures in a 13C magnetic resonance spectroscopy (MRS) study where 9 healthy adult males (age: 18-40 years) completed an overnight fast and underwent examination using 7T MR system (Philips, Best, NL). Participants received intravenous catheters for glucose infusion and blood sampling, and were positioned in the MR system where data were acquired before and after a 2-hour glucose infusion. We used a homebuilt head-coil with 8 transmit-receive (TxRx) 1H dipole antennas and a 32-channel 1H receive array (Nova Medical, Wilmington, USA)6.Pre- and post-infusion (i.e. directly after stopping glucose infusion) resting-state T2*-weighted multi-slice gradient echo data (rsfMRI) were acquired using the following parameters: TE/TR=27/1080ms, flip angle=70, voxel size=1.5mm3, SENSE 2.5 (RL), 20 slices 120 dynamic scans and scan duration of ~5minutes.
Post-processing
Optimization of shim settings for 13C measurements necessitated a non-standard 5-class segmentation (FSL: FAST)7 be performed directly using the fMRI data. GM partial volume maps were binarized including only voxels with >50% GM content.
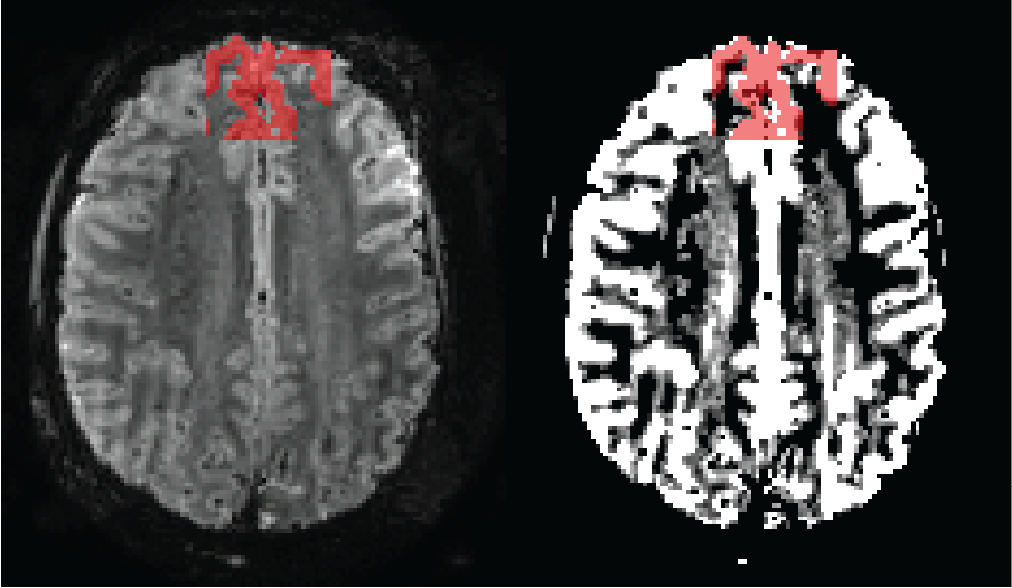
Each subject underwent spectral Fourier analysis using functions from the Matlab-based seeVR toolbox8. Our analysis primarily focused on a manually delineated 30mm ROI in the cortical GM of the frontal lobe, optimized for minimal artifacts (Figure 1).
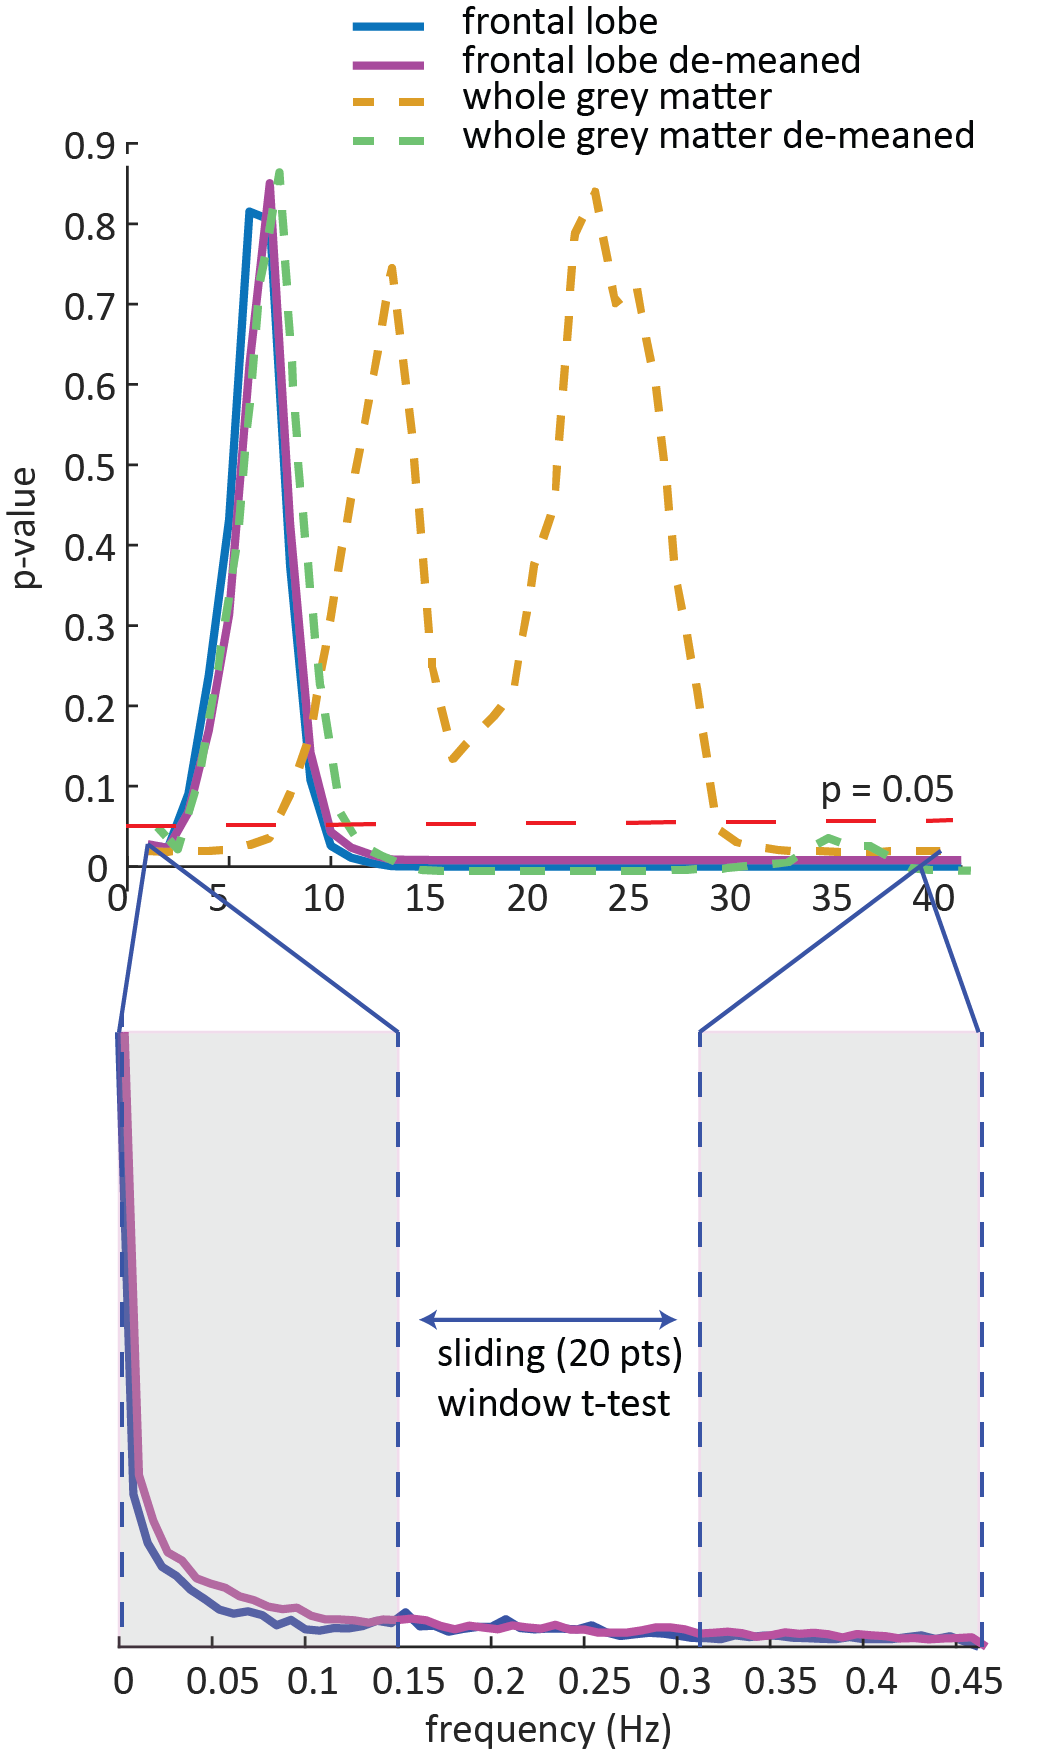
Log-transformed amplitude spectra from pre- and post-infusion data were averaged across the 9 subjects, and pairwise statistical comparisons were conducted using a Student's t-test. We applied a 20-volume sliding window (approximately 0.15 Hz) to investigate significant differences within different frequency ranges, as various frequencies are associated with independent physiological processes. Additionally, we evaluated various pre-processing methods for the mean GM signal and the frontal-lobe ROI, including de-meaning and signal normalization (for the frontal-lobe ROI) between 0 and 1 to address baseline offsets.
Results
Plasma glucose levels ranged from 3.5-4.5 mmol/L prior to the infusion and rose to 6.5-9.0 mmol/L during the infusion. Figure-1 illustrates the frontal GM segmentation in a single subject. A significant difference (p<0.05) in the 0-0.15 Hz range was observed between pre and post-glucose infusion in all our analysis approaches. Figure 2 displays results from the frontal lobe segmentation before and after spectral normalization. We observed a notably higher mean signal amplitude post-glucose infusion the 0-0.15 Hz band that did not extend to higher frequencies. Additionally, increased amplitude variability was observed in the low-frequency range (Figure-2).Nevertheless, higher frequencies showed significant differences that were likely driven by variability associated with respiration and possible aliasing of cardiac signals (Figure-3).
Discussion and conclusion
We found a significant increase in mean signal amplitude within the 0-0.15 Hz range, along with a higher standard deviation, indicating stronger yet more variable neuronal (or systemic low-frequency oscillations sLFO) fluctuations. Distinguishing neuronal from sLFO remains challenging due to their overlap, but previous observations suggest that changes in blood glucose levels likely drive the measured responses5.Our findings have the potential to improve our understanding of brain function following fasting and diseases like diabetes and their impact on aspects such as intake, thermogenesis, and the neuroendocrine system.
However, the origin of the changes in BOLD signal during prolonged glucose infusion are not well-understood. It's uncertain whether this elevated signal normalizes or if high glucose levels lead to a prolonged increase. Additional studies are needed to explore this further, including continuous rs-fMRI during prolonged infusion and an extended post-infusion period.
Acknowledgements
No acknowledgement found.References
1. Mergenthaler P, Lindauer U, Dienel GA, Meisel A. Sugar forthe brain: the role of glucose in physiological and pathologicalbrain function. Trends Neurosci2013;36(10):587–97.
2. Forster BB, MacKay AL, Whittall KP, Kiehl KA, Smith AM,Hare RD, et al. Functional magnetic resonance imaging: thebasics of blood-oxygen-level dependent (BOLD) imaging. CanAssoc Radiol J1998;49(5):320–9
3. Buxton, R. B., Wong, E. C., and Frank, L. R. (1998). Dynamics of blood flow andoxygenation changes during brain activation: the balloon model.Magn. Reson.Med.39, 855–864. doi: 10.1002/mrm.1910390602
4. Hongwen Zheng, Rubin Wang & Jingyi Qu. Effect of different glucose supply conditions on neuronal energy metabolism. Cognitive Neurodynamics volume 10, pages563–571 (2016).
5. J Q Purnell , B A Klopfenstein, A A Stevens, P J Havel, S H Adams, T N Dunn, C Krisky, W D Rooney. Brain functional magnetic resonance imaging response to glucose and fructose infusions in humans. Diabetes Obes Metab. 2011 Mar;13(3):229-34.
6. Jacobs SM, Prompers JJ, van der Kemp WJM, van der Velden TA, Gosselink WJM, Hoogduin JM, Mason GF, de Graaf RA, van der Kolk AG, Alborahal C, Klomp DW, Wiegers EC. Human brain POCE MRS at 7T using a 13C birdcage coil and 8 transmit-receive 1H antennas with a 32-channel 1H receive array. Proceedings of the Joint ISMRM-ESMRMB 31st Annual Meeting.
7. Jenkinson M, Beckmann CF, Behrens TE, Woolrich MW, SmithSM.FSL. Neuroimage2012;62(2):782–90
8. Alex A. Bhogal, (2023). abhogal-lab/seeVR: v1.6 (v1.6). Zenodo. https://doi.org/10.5281/zenodo.8253292
Figures