4386
MEGA-PRESS Detects the Changes of Metabolite in Parkinson's Disease with Depression1Zhujiang Hospital, Southern Medical, Guangzhou, China, 2Philips Healthcare, Guangzhou, China, Guangzhou, China, 3Philips Healthcare, Shanghai, China, Shanghai, China
Synopsis
Keywords: Parkinson's Disease, Quantitative Imaging, MEGA-PRESS
Motivation: Altered λ-aminobutyric acid (GABA) levels have been observed in Parkinson's disease (PD), and these discrepancies may depend in differences of clinical symptoms. However, the role o GABA and glutamate concentrations of depression in Parkinson's disease (DPD) remains unexplored.
Goal(s): To explore the changes of GABA+, glutamate and glutamate (Glx) in DPD.
Approach: We utilized MEGA-PRESS to measure GABA+ and Glx levels in the medial frontal cortex (MFC) and thalamus among PD patients with and without depression, along with aged-matched healthy participants.
Results: GABA+ levels were found to be elevated within MFC in individuals with DPD, independent of the presence of Parkinson’s disease.
Impact: These findings suggest that GABAergic alterations in specific brain regions might be linked to the clinical symptoms of PD. Modulating GABAergic function could be a potential approach for treating DPD.
Introduction
Depession represents a common non-motor symptom in Parkinson’s disease (PD), with approximately 60% of PD patients experiencing depressive symptoms throughout the course of the disease1. These symptoms give rise to feelings of anxiety, loss of interest, hopelessness, and other negative emotions. Beyond that depression in Parkinson's disease (DPD) can exacerbate other symptoms, diminish the quality of life for PD patients, and elevate disability rates.γ-aminobutyric acid (GABA) serves as a principal inhibitory neurotransmitter within the central nervous system, and mounting evidence has underlined its involvement in the pathogenesis of PD2. Recent research has increasingly indicated that depression correlates with an imbalance of excitation–inhibition (E:I), arising from a deficiency in inhibitory synaptic transmission to key glutamatergic neurons3. Converging lines of evidence from various research suggest that GABA and glutamatergic dysfunctions contribute to the pathophysiology of depression4. However, to date, no previous study has delved into the GABA and glutamate concentrations in PD with depression. Consequently, the present study seeks to explore differences in GABA, glutamate, and glutamine (Glx) levels between PD with and without depression using MEGA-PRESS. This endeavor aims to furnish fresh insights into the potential pathogenesis and treatment of PD with depression.Methods
Fifty-four primary PD patients and twenty-three healthy controls (HC) were included in this study. PD patients were categorized into two groups based on the 17-item Hamilton Rating Scale for Depression (HAMD-17): Depressed Parkinson’s Disease (DPD) group (n=12) and Non-Depressed Parkinson's disease (NDPD) group (n=42). All subjects underwent T1-weighted imaging and MEGA-PRESS sequence to acquire GABA+ levels. High-resolution 3D T1WI was used to obtain high-resolution three-dimensional brain structural images, with the resulting coronal, sagittal, and axial images facilitating volume of interest (VOI) localization. The MEGA-PRESS sequence was carried out using 18.48ml voxels in both the left thalamus and medial frontal cortex (MFC) (see Figure 1). Gannet 3.1 was employed to process the data, enabling the quantification of GABA+, Glx, and Creatine (Cr) levels (see Figure 2). Statistical analysis was conducted to compare the concentration of metabolites such as GABA+ and the demographic characteristics among the three groups.Results
Comparing demographic and clinical data between DPD and NDPD groups revealed that the DPD group exhibited higher UPDRS Ⅰ scores (p=0.007), which assessed patients’ mental, behavioral, and emotional states. DPD patients were also more prone to anxiety, as indicated by the HAMA sore (p < 0.001). However, there were no significant differences in other clinical data, including gender, age, course of the disease, and other UPDRS scores between the two groups.The GABA+/Water level in the MFC of PD patients was significantly lower than that in healthy controls (HC) (p=.015). Notably, when GM proportion was included as a covariate in the analysis, this difference became less pronounced (p=.059). Moreover, GABA+/Water and GABA+/Cr levels in the MFC were increased in DPD compared to NDPD (p=.003, p=.015), while there was no statistical difference between the DPD and HC.There was no evidence indicating that depression had an effect on Glx or other metabolite levels, and no significant difference was observed in metabolite levels in the left thalamic among all groups (p >. 05). Comparison of GM proportion within the voxel between groups revealed reduced gray matter in the MFC of Parkinson’s disease patients.Discussion
Our study shows GABA+ concentrations were increased in DPD compared to NDPD, while Glx levels did not differ significantly between the two groups. These findings support the hypothesis that depression in the context of PD is related to an imbalance of overall excitation-inhibition, potentially stemming from alterations in GABA and/or glutamate. Such an imbalance of excitation and inhibition, especially in the prefrontal regions, is known to be associated with a shift in mental focus from external to internal, which is a hallmark symptom of major depression5. Our results align with prior functional MRI research that has shown decreased functional connectivity among various brain regions in individuals with depression6. Importantly, our research does not support the idea that the observed changes in GABA levels are directly associated with PD, in contrast to previous researches7. Therefore, the alterations in GABA+ we observed may be interpreted as a functional feature of depression that is independent of the underlying pathology associated with PD.Conclusion
This study demonstrates increased GABA+ within MFC in DPD, independent of Parkinson’s disease. This implies that alterations of GABAergic in specific brain structures may be related to the clinical symptoms of PD, particularly in the context of depression. These findings suggest remediating GABAergic function may be a vialbe approach to treating depression with Parkinson’s disease.Acknowledgements
No acknowledgement found.References
1. Lachner C, Armstrong MJ, Gruber-Baldini AL, et al. Discordance between physician assessment and patient-reported depressive symptoms in parkinson disease. J Geriatr Psychiatry Neurol. 2017;30(4):191-195. doi:10.1177/08919887177103352.
2.Terkelsen MH, Hvingelby VS, Pavese N. Molecular imaging of the gabaergic system in parkinson's disease and atypical parkinsonisms. Curr Neurol Neurosci Rep. 2022;22(12):867-879. doi:10.1007/s11910-022-01245-z3.
3.Fogaça MV, Duman RS. Cortical gabaergic dysfunction in stress and depression: new insights for therapeutic interventions. Front Cell Neurosci. 2019;13:87. doi:10.3389/fncel.2019.000874.
4.Kantrowitz JT, Dong Z, Milak MS, et al. Ventromedial prefrontal cortex/anterior cingulate cortex glx, glutamate, and gaba levels in medication-free major depressive disorder. Transl Psychiatry. 2021;11(1):419. doi:10.1038/s41398-021-01541-15.
5.Lemogne C, Delaveau P, Freton M, Guionnet S, Fossati P. Medial prefrontal cortex and the self in major depression. J Affect Disord. 2012;136(1-2):e1-e11. doi:10.1016/j.jad.2010.11.0346.
6.Guo T, Guan X, Zhou C, et al. Clinically relevant connectivity features define three subtypes of parkinson's disease patients. Hum Brain Mapp. 2020;41(14):4077-4092. doi:10.1002/hbm.251107.
7.Delli PS, Franciotti R, Ferretti A, et al. High γ-aminobutyric acid content within the medial prefrontal cortex is a functional signature of somatic symptoms disorder in patients with parkinson's disease. Mov Disord. 2020;35(12):2184-2192. doi:10.1002/mds.28221.
Figures
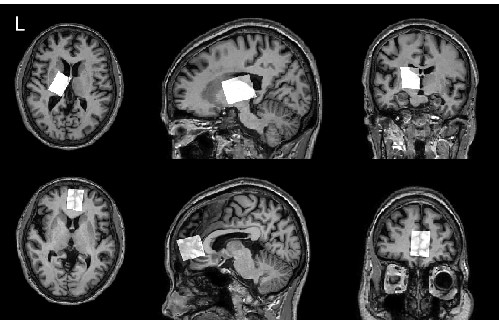
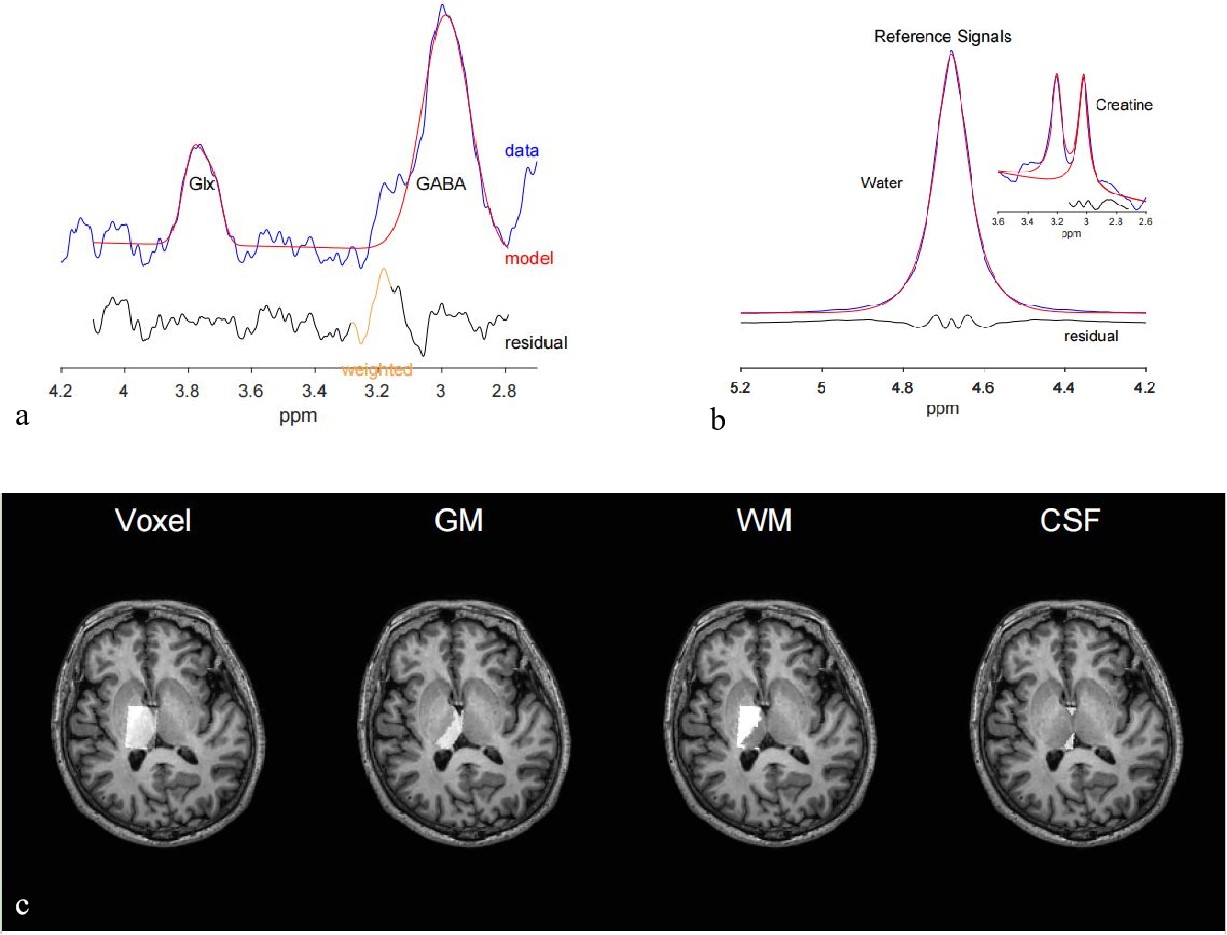
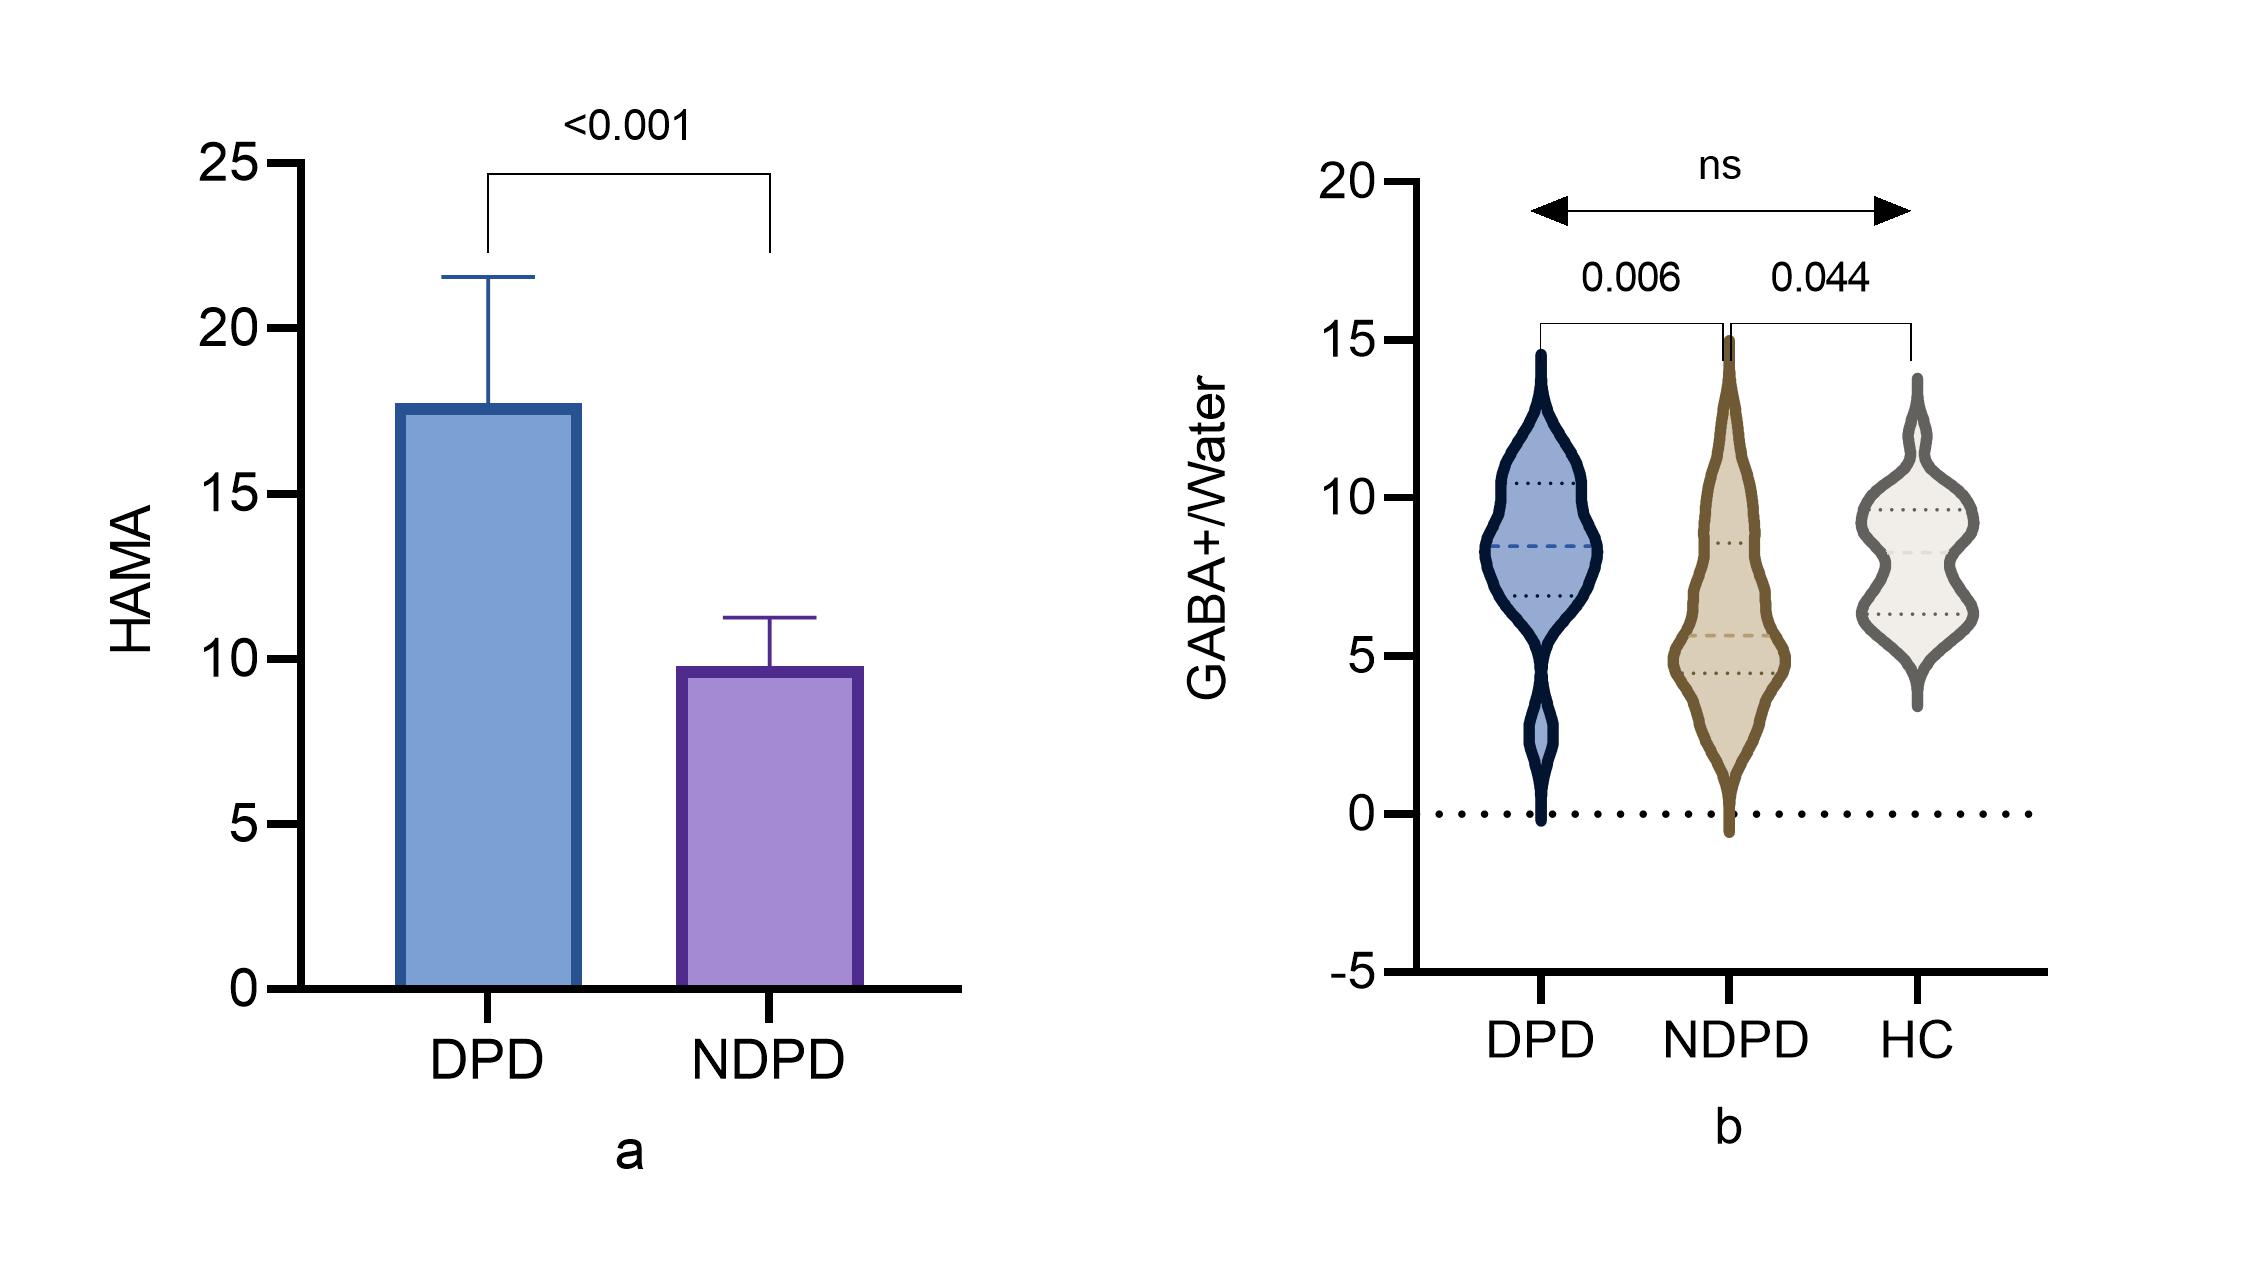
Figure 3.
a: The HAMA scores in DPD and NDPD;
b: The medial frontal cortex GABA+/Water in the 3 groups.